Copyright
©The Author(s) 2021.
World J Diabetes. Dec 15, 2021; 12(12): 2087-2095
Published online Dec 15, 2021. doi: 10.4239/wjd.v12.i12.2087
Published online Dec 15, 2021. doi: 10.4239/wjd.v12.i12.2087
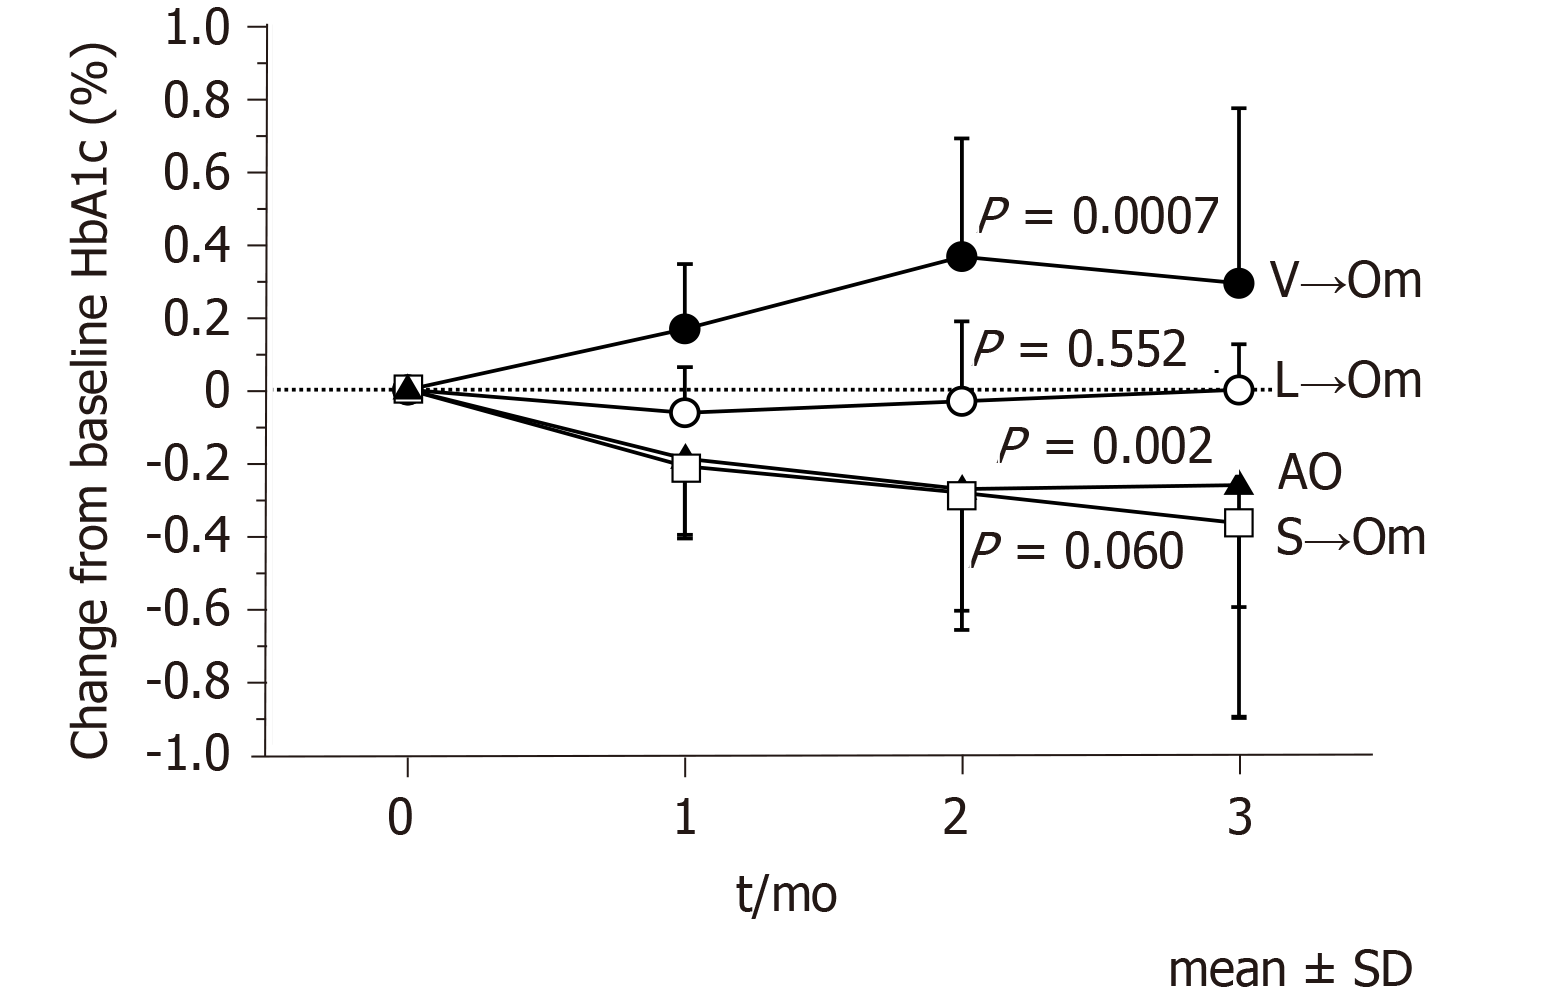
Figure 1 Changes in hemoglobin A1c levels in the subgroups at 3 mo follow-up.
A comparison of different time points within the same group was made using Friedman’s analysis of variance test for repeated measures. AO: Add-on; HbA1c: Hemoglobin A1c; L→Om: Switch from linagliptin to omarigliptin; S→Om: Switch from sitagliptin to omarigliptin; V→Om; Switch from vildagliptin to omarigliptin; SD: Standard deviation.
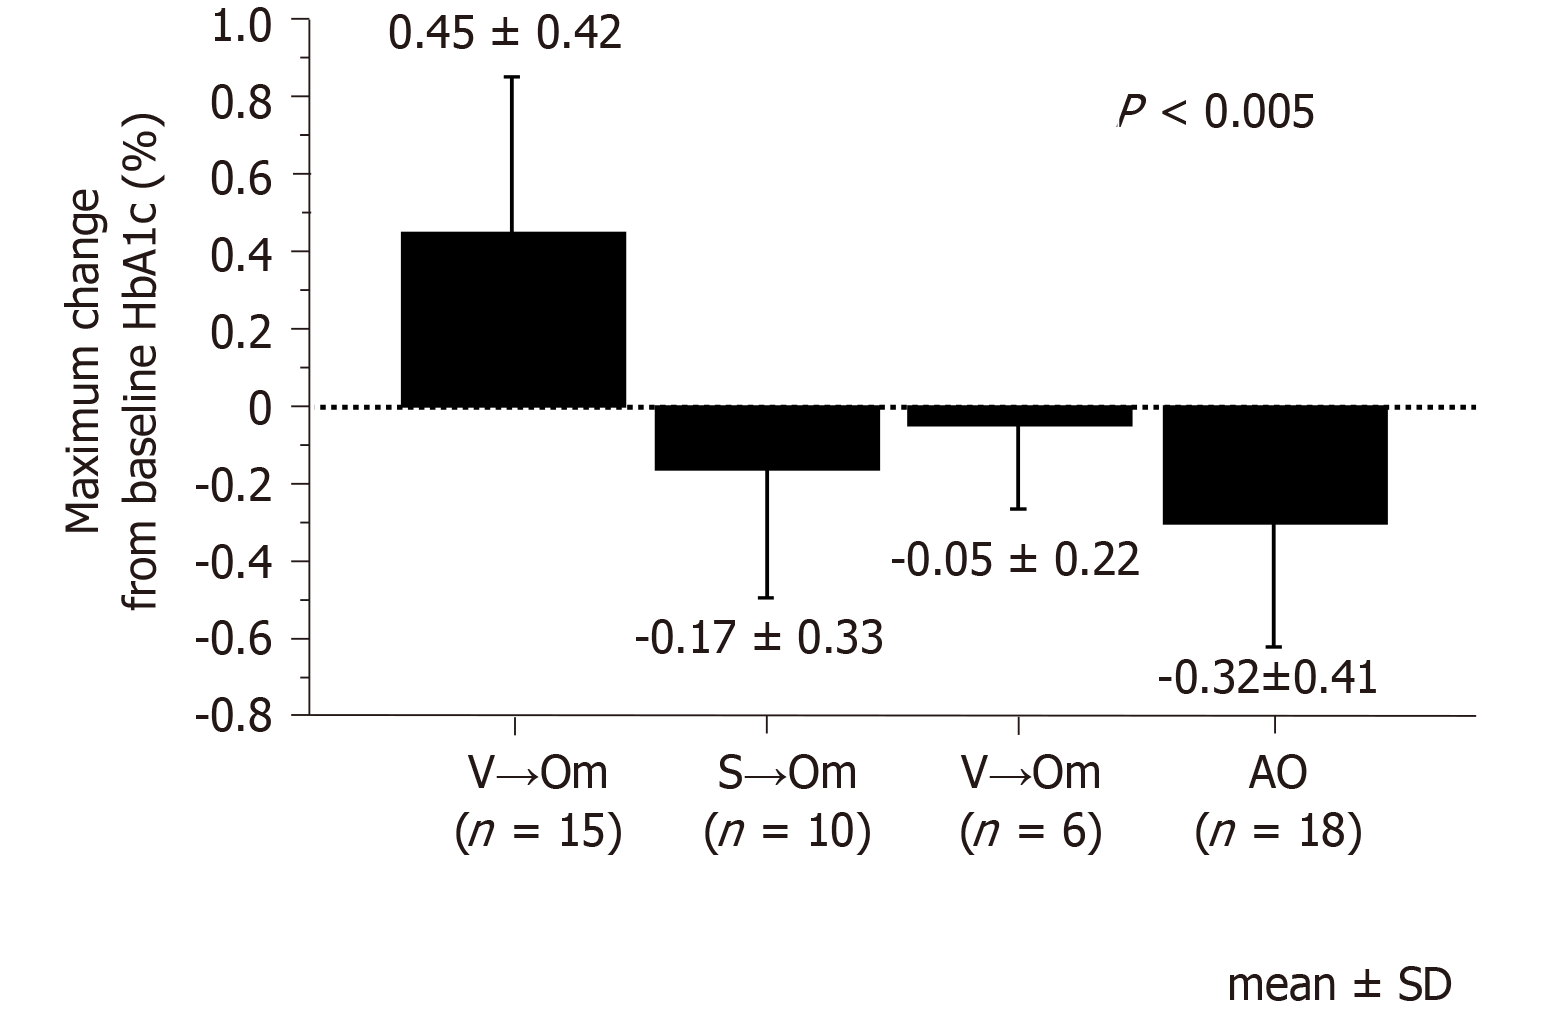
Figure 2 Maximum changes in hemoglobin A1c from baseline in the subgroups after omarigliptin administration.
The Kruskal-Wallis test was used to determine the differences and degree of significance (P < 0.05). AO: Add-on; HbA1c: Hemoglobin A1c; L→Om: Switch from linagliptin to omarigliptin; S→Om: Switch from sitagliptin to omarigliptin; V→Om; Switch from vildagliptin to omarigliptin; SD: Standard deviation.
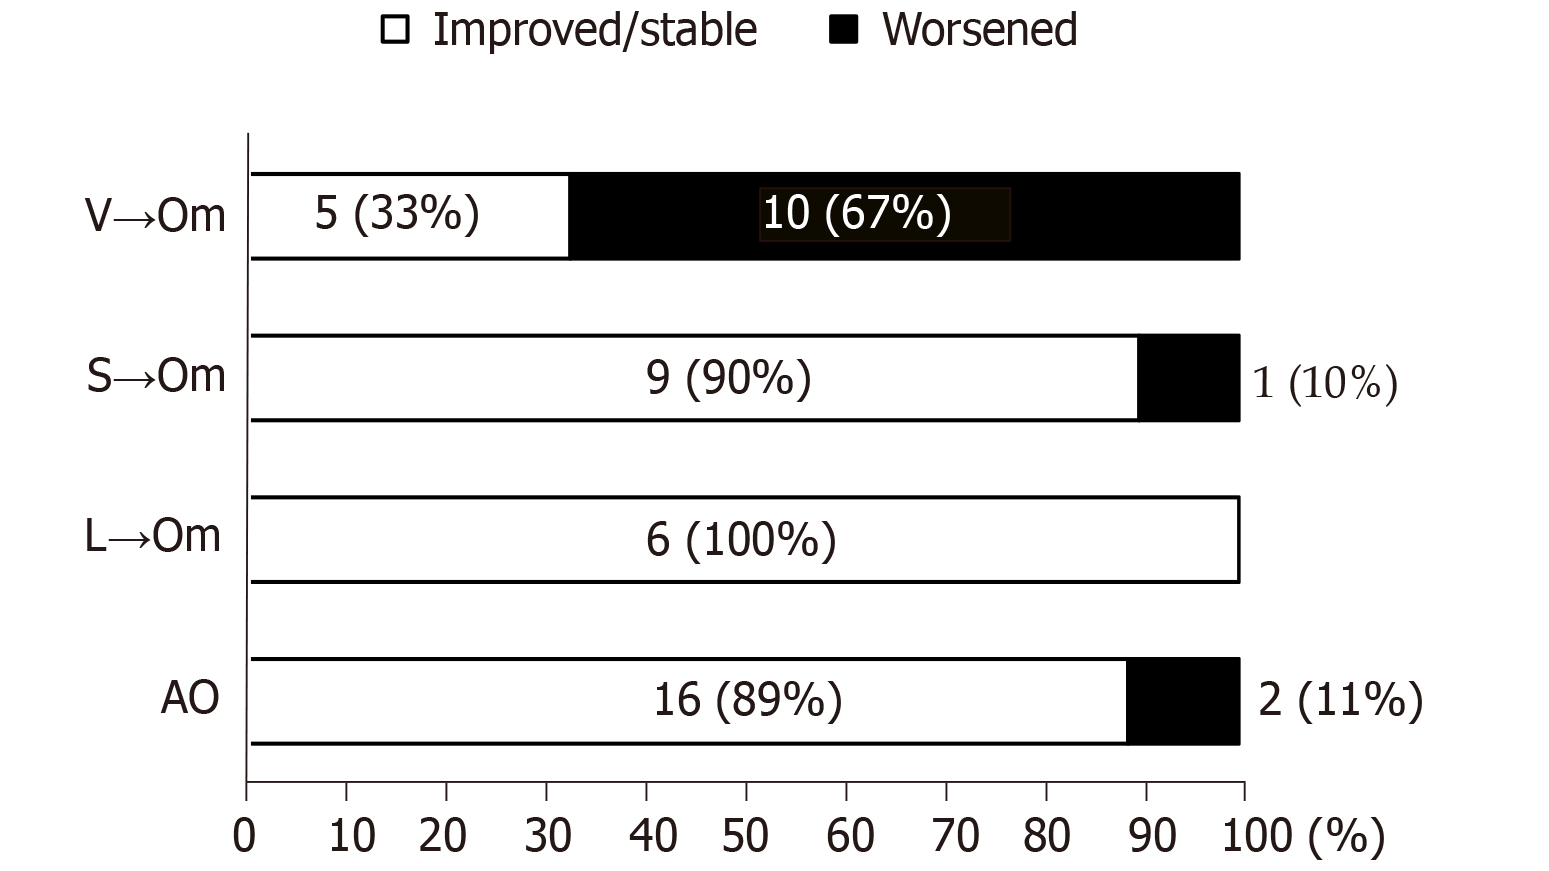
Figure 3 The prevalence of the improved/stable and worsened glycemic control after omarigliptin administration.
AO: Add-on; L→Om: Switch from linagliptin to omarigliptin; S→Om: Switch from sitagliptin to omarigliptin; V→Om; Switch from vildagliptin to omarigliptin.
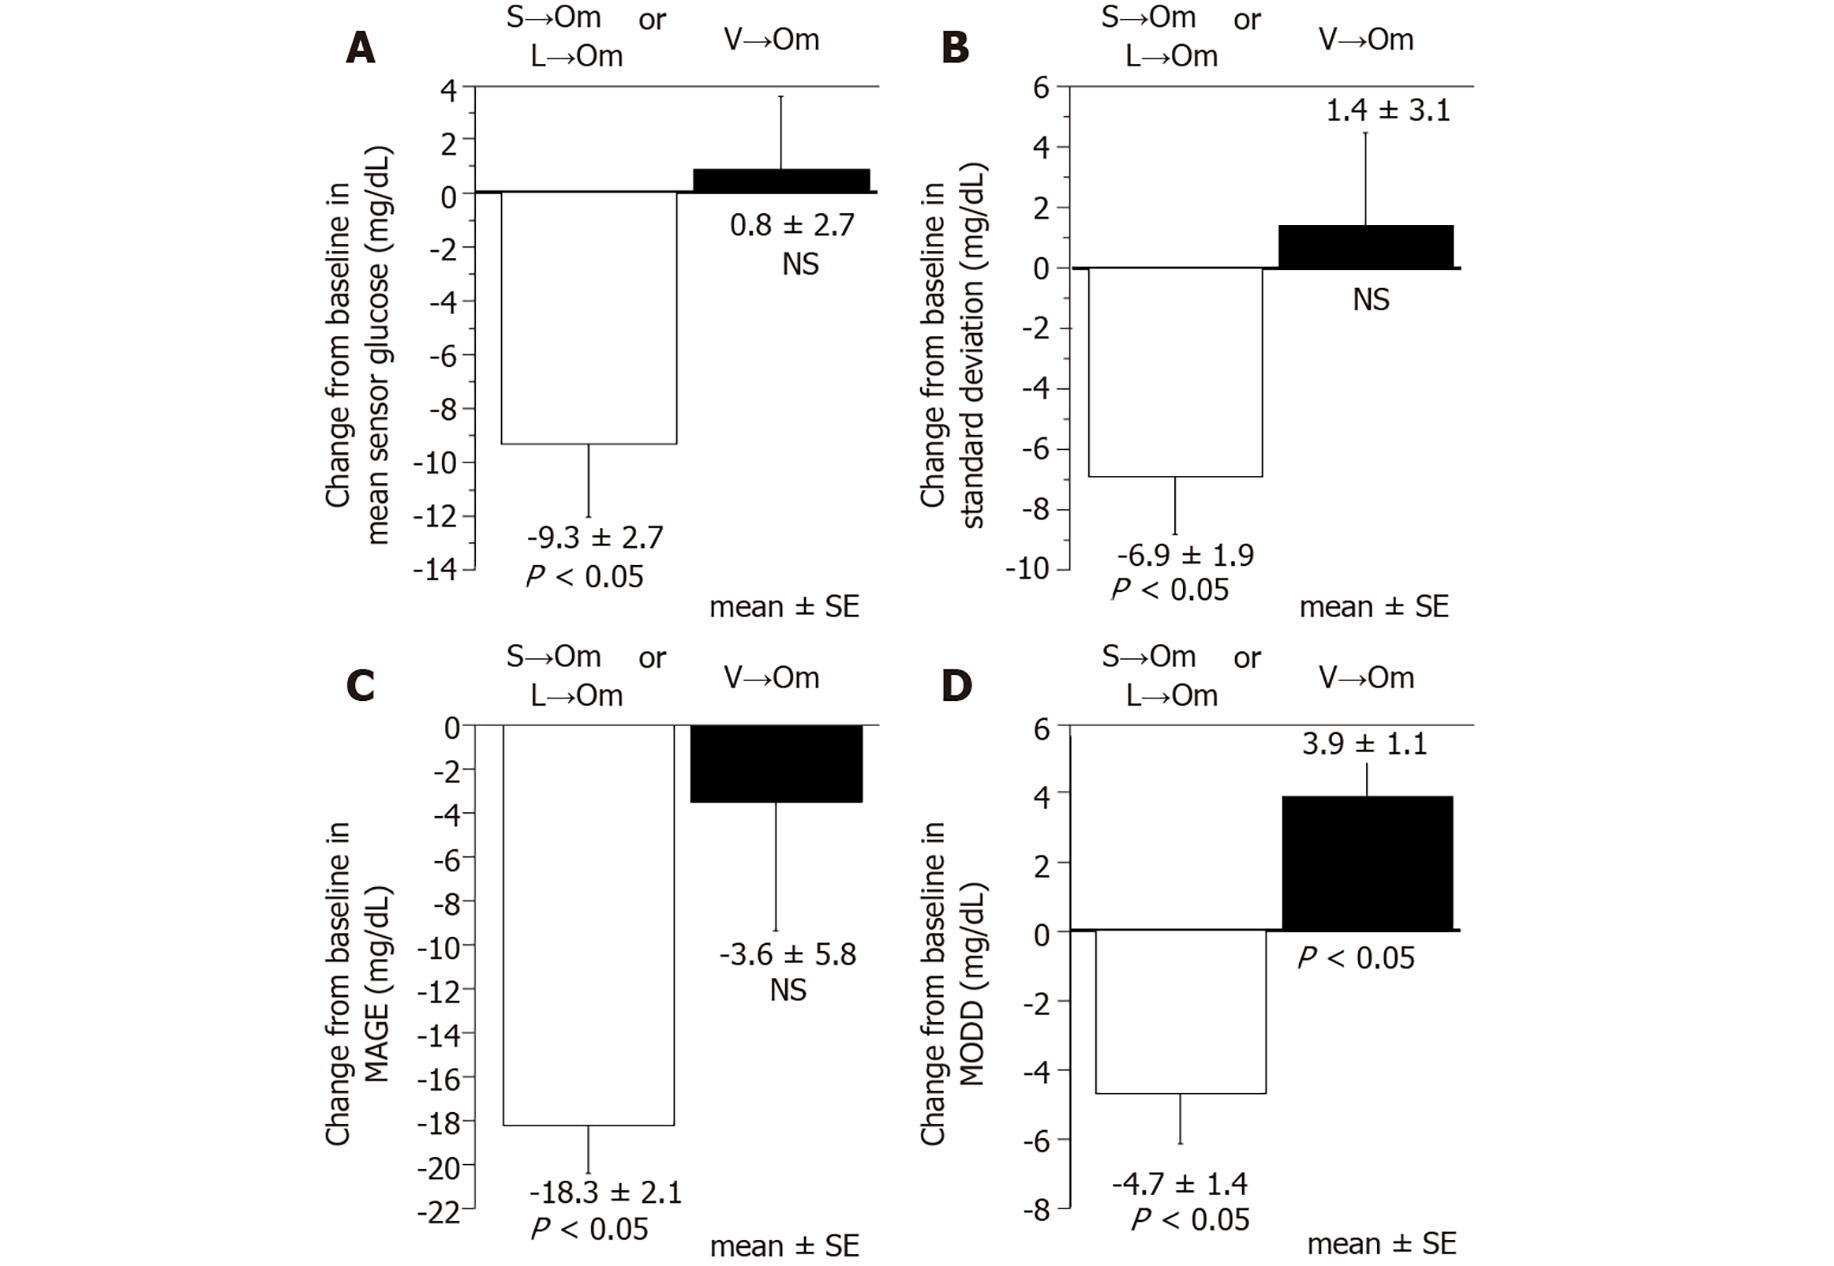
Figure 4 Change of glucose variability indices from baseline.
A: Mean sensor glucose; B: Standard deviation of sensor glucose; C: Mean amplitude of glycemic excursion (MAGE); D: Mean of daily difference (MODD). The Wilcoxon signed rank test was used to determine the differences and degree of significance. L→Om: Switch from linagliptin to omarigliptin; S→Om: Switch from sitagliptin to omarigliptin; V→Om; Switch from vildagliptin to omarigliptin; NS: Not significant; SE: Standard error.
- Citation: Kawasaki E, Nakano Y, Fukuyama T, Uchida A, Sagara Y, Tamai H, Tojikubo M, Hiromatsu Y, Koga N. Efficacy of omarigliptin, once-weekly dipeptidyl peptidase-4 inhibitor, in patients with type 2 diabetes. World J Diabetes 2021; 12(12): 2087-2095
- URL: https://www.wjgnet.com/1948-9358/full/v12/i12/2087.htm
- DOI: https://dx.doi.org/10.4239/wjd.v12.i12.2087


