Copyright
©The Author(s) 2021.
World J Diabetes. Nov 15, 2021; 12(11): 1894-1907
Published online Nov 15, 2021. doi: 10.4239/wjd.v12.i11.1894
Published online Nov 15, 2021. doi: 10.4239/wjd.v12.i11.1894
Figure 1 Expression of p66shc mRNA in peripheral blood mononuclear cells and placental tissue in women with and without gestational diabetes mellitus.
A: p66Shc mRNA expression in peripheral blood mononuclear cells determined by quantitative real-time PCR; B: Expression of p66Shc and dynamin-related protein 1 mRNA in placentas determined by qRT-PCR. aP < 0.01 vs control; bP < 0.05 vs control. Drp1: Dynamin-related protein 1’; GDM: gestational diabetes mellitus.
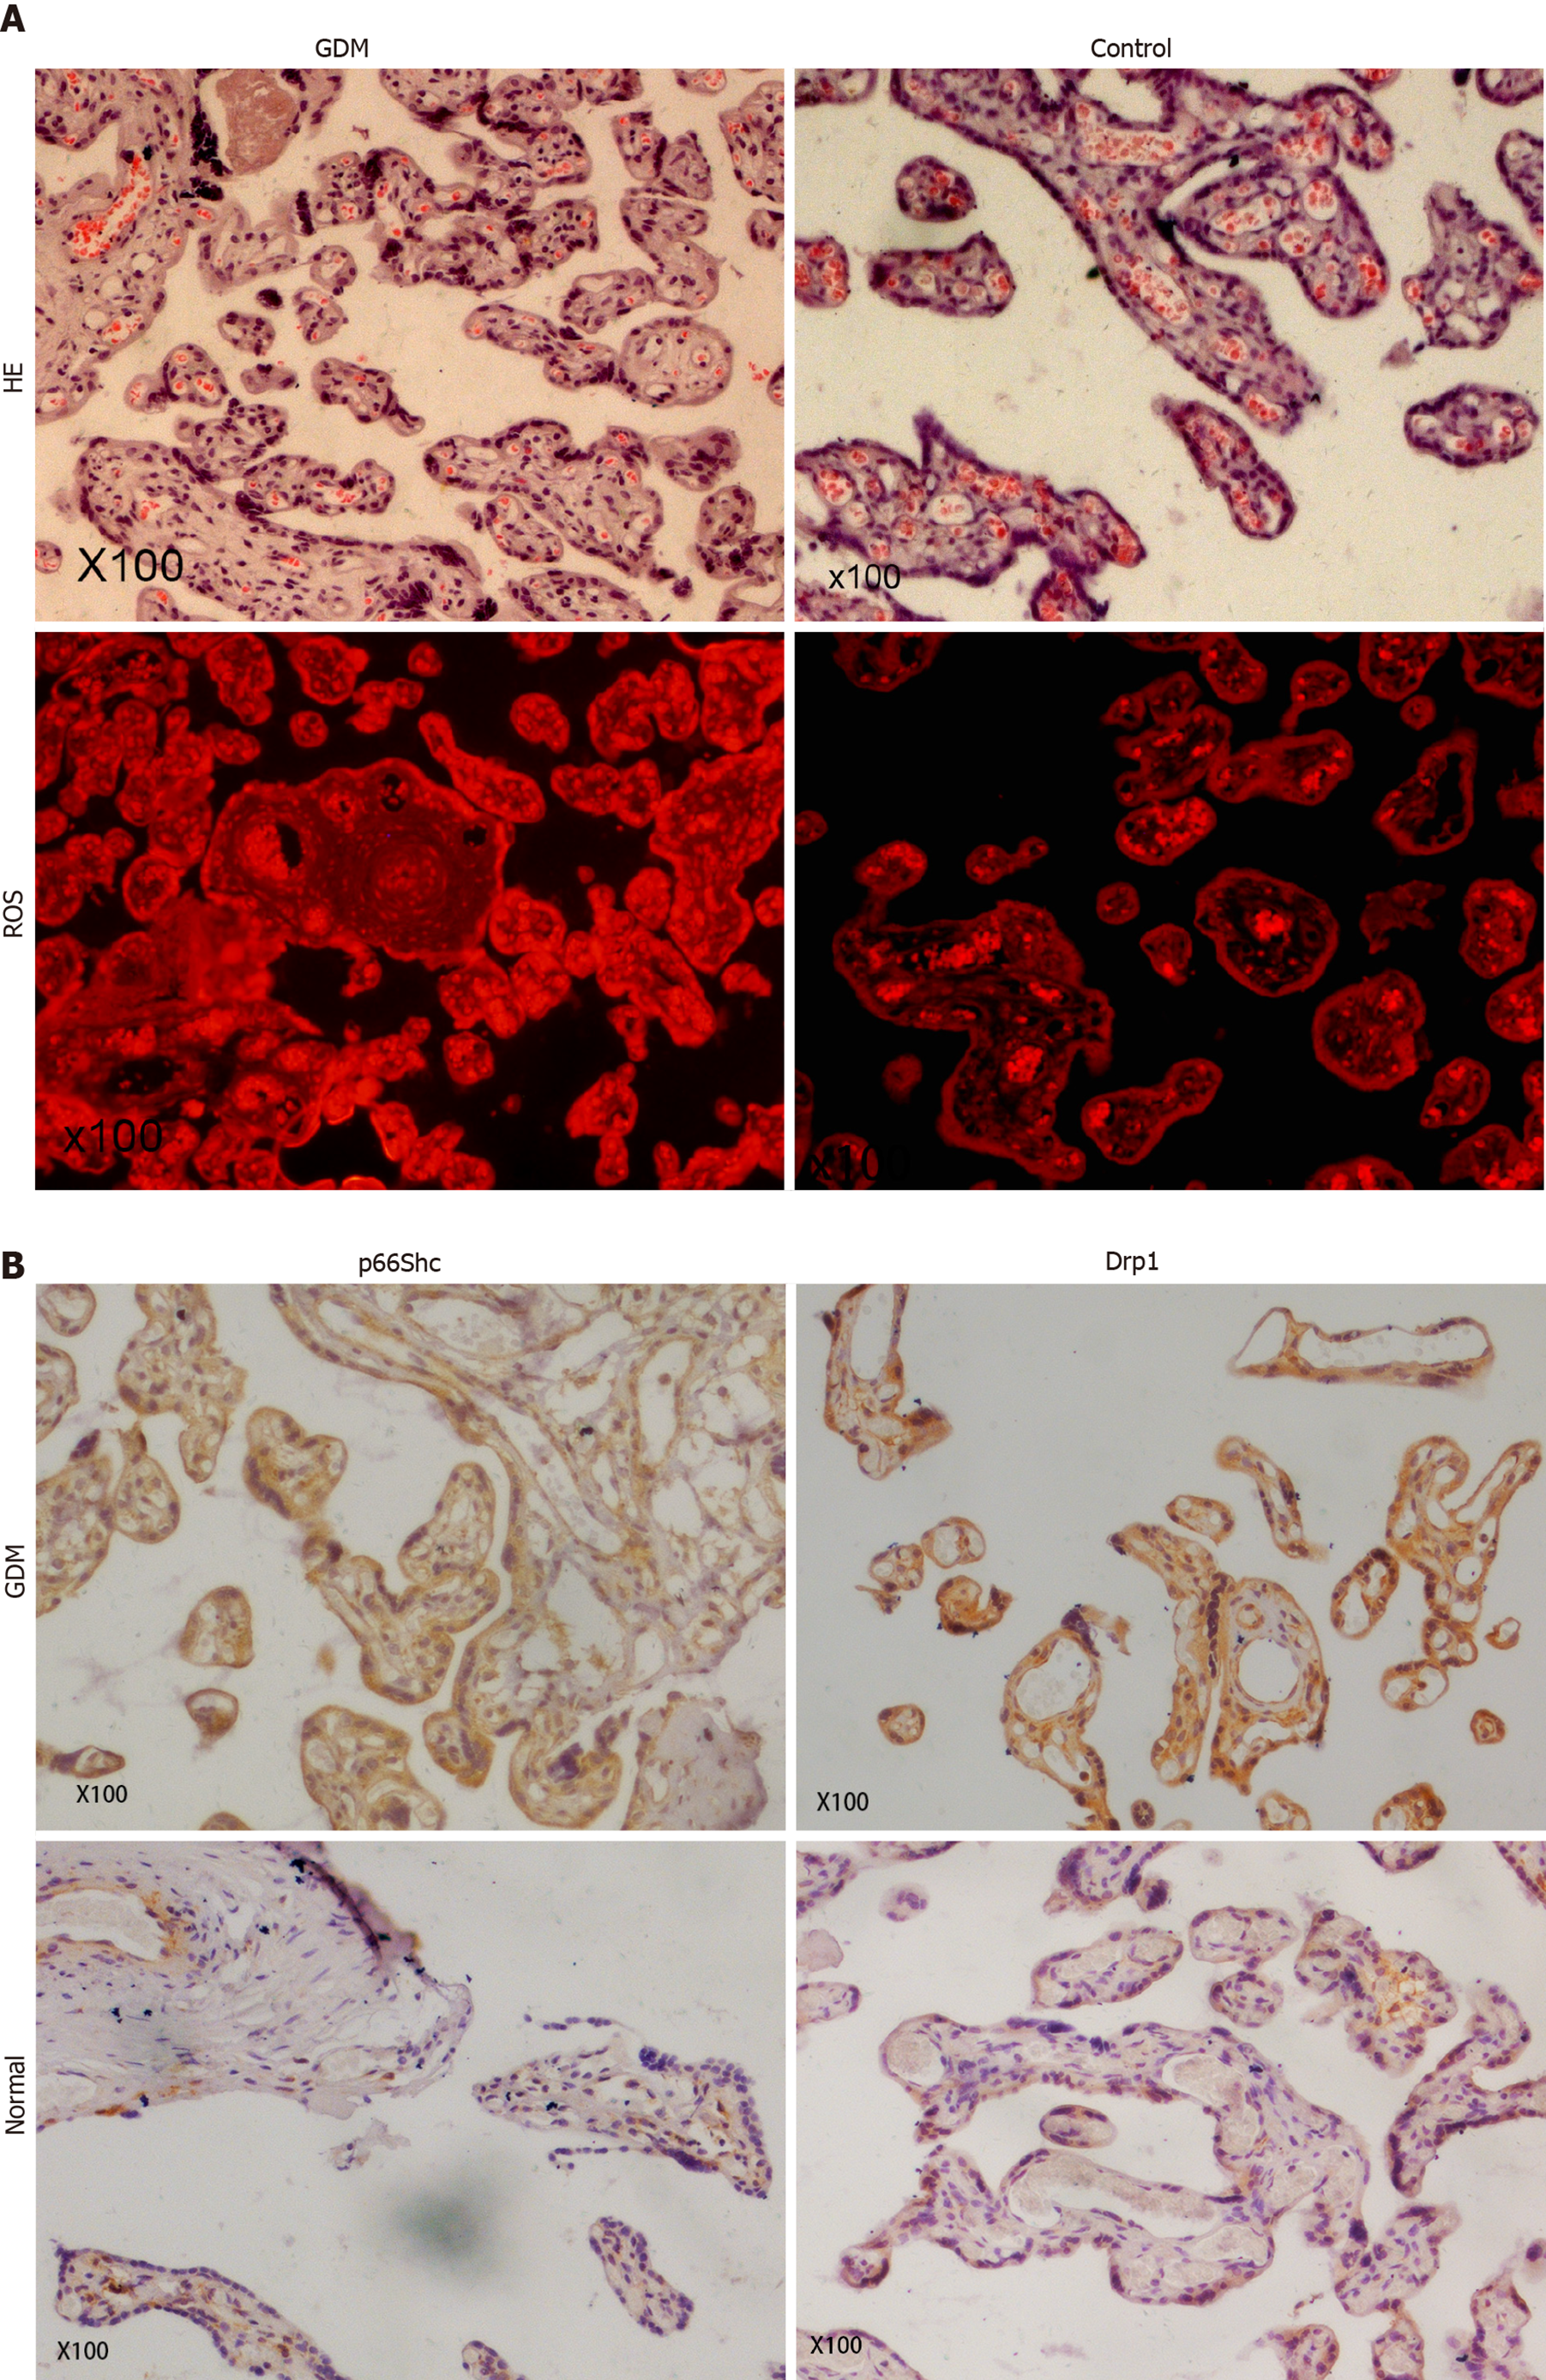
Figure 2 Pathophysiological changes in placentas from women with and without gestational diabetes mellitus.
A: Pathological changes in the placenta were observed by hematoxylin-eosin staining (× 100). The level of reactive oxygen species in the placentas was determined by dihydroethidium staining (× 100); B: Protein expression of p66Shc and dynamin-related protein 1 in placentas were determined by immunohistochemical staining (× 100). Drp1: Dynamin-related protein 1; GDM: Gestational diabetes mellitus; HE: Hematoxylin-eosin; ROS: Reactive oxygen species.
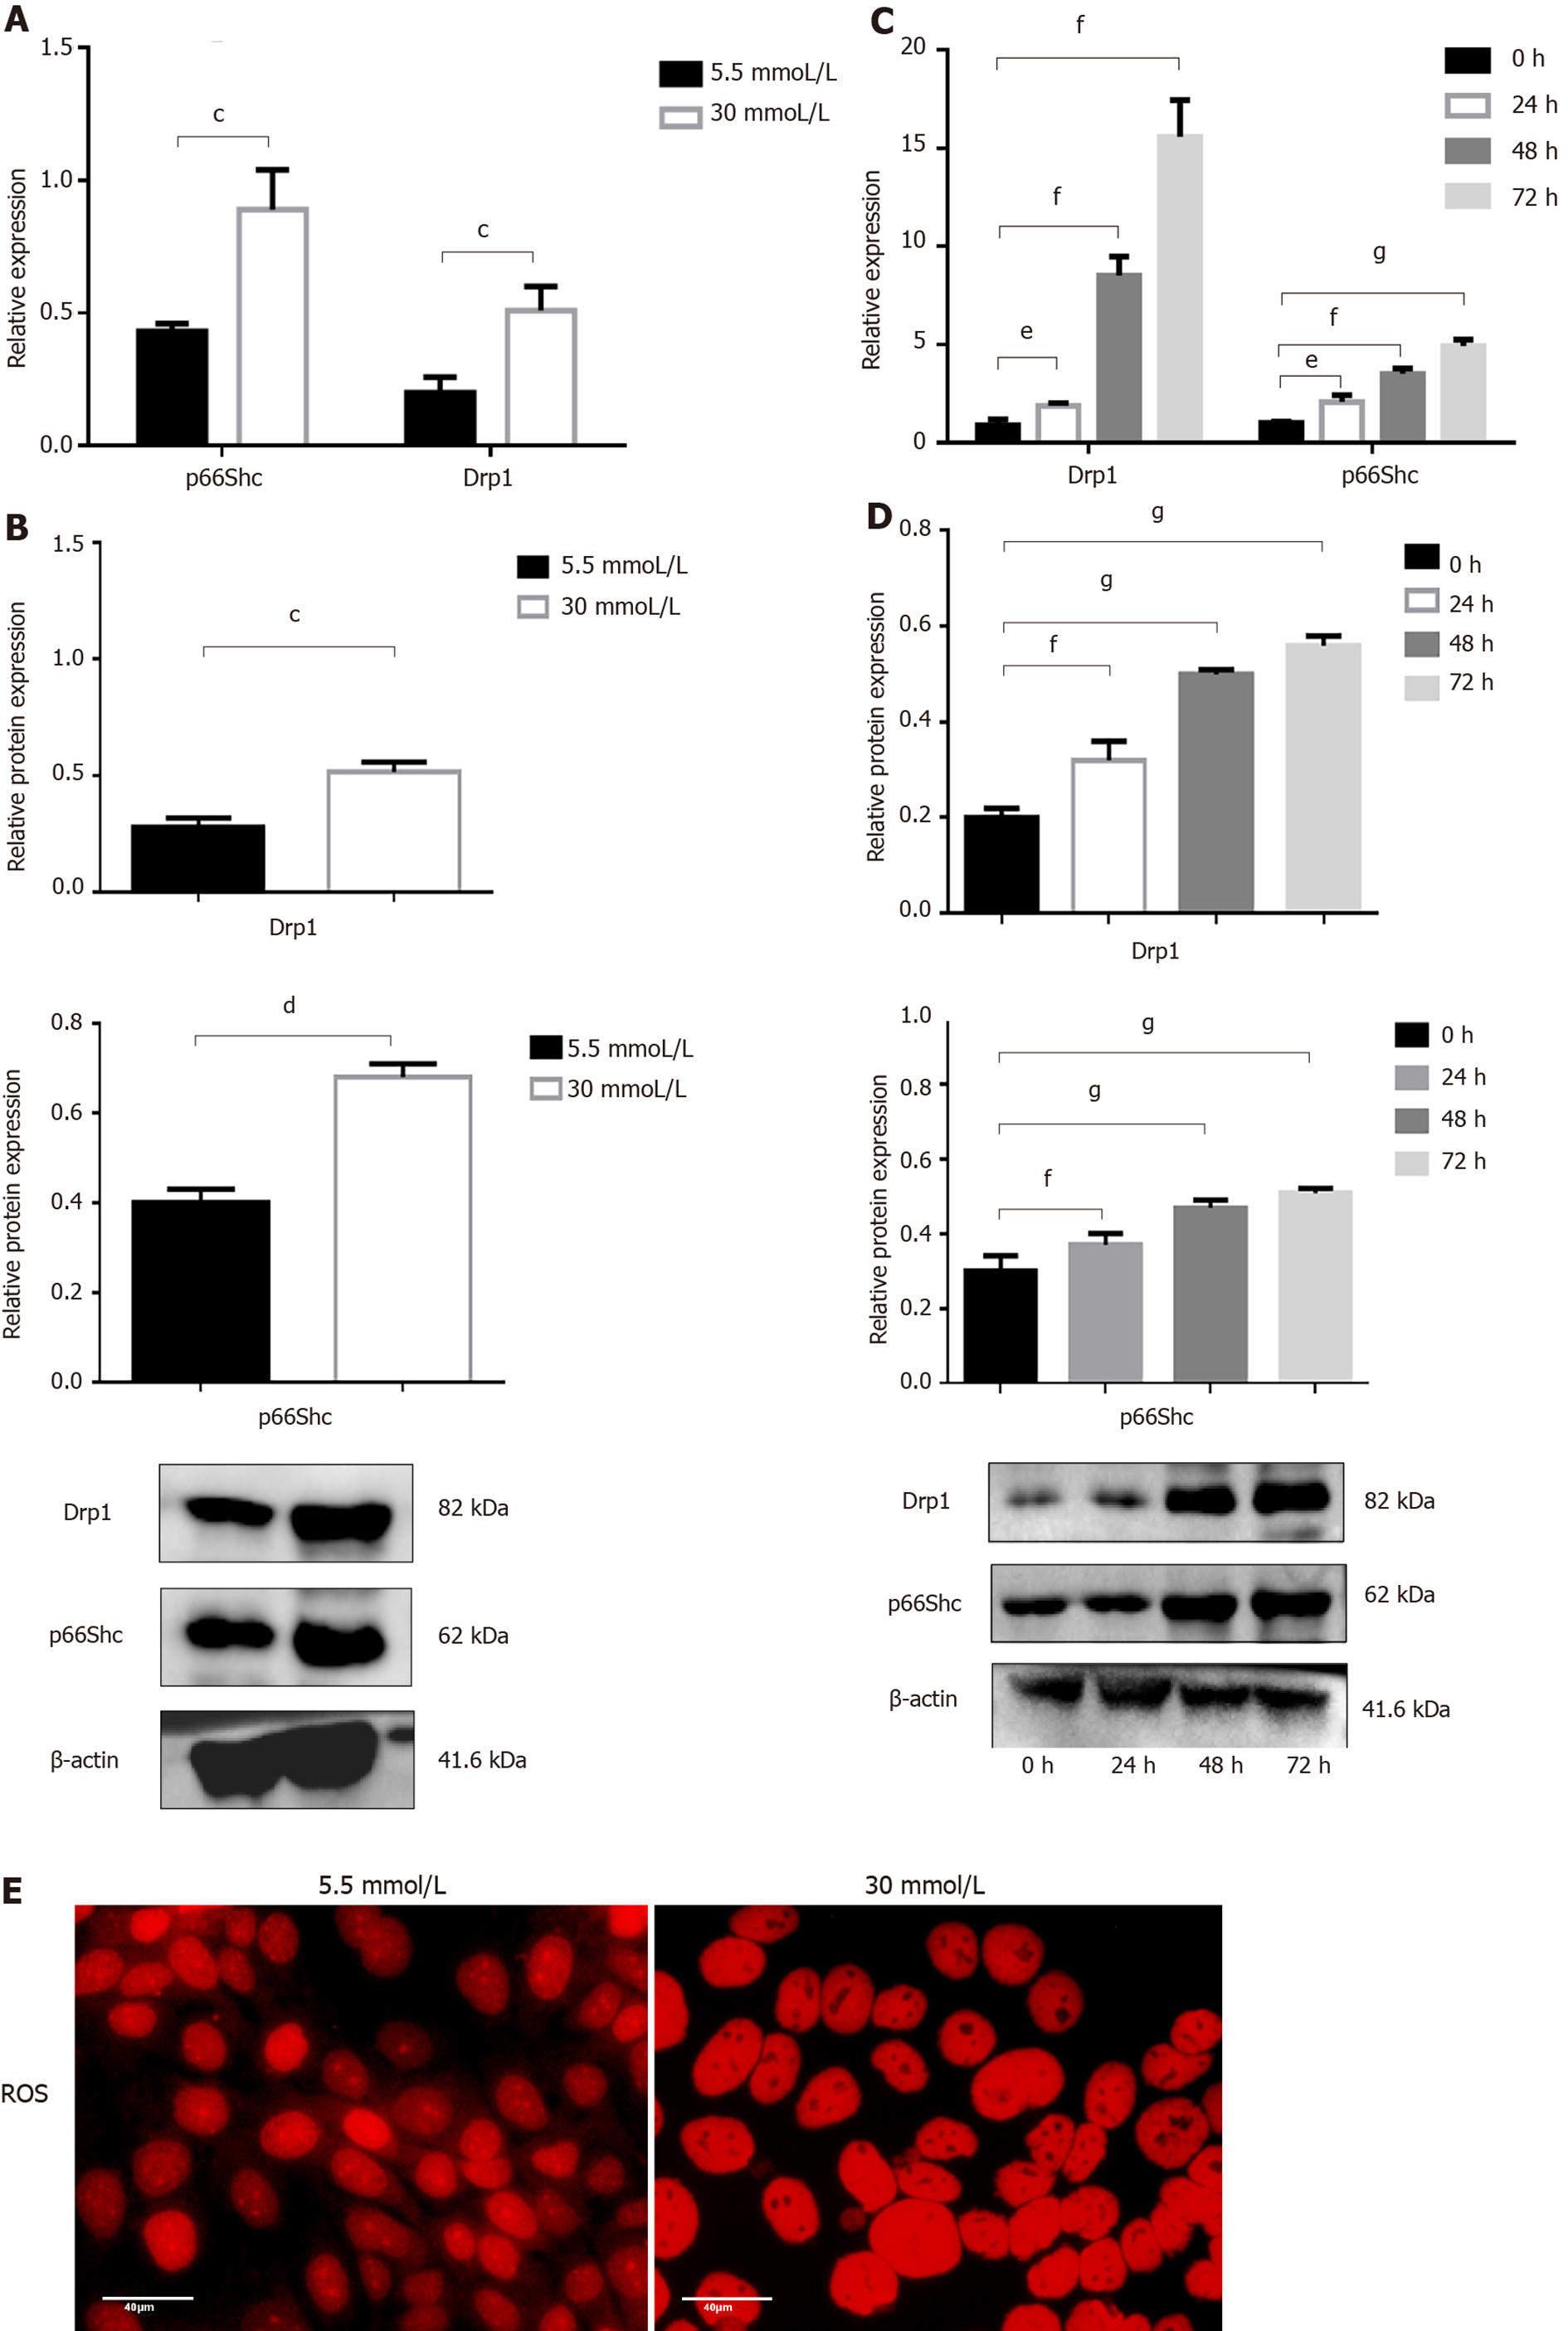
Figure 3 Expression of p66Shc and dynamin-related protein 1 in JEG3 cells treated with 5.
5 mmol/L or 30 mmol/L glucose. A: mRNA expression of dynamin-related protein 1 (Drp1) and p66Shc at 24 h were determined by quantitative real-time PCR); B: Protein expression of Drp1 and p66Shc at 24 h was determined by western blotting; C: Drp1 and p66Shc expression of at 0 h, 24 h, 48 h, and 72 h with 30 mmol/L was determined by quantitative real-time PCR; D: Expression of Drp1 and p66Shc at 0 h, 24 h, 48 h, and 72 h with 30 mmol/L were determined by western blotting; E: Reactive oxygen species at 24 h was determined by diluted dihydroethidium staining. cP < 0.05 vs 24 h in 5.5 mmol/L; dP < 0.01 vs 24 h in 5.5 mmol/L; eP < 0.05 vs 0 h in 30 mmol/L; fP < 0.01 vs 0 h in 30 mmol/L; gP < 0.001 vs 0 h in 30 mmol/L. Drp1: Dynamin-related protein 1; ROS: reactive oxygen species.
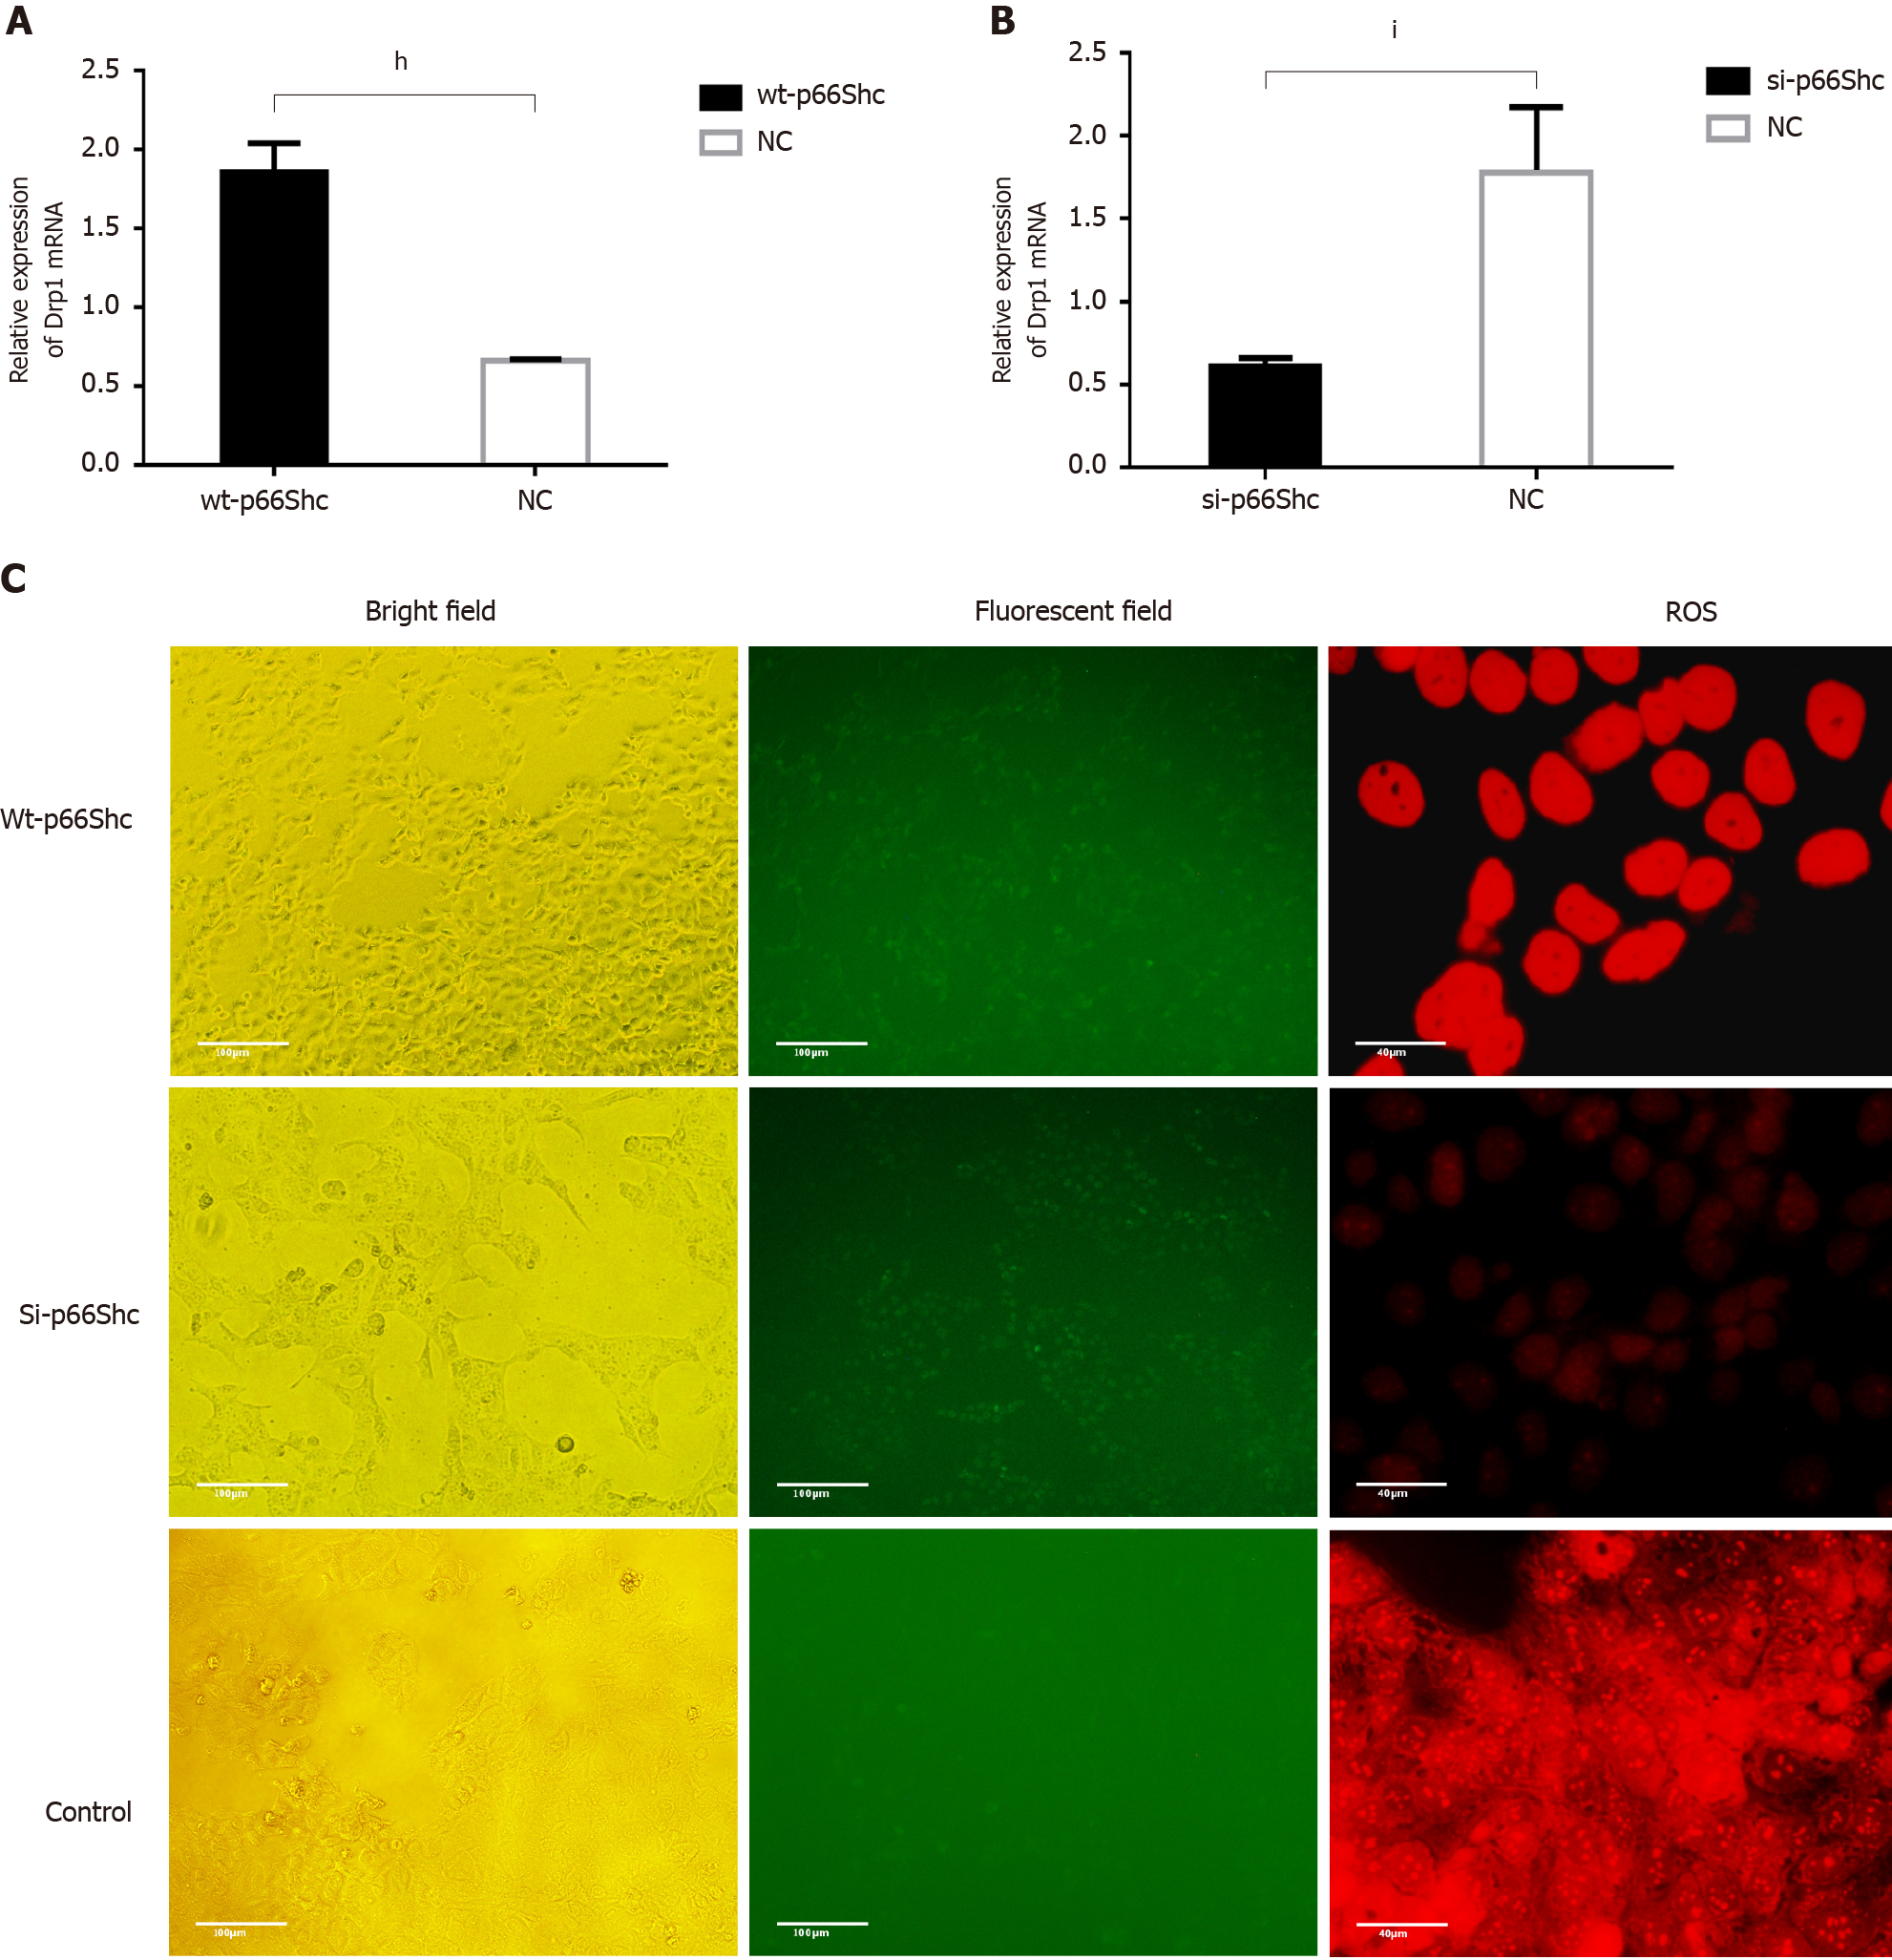
Figure 4 Expression of dynamin-related protein 1 and reactive oxygen species in JEG3 cells after transfection with wt-p66Shc, si-p66Shc, and negative controls.
A: mRNA expression of dynamin-related protein 1 (Drp1) in the wt-p66Shc and negative control (NC) cells was determined by quantitative real-time PCR; B: The mRNA expression of Drp1 in the si-p66Shc and NC groups was determined by qRT-PCR; C: The levels of ROS in the wt-p66Shc, si-p66Shc and NC groups were determined by diluted dihydroethidium staining. hP < 0.01 vs NC; iP < 0.05 vs NC. wt-p66Shc: Transfected with plasmid DNA; si-p66Shc: Transfected with siRNA; NC: Negative control; ROS: Reactive oxygen species; Drp1: Dynamin-related protein 1.
- Citation: Huang TT, Sun WJ, Liu HY, Ma HL, Cui BX. p66Shc-mediated oxidative stress is involved in gestational diabetes mellitus. World J Diabetes 2021; 12(11): 1894-1907
- URL: https://www.wjgnet.com/1948-9358/full/v12/i11/1894.htm
- DOI: https://dx.doi.org/10.4239/wjd.v12.i11.1894


