Copyright
©The Author(s) 2021.
World J Diabetes. Oct 15, 2021; 12(10): 1622-1654
Published online Oct 15, 2021. doi: 10.4239/wjd.v12.i10.1622
Published online Oct 15, 2021. doi: 10.4239/wjd.v12.i10.1622
Figure 1 Functional structure of estrogen receptors α and estrogen receptors β.
Dominion names (A to F), and common denominations for the main functions are included: N-terminus dominion; DNA binding dominion, activation function site 1 of the estrogen receptors and activation function site 2 of the estrogen receptors. The graph is not drawn to scale and represents the complete (highest molecular weight) form for each of the two families of nuclear ERs. NTD: N-terminus dominion; DBD: DNA binding dominion; AF1: Activation function site 1 of the estrogen receptors; AF2: Activation function site 2 of the estrogen receptors.
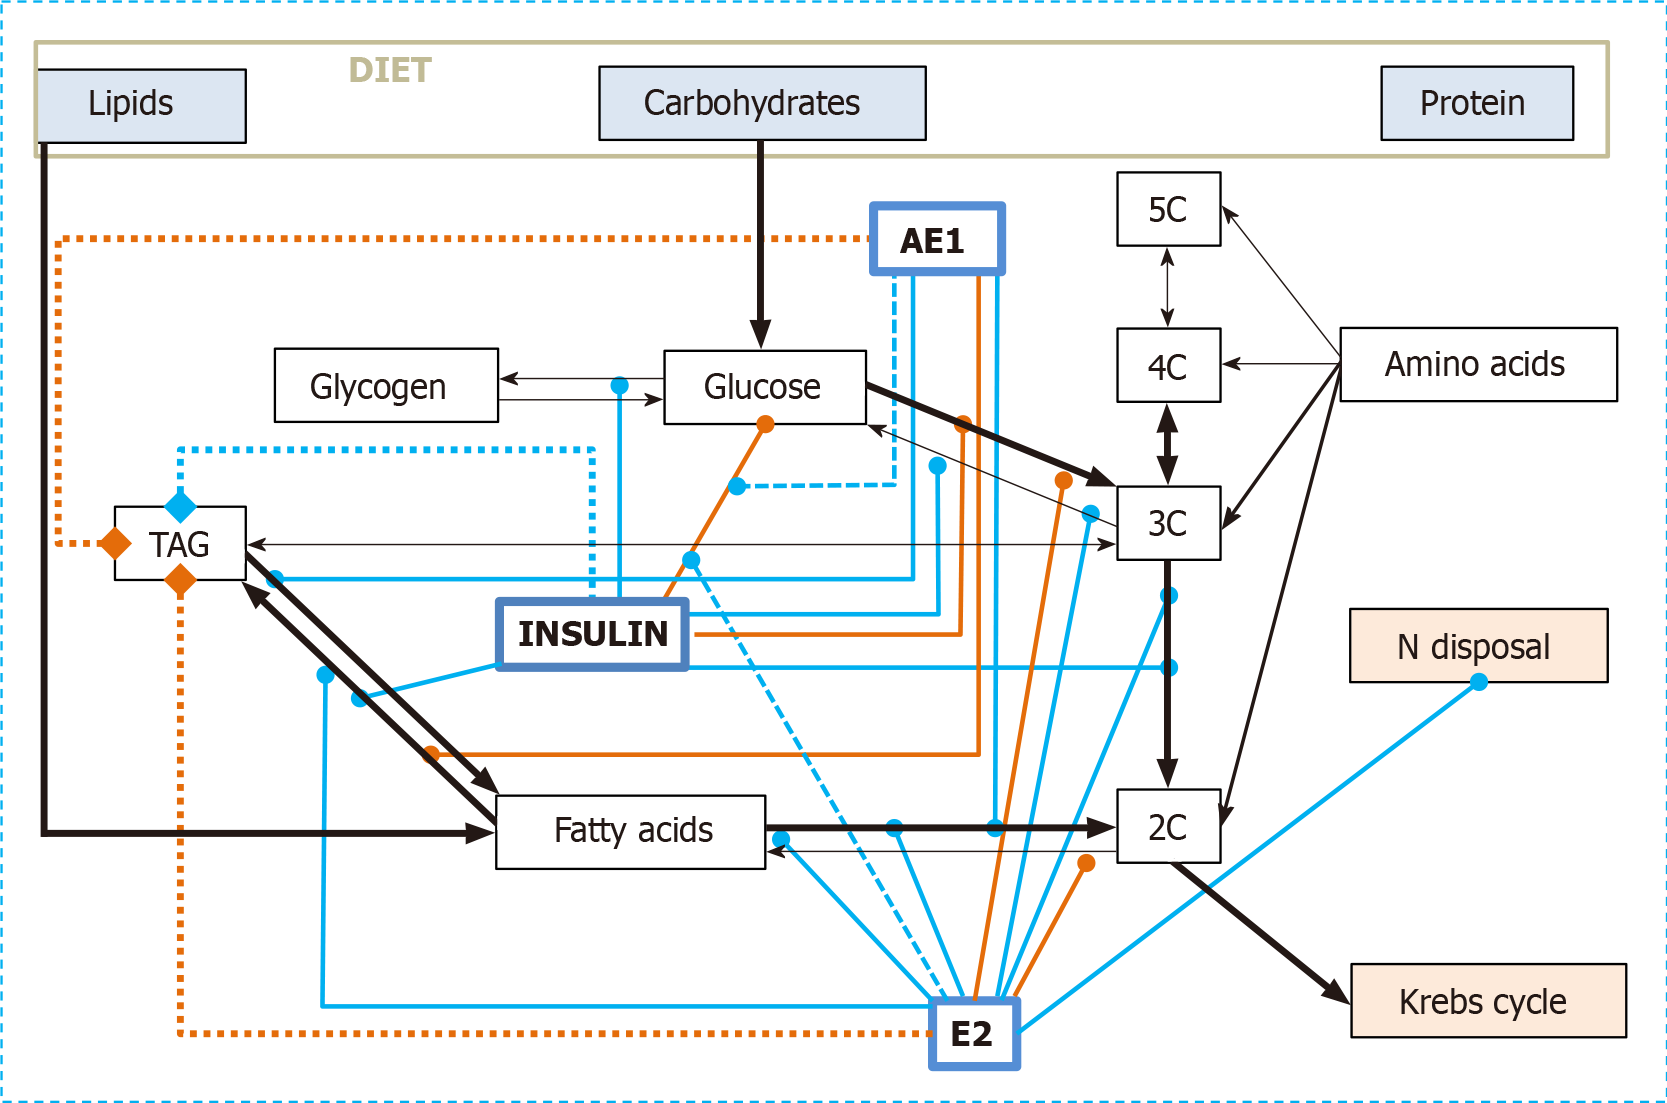
Figure 2 Combined regulatory effects on the utilization of dietary nutrients as energy substrates of insulin, 17β-estradiol and acyl-estrone.
Black arrows: Metabolic relationships; solid green lines: activation/enhancement; solid red lines: deactivation/inhibition. Dashed green lines show activation effects on regulatory processes. Thicker dot lines with final diamond symbols represent the enhancement (green) or decrement (red) of TAG reserves. For the sake of simplicity, other regulatory agents are not shown, and neither are their interactions. AE1: Acyl-estrone; E2: 17β-estradiol and other E2-group estrogens
- Citation: Alemany M. Estrogens and the regulation of glucose metabolism. World J Diabetes 2021; 12(10): 1622-1654
- URL: https://www.wjgnet.com/1948-9358/full/v12/i10/1622.htm
- DOI: https://dx.doi.org/10.4239/wjd.v12.i10.1622


