Copyright
©The Author(s) 2020.
World J Diabetes. Apr 15, 2020; 11(4): 100-114
Published online Apr 15, 2020. doi: 10.4239/wjd.v11.i4.100
Published online Apr 15, 2020. doi: 10.4239/wjd.v11.i4.100
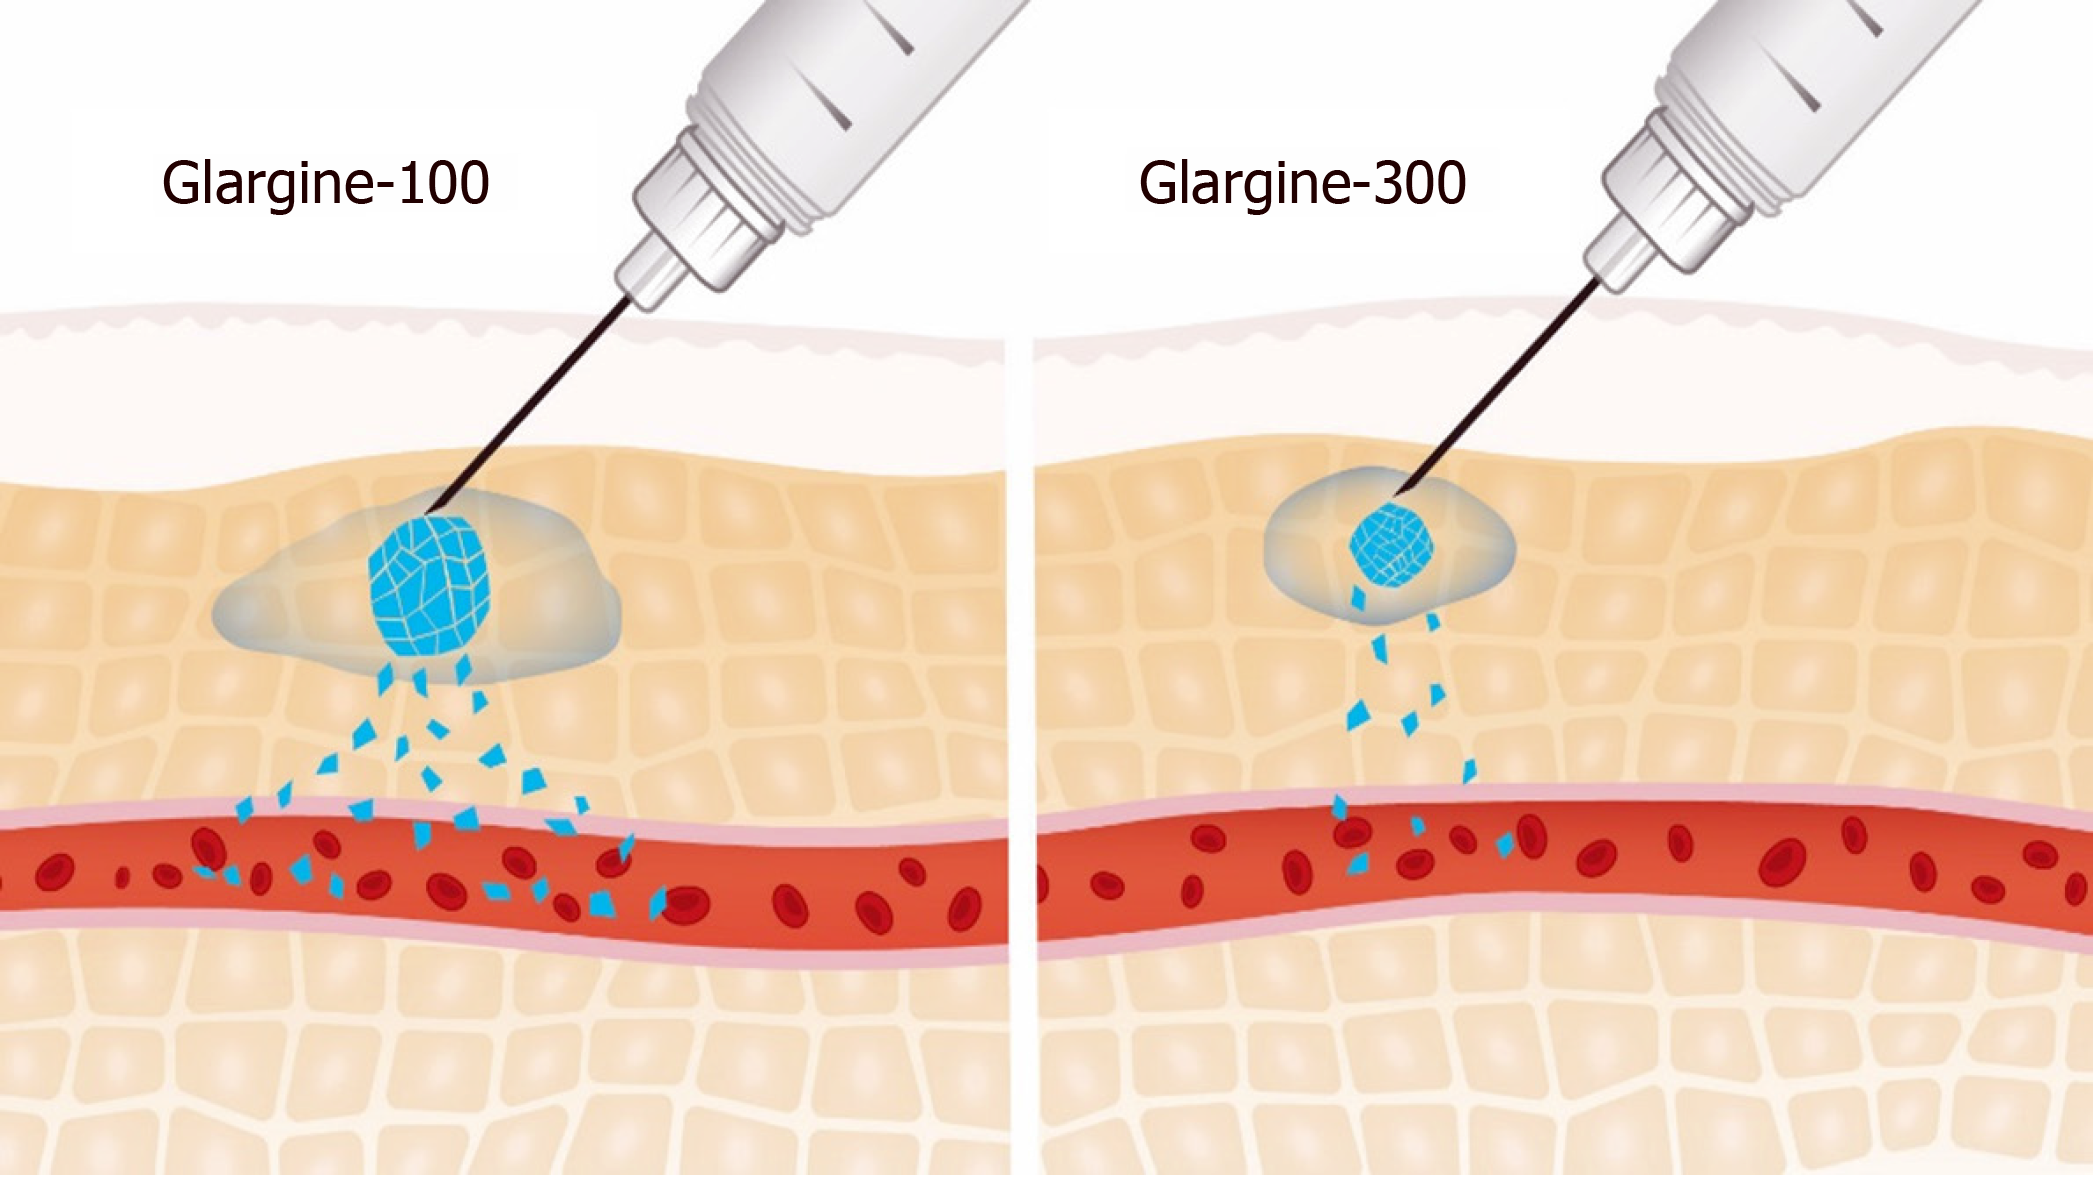
Figure 1 Surface area of subcutaneous depot: Gla-100 and Gla-300.
Adapted from[12].
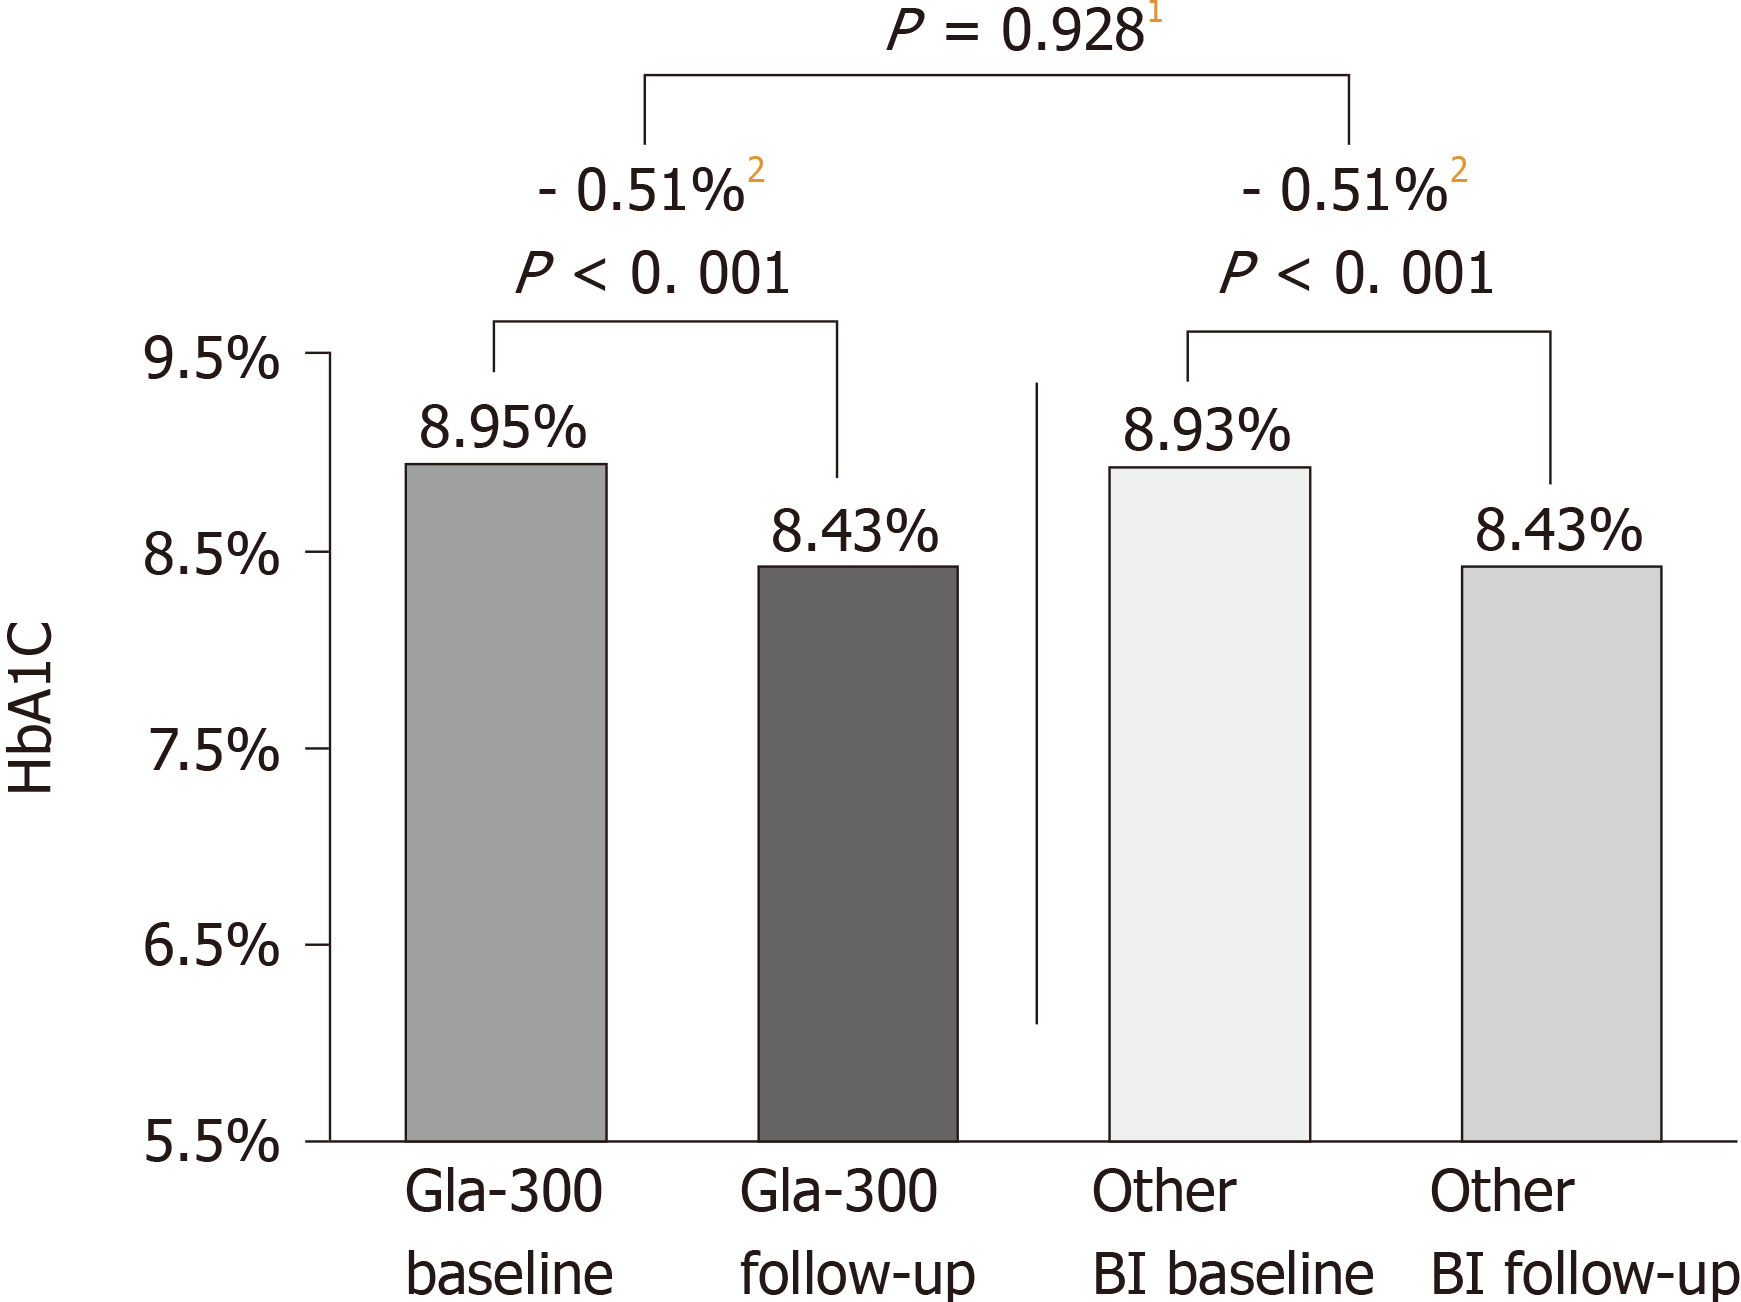
Figure 2 Glycated haemoglobin change during the 6‐mo follow‐up period (DELIVER 2 Study)[41].
DELIVER 2, a retrospective analysis of electronic medical records from the Predictive Health Intelligence Environment database. 1Comparison of mean reduction in Gla‐300 vs other basal insulin. 2Magnitude of HbA1c change. BI: Basal insulin; Gla-300: Insulin glargine 300 U/mL; HbA1c: Glycated haemoglobin.
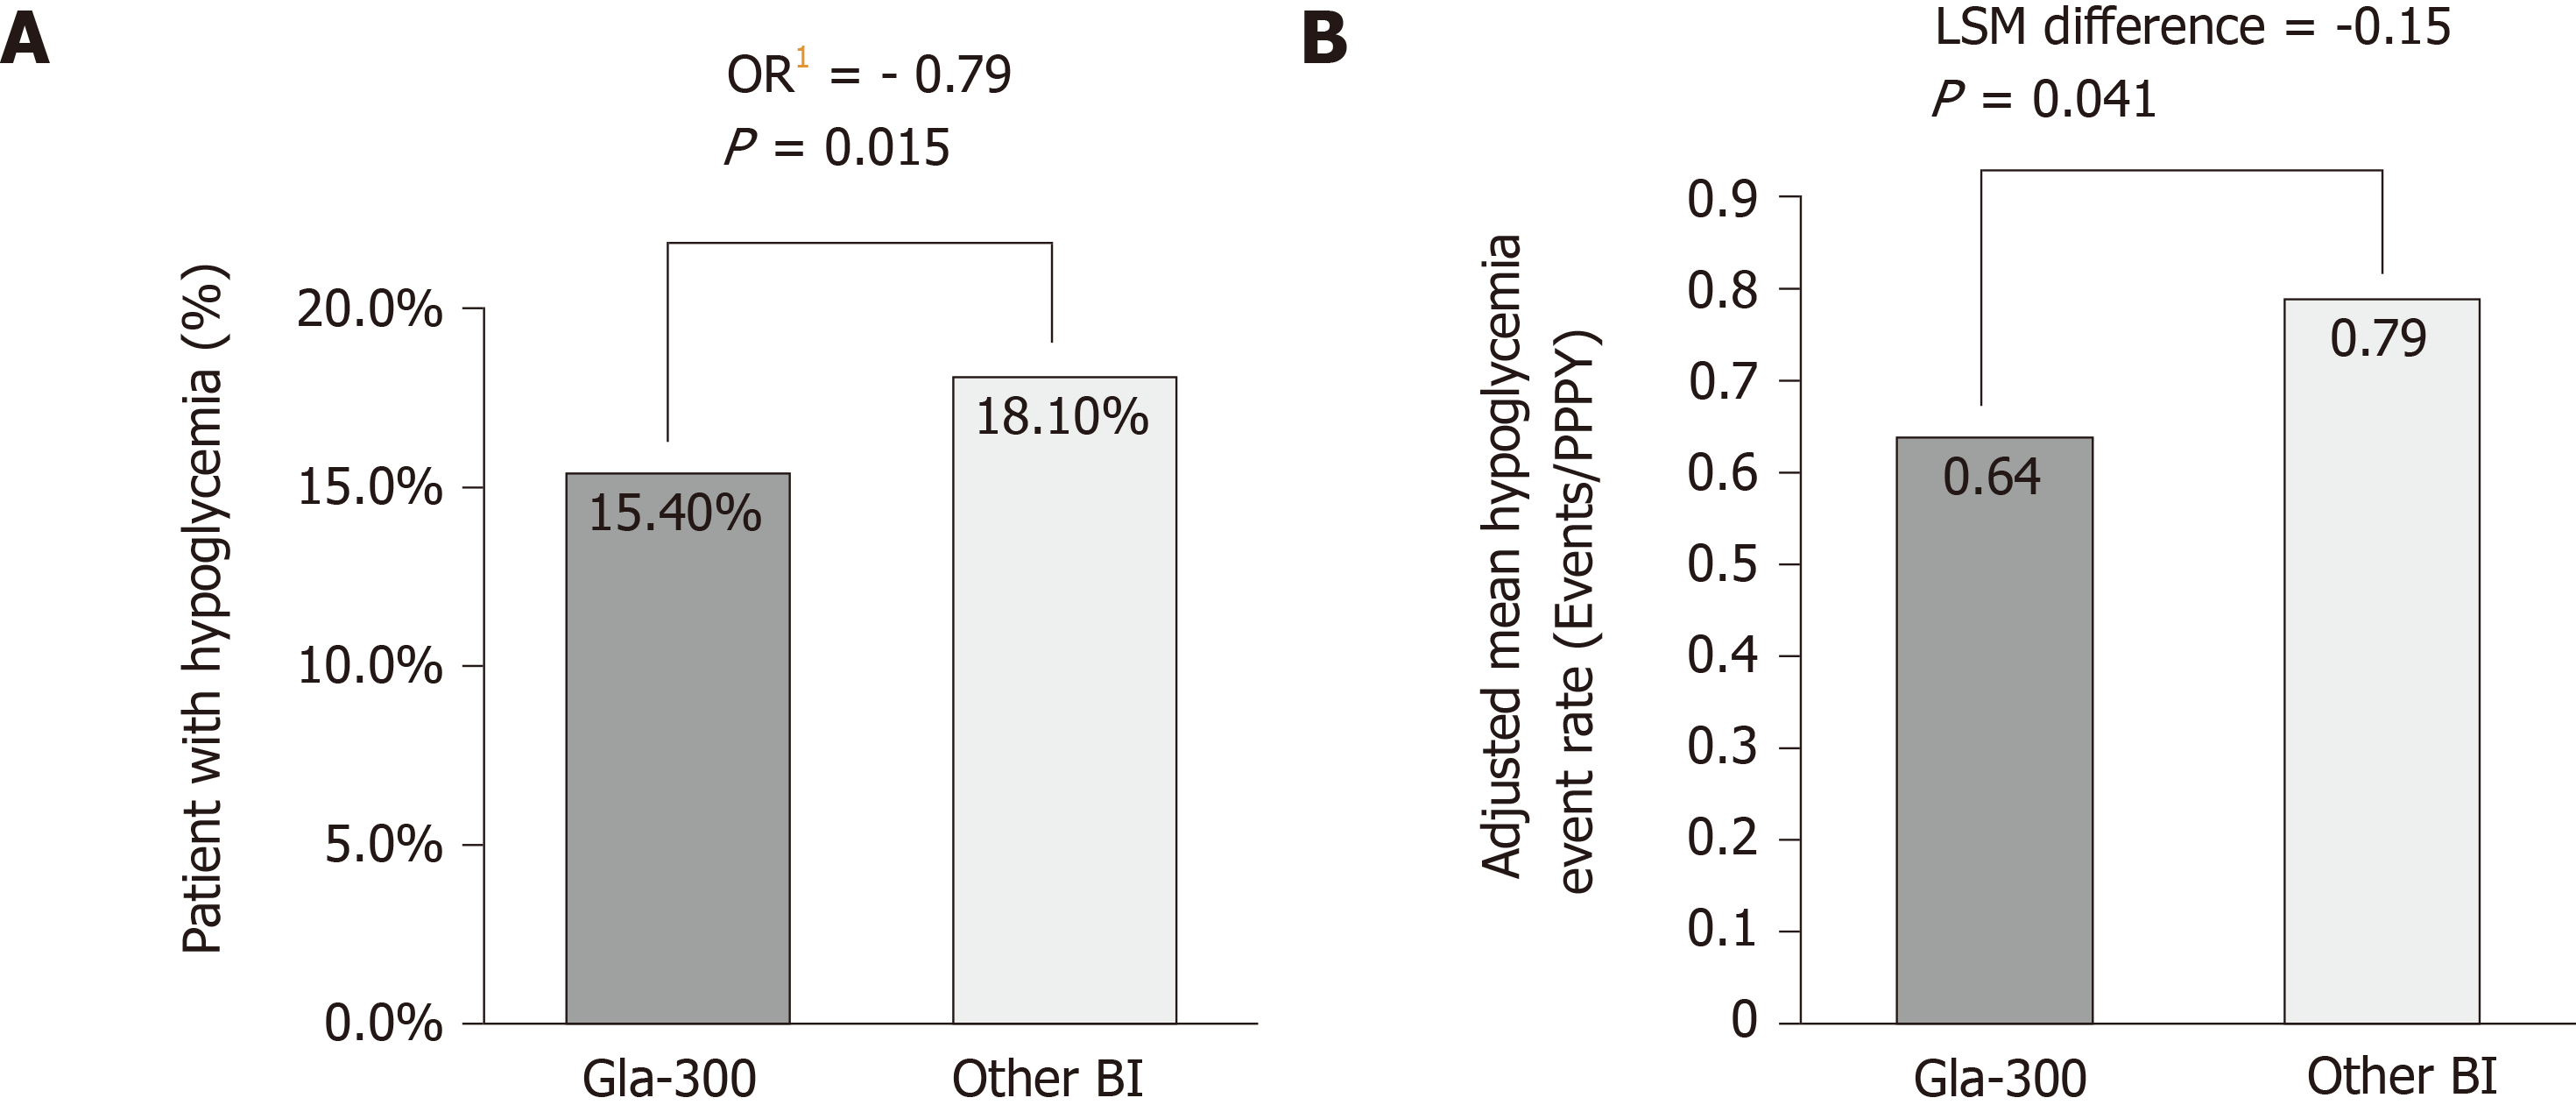
Figure 3 Hypoglycaemia incidence and event rate (DELIVER 2 study)[41].
A: Percentage of patients with hypoglycemia1 at 6-mo after basal insulin switch by insulin type; B: Adjusted mean hypoglycemia event rate2 (Events/Per patient per year) during 6-mo follow-up. DELIVER 2, a retrospective analysis of electronic medical records from the Predictive Health Intelligence Environment database. 1Adjusted for baseline hypoglycaemia incidence; 2Adjusted for baseline hypoglycaemia event rate. BI: Basal insulin; Gla-300: Insulin glargine 300 U/mL; HbA1c: Glycated haemoglobin; OR: Odds ratio; PPPY: Per patient per year.
- Citation: Ghosh S, Ghosh R. Glargine-300: An updated literature review on randomized controlled trials and real-world studies. World J Diabetes 2020; 11(4): 100-114
- URL: https://www.wjgnet.com/1948-9358/full/v11/i4/100.htm
- DOI: https://dx.doi.org/10.4239/wjd.v11.i4.100


