Copyright
©The Author(s) 2019.
World J Diabetes. Dec 15, 2019; 10(12): 560-580
Published online Dec 15, 2019. doi: 10.4239/wjd.v10.i12.560
Published online Dec 15, 2019. doi: 10.4239/wjd.v10.i12.560
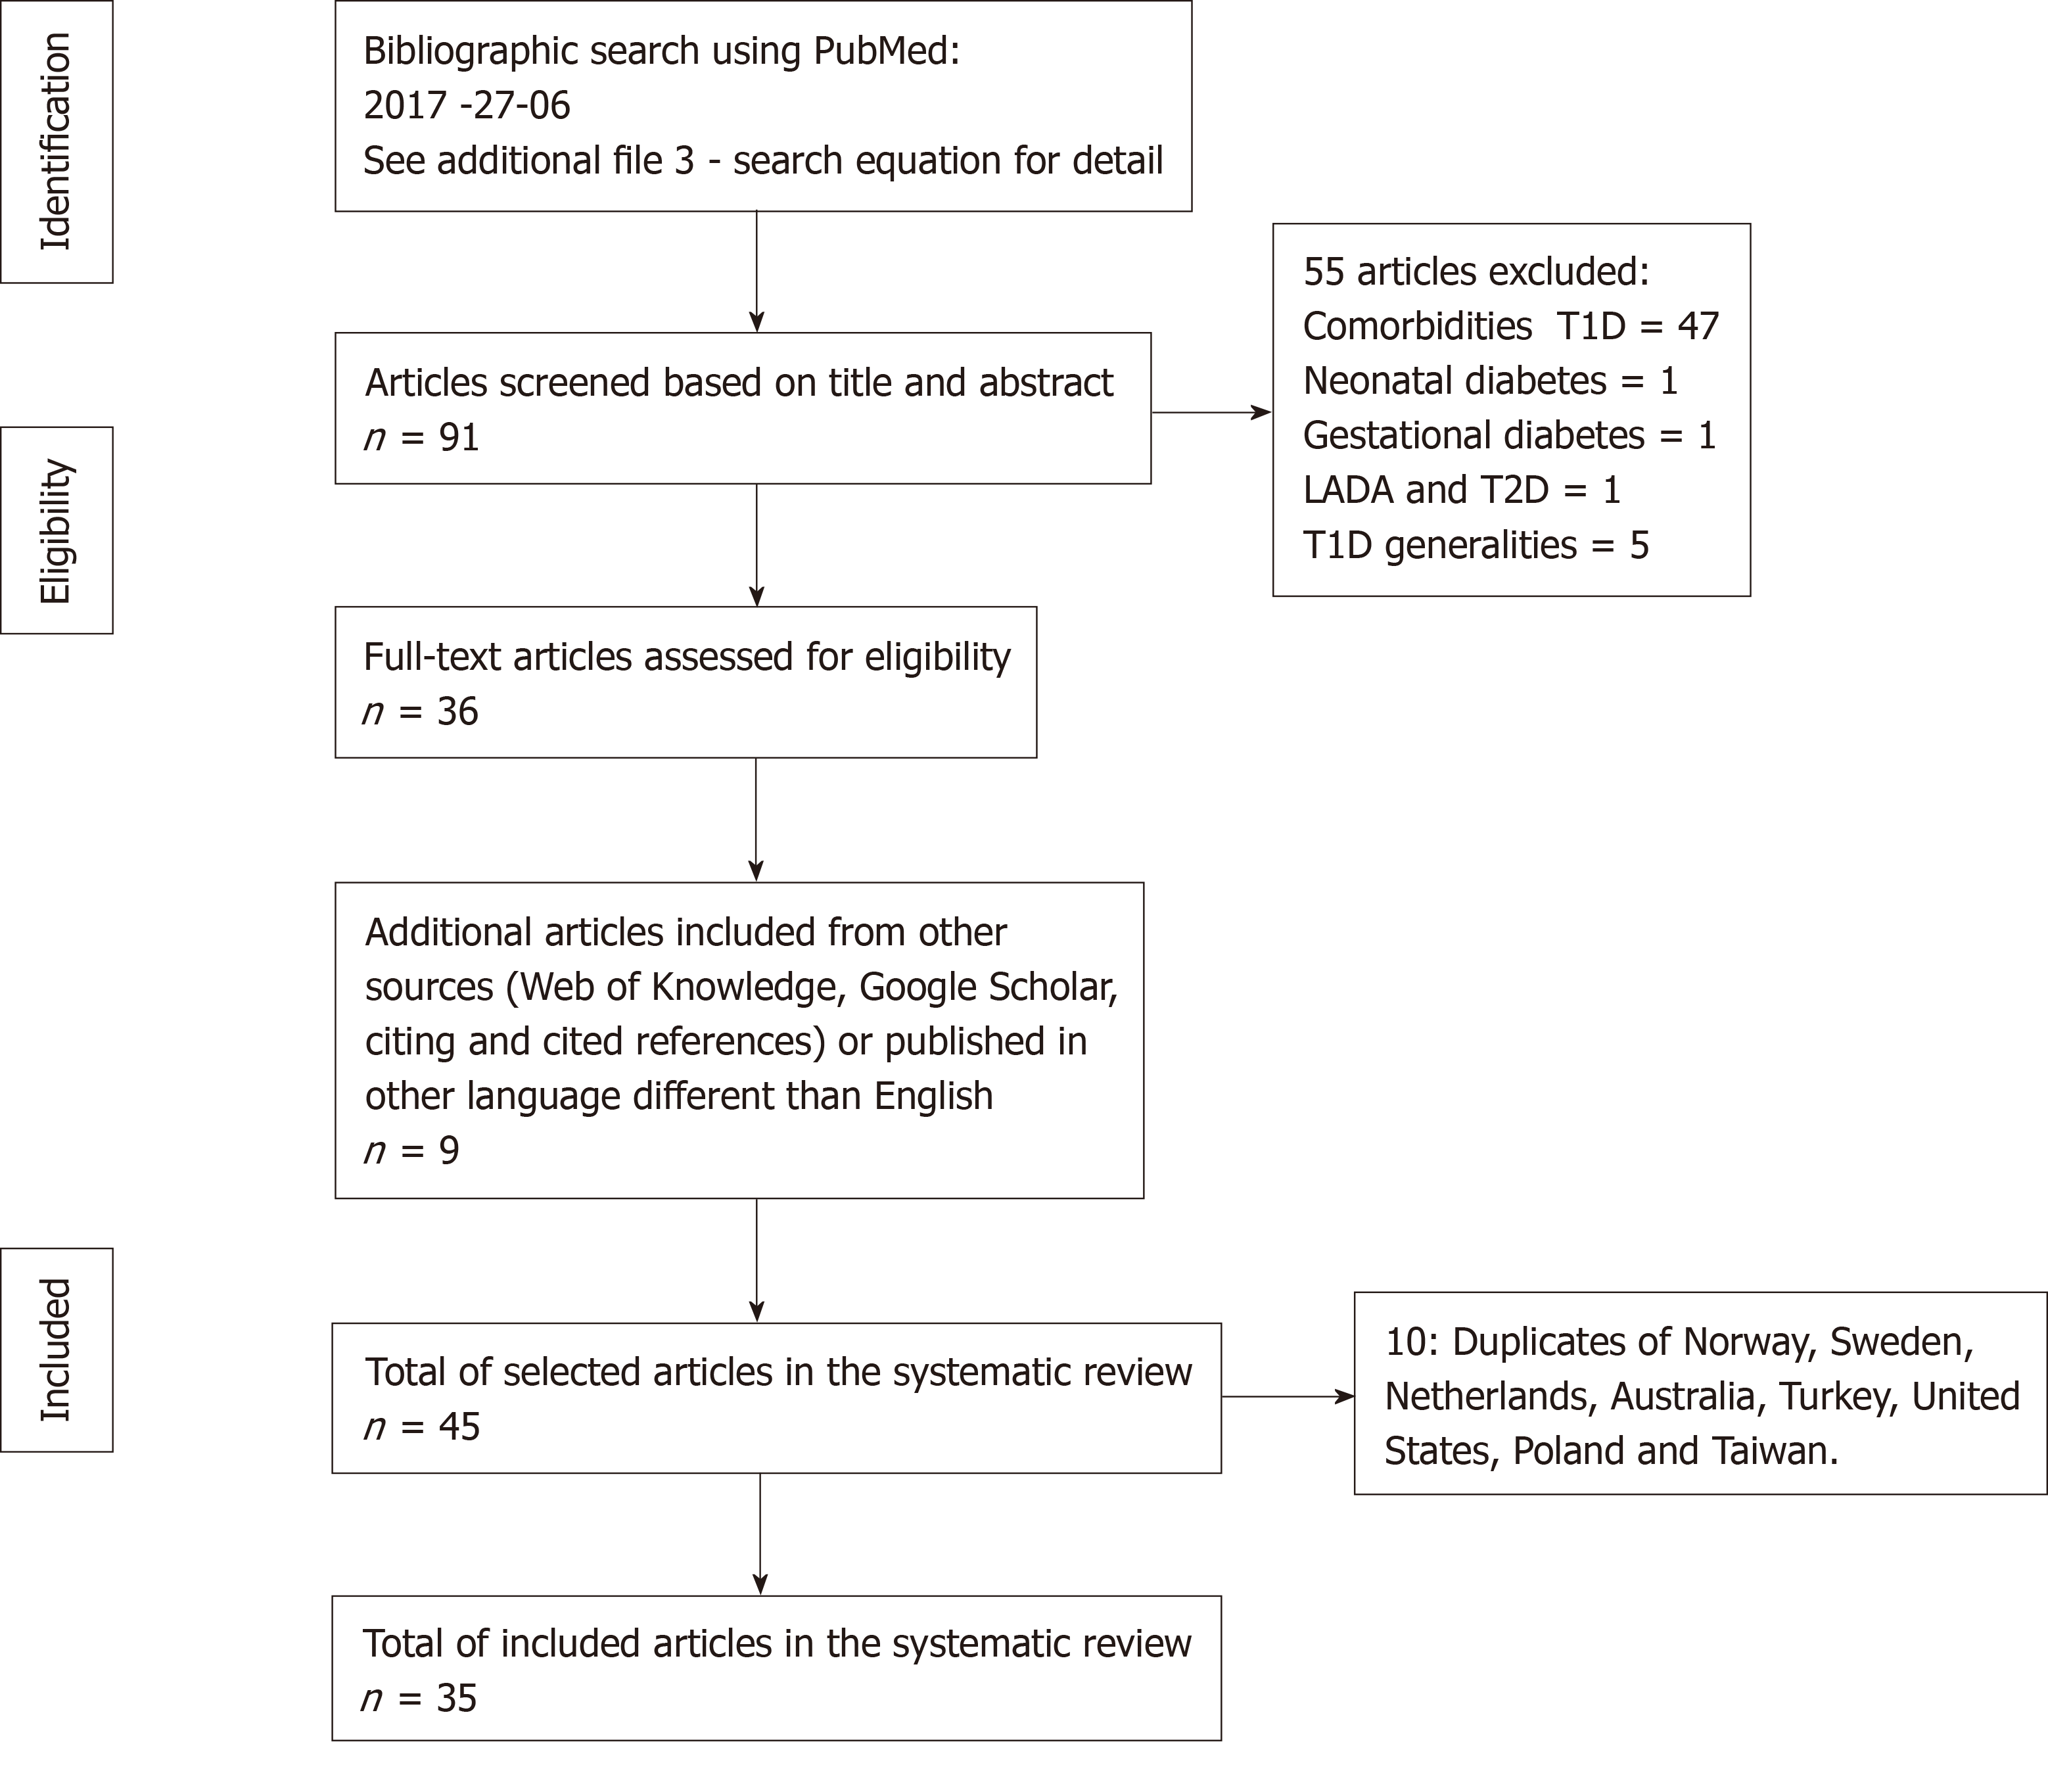
Figure 1 Flow diagram of the bibliographic search strategy.
T1D: Type 1 diabetes; T2D: Type 2 diabetes; LADA: Latent autoimmune diabetes in adults.
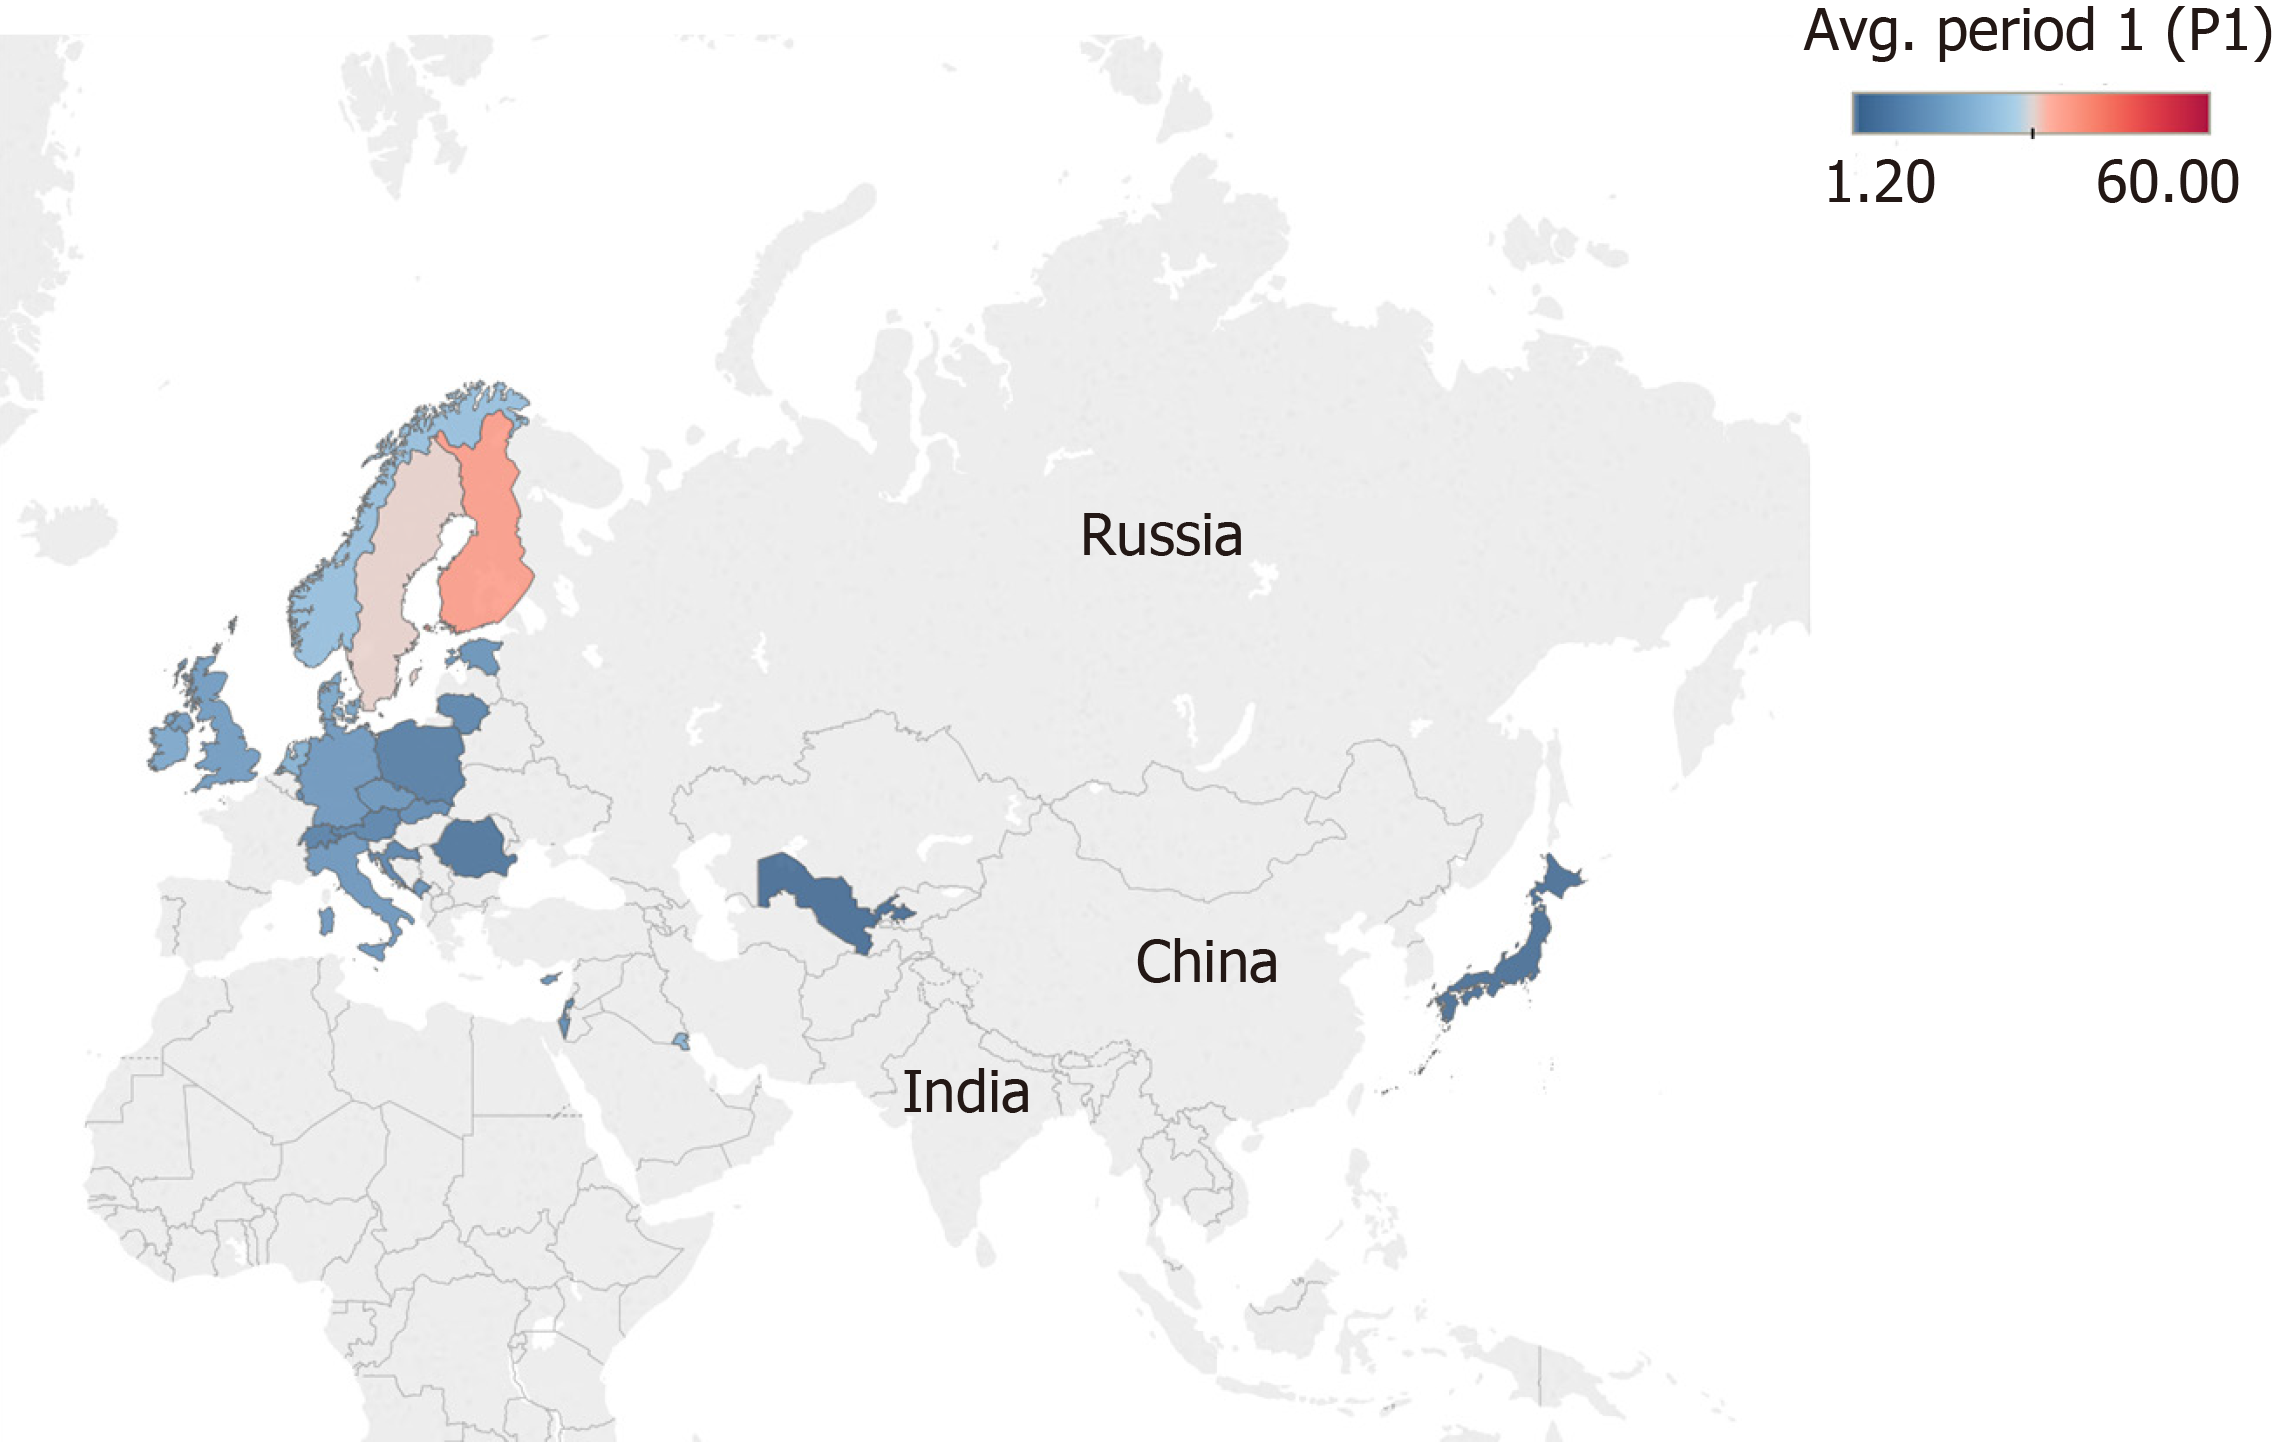
Figure 2 Map showing the mean incidence of type 1 diabetes in 26 countries from 1975-1999.
The colour scale represents the level of incidence ranging from 1.20 in blue to 60 per 100000 individuals in red aged 0-14 years.
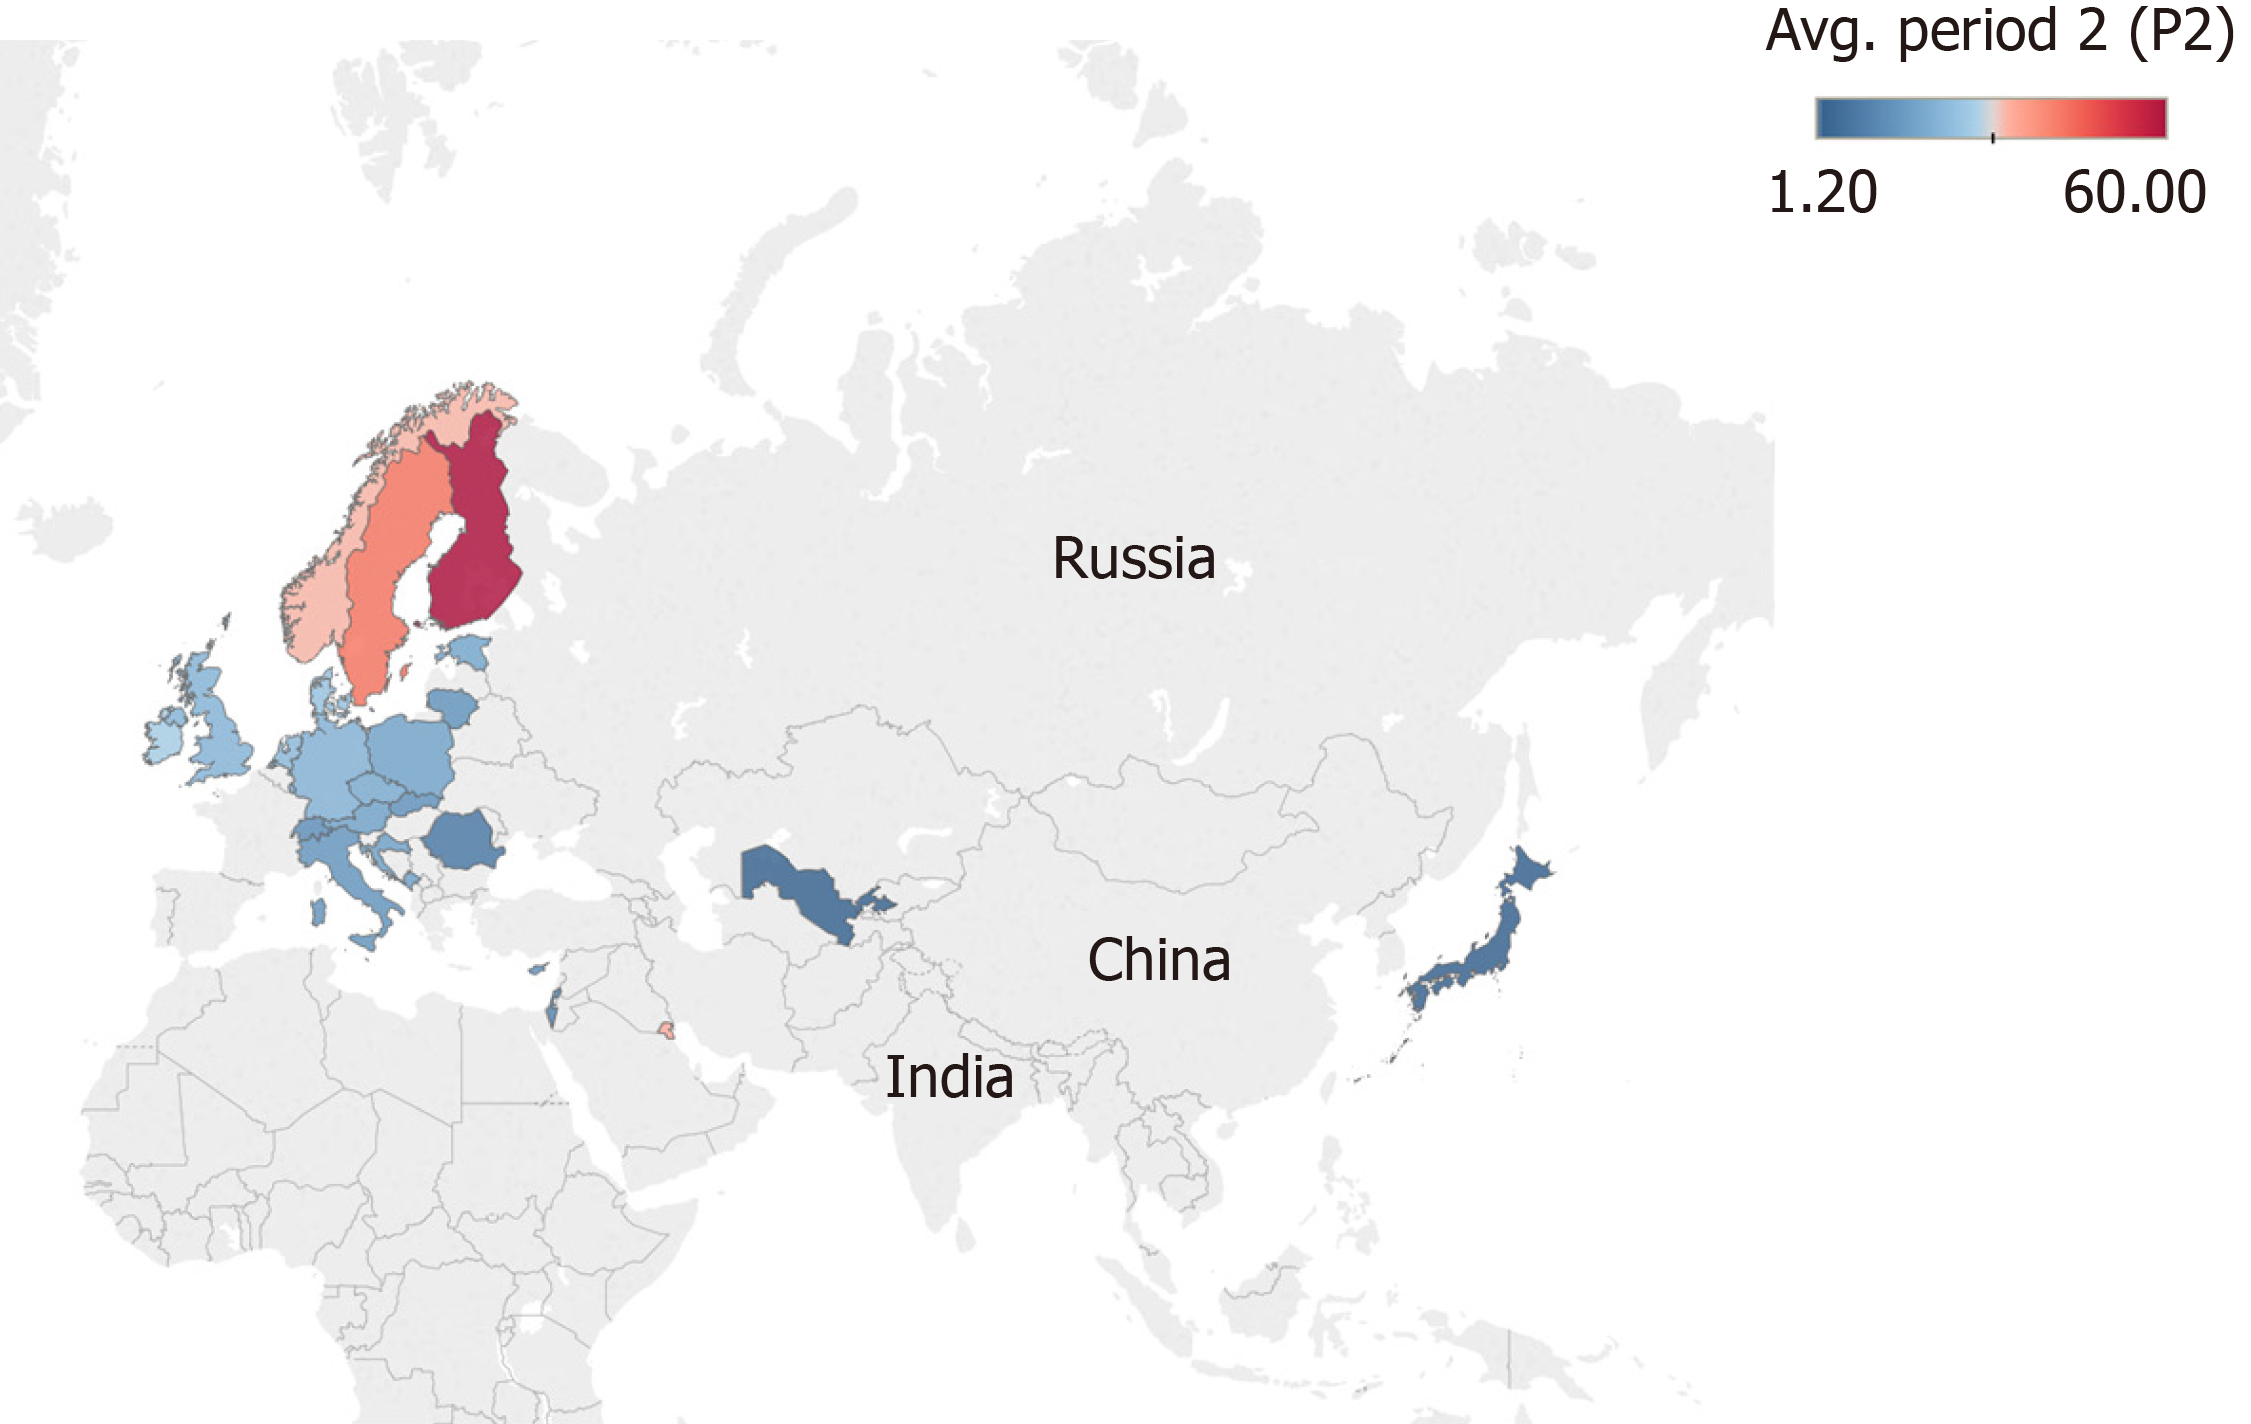
Figure 3 Map showing the mean incidence of type 1 diabetes in 26 countries from 2000-2017.
The colour scale represents the level of incidence ranging from 1.20 in blue to 60 per 100000 individuals in red aged 0-14 years.
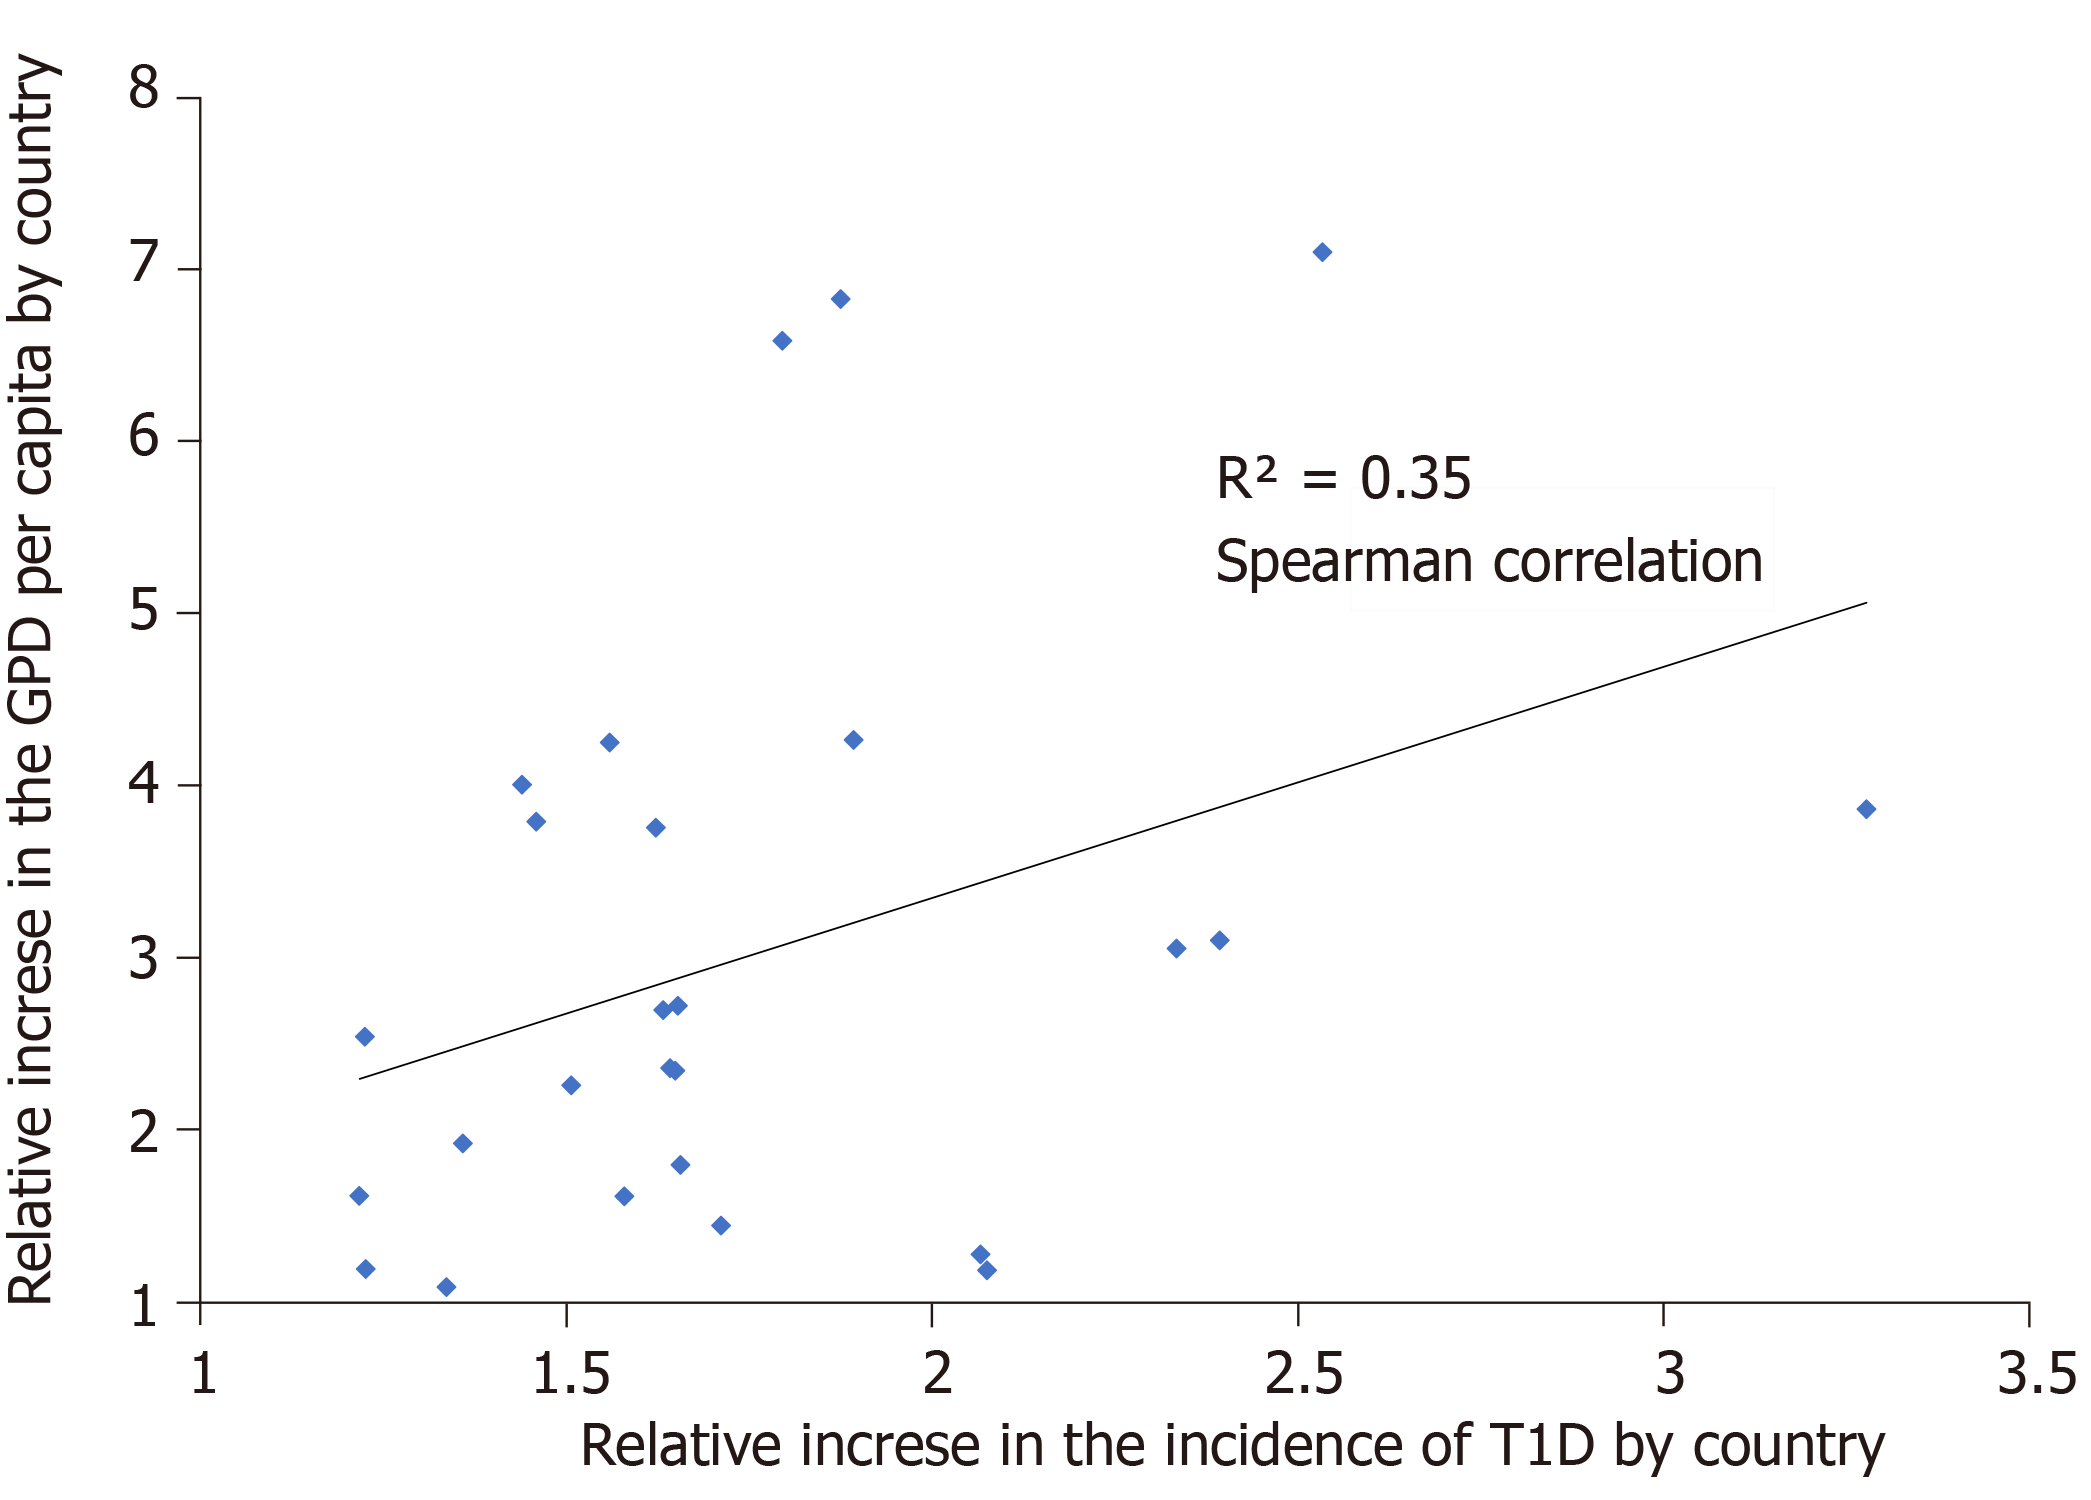
Figure 4 Observed relation between the ratios of the increase in incidence and gross domestic product in 26 countries.
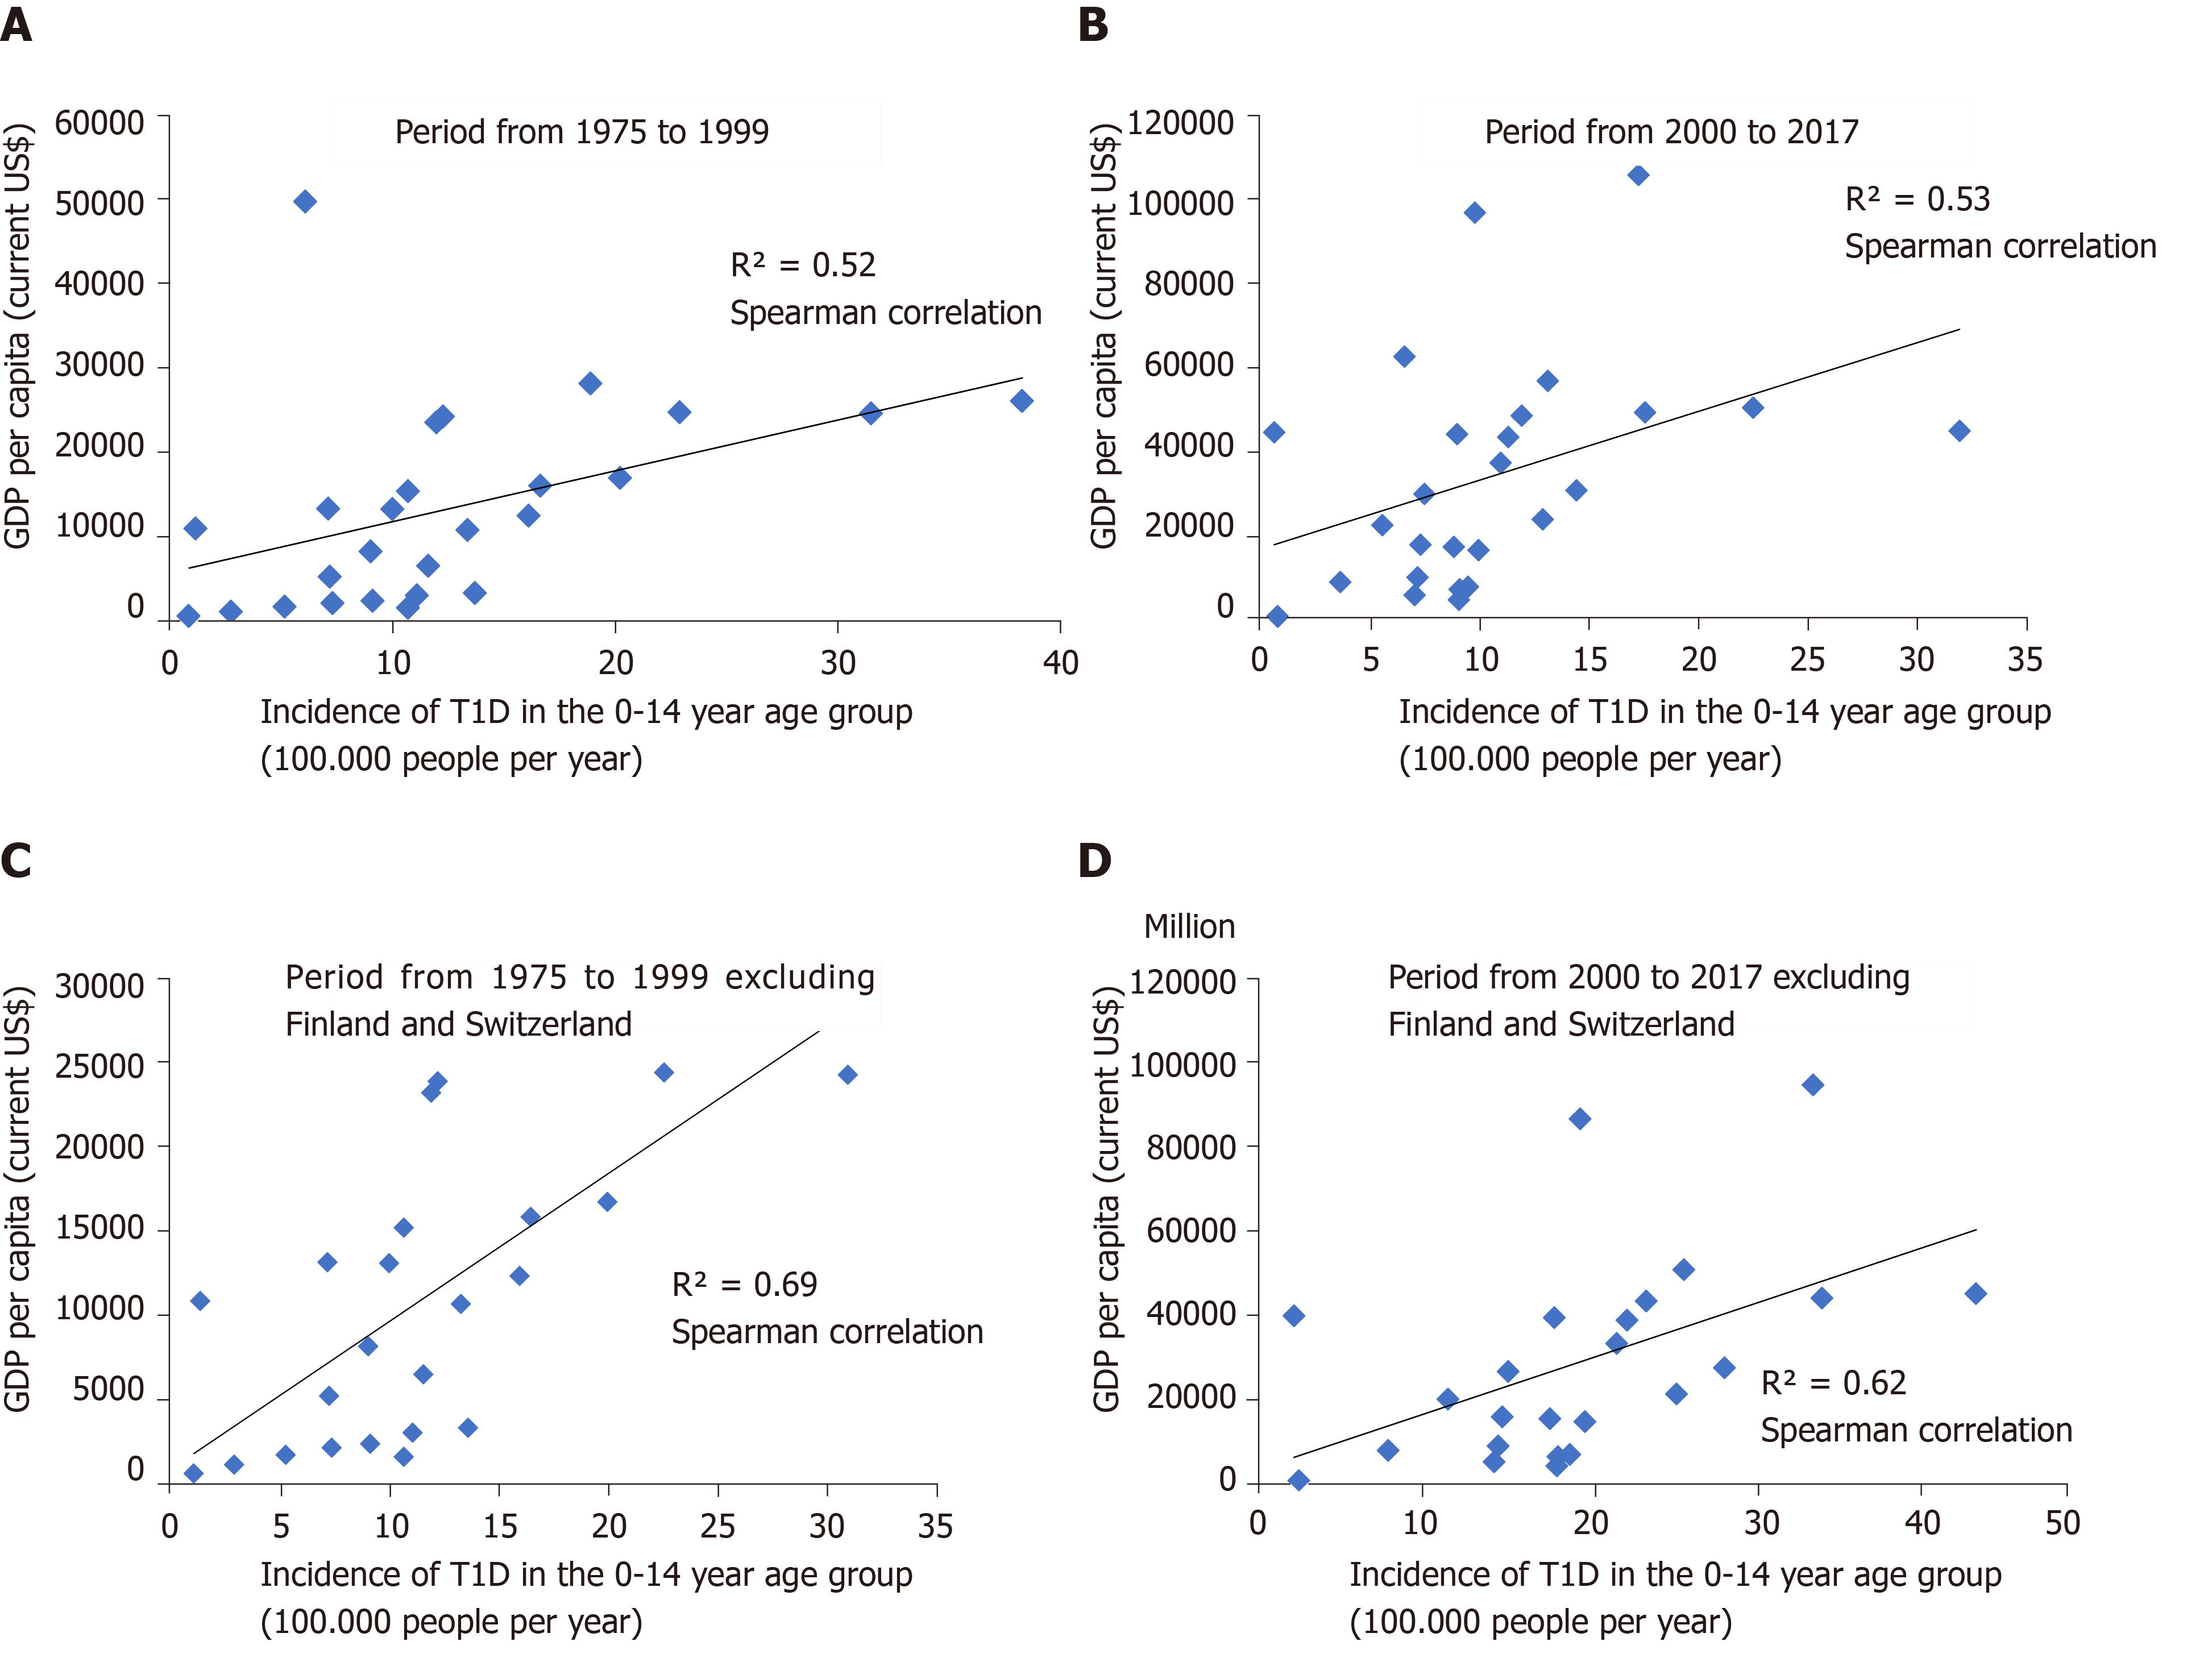
Figure 5 Correlation between incidence of type 1 diabetes and gross domestic product per capita for countries with information at the national level in two periods.
A: Analysis for 26 countries period from 1975 to 1999; B: Analysis for 26 countries, period from 2000 to 2017; C: Analysis excluding Finland and Switzerland, period from 1975 to 1999; D: Analysis excluding Finland and Switzerland, period from 2000 to 2017.
- Citation: Gomez-Lopera N, Pineda-Trujillo N, Diaz-Valencia PA. Correlating the global increase in type 1 diabetes incidence across age groups with national economic prosperity: A systematic review. World J Diabetes 2019; 10(12): 560-580
- URL: https://www.wjgnet.com/1948-9358/full/v10/i12/560.htm
- DOI: https://dx.doi.org/10.4239/wjd.v10.i12.560


