Published online Mar 15, 2024. doi: 10.4251/wjgo.v16.i3.819
Peer-review started: October 9, 2023
First decision: December 6, 2023
Revised: December 30, 2023
Accepted: January 29, 2024
Article in press: January 29, 2024
Published online: March 15, 2024
Processing time: 154 Days and 20.2 Hours
The study on predicting the differentiation grade of colorectal cancer (CRC) based on magnetic resonance imaging (MRI) has not been reported yet. Developing a non-invasive model to predict the differentiation grade of CRC is of great value.
To develop and validate machine learning-based models for predicting the differentiation grade of CRC based on T2-weighted images (T2WI).
We retrospectively collected the preoperative imaging and clinical data of 315 patients with CRC who underwent surgery from March 2018 to July 2023. Patients were randomly assigned to a training cohort (n = 220) or a validation cohort (n = 95) at a 7:3 ratio. Lesions were delineated layer by layer on high-resolution T2WI. Least absolute shrinkage and selection operator regression was applied to screen for radiomic features. Radiomics and clinical models were constructed using the multilayer perceptron (MLP) algorithm. These radiomic features and clinically relevant variables (selected based on a significance level of P < 0.05 in the training set) were used to construct radiomics-clinical models. The performance of the three models (clinical, radiomic, and radiomic-clinical model) were evaluated using the area under the curve (AUC), calibration curve and decision curve analysis (DCA).
After feature selection, eight radiomic features were retained from the initial 1781 features to construct the radiomic model. Eight different classifiers, including logistic regression, support vector machine, k-nearest neighbours, random forest, extreme trees, extreme gradient boosting, light gradient boosting machine, and MLP, were used to construct the model, with MLP demonstrating the best diagnostic performance. The AUC of the radiomic-clinical model was 0.862 (95%CI: 0.796-0.927) in the training cohort and 0.761 (95%CI: 0.635-0.887) in the validation cohort. The AUC for the radiomic model was 0.796 (95%CI: 0.723-0.869) in the training cohort and 0.735 (95%CI: 0.604-0.866) in the validation cohort. The clinical model achieved an AUC of 0.751 (95%CI: 0.661-0.842) in the training cohort and 0.676 (95%CI: 0.525-0.827) in the validation cohort. All three models demonstrated good accuracy. In the training cohort, the AUC of the radiomic-clinical model was significantly greater than that of the clinical model (P = 0.005) and the radiomic model (P = 0.016). DCA confirmed the clinical practicality of incorporating radiomic features into the diagnostic process.
In this study, we successfully developed and validated a T2WI-based machine learning model as an auxiliary tool for the preoperative differentiation between well/moderately and poorly differentiated CRC. This novel approach may assist clinicians in personalizing treatment strategies for patients and improving treatment efficacy.
Core Tip: In this study, a T2-weighted imaging-based radiomic-clinical machine learning model was developed to preoperatively predict the histological grade of colorectal cancer (CRC). The model showed good performance in both the training and validation cohorts. It provides an effective tool for accurately assessing the differentiation grade of CRC tissue before surgery, which is highly important for selecting the best treatment plan and predicting patient prognosis.
- Citation: Zheng HD, Huang QY, Huang QM, Ke XT, Ye K, Lin S, Xu JH. T2-weighted imaging-based radiomic-clinical machine learning model for predicting the differentiation of colorectal adenocarcinoma. World J Gastrointest Oncol 2024; 16(3): 819-832
- URL: https://www.wjgnet.com/1948-5204/full/v16/i3/819.htm
- DOI: https://dx.doi.org/10.4251/wjgo.v16.i3.819
Colorectal cancer (CRC) is the third most common malignant tumour in the world and the second leading cause of cancer-related deaths[1]. The global burden of CRC continues to surge due to its escalating incidence rate[2]. It is now understood that colorectal adenocarcinoma originating from epithelial cells accounts for more than 90% of CRC cases[3], and its histological grade is closely related to the prognosis in this patient population[4]. There is an increasing consensus suggesting that differentiation grade is an important prognostic factor[5-7]. According to the World Health Organization criteria, adenocarcinoma can be classified as well differentiated, moderately differentiated, or poorly differentiated based on the differentiation grade/formation of glands in tissue sections[8]. Accordingly, tumours with a glandular formation ratio less than 50% can be classified as high-grade (poorly differentiated), while tumours with a glandular formation ratio greater than 50% are classified as low-grade (well-differentiated or moderately differentiated)[4]. Although poorly differentiated adenocarcinoma accounts for only 4.8% to 23.2% of colorectal adenocarcinomas, it is associated with a high risk of metastasis and poor prognosis[9,10]. Currently, surgery remains the mainstay of curative treatment for CRC[11]. Related studies have shown differences in the biological behaviour and chemotherapeutic sensitivity of digestive tract tumours with different differentiation grade[12]. Huang et al[13] suggested that in locally advanced nonmucinous rectal cancer patients, poorly differentiated cancer patients who received neoadjuvant radiotherapy and chemotherapy experienced poorer responses to neoadjuvant chemotherapy and poorer prognoses than patients with moderately differentiated or well-differentiated cancer. Accurately assessing the differentiation grade of colorectal adenocarcinoma tissue before surgery is important for selecting the optimal treatment plan and predicting patient prognosis. In clinical practice, most patients are diagnosed with CRC according to their histological grade through preoperative endoscopic biopsy. However, due to intratumoral heterogeneity and limited tissue sample sizes, some patients may not receive an accurate histological grade or may even have a grade inconsistent with postoperative pathology, presenting substantial challenges for personalized medicine and biomarker development[14].
Compared with invasive procedures, noninvasive preoperative imaging data can accurately predict lymph node metastasis, histological grade, and neoadjuvant therapy efficacy[15-17]. In recent years, there has been an increasing consensus on the advantages of magnetic resonance imaging (MRI) for diagnosing and treating CRC patients; MRI has been established as the most important imaging technology for rectal cancer, and T2-weighted imaging (T2WI) is the core sequence of MRI scanning protocols[18]. Nevertheless, during clinical practice, accurate prediction of the histological grade of CRC through visual MRI assessment has not been performed. In the past few years, there has been burgeoning interest in radiomics, which involves extracting high-throughput quantitative features from medical images and analyzing and further decoding tumour heterogeneity, making it possible to predict tumour histological grade noninvasively before surgery[19].
This study was designed to explore whether T2WI tumour radiomic analysis could be used to accurately develop and validate machine learning models to predict the differentiation grade of CRC, thereby providing practical tools for developing personalized treatment strategies.
This study retrospectively included 315 CRC patients who underwent enhanced MRI and surgical treatment between March 2018 and July 2023. All patients underwent enhanced MRI scans within two weeks before surgery. The inclusion criteria were as follows: (1) Patients diagnosed with either high-grade (poorly differentiated) or low-grade (well-differentiated and moderately differentiated) colorectal adenocarcinoma based on postoperative pathology; (2) patients with a tumour lesion that is observable on MRI; and (3) patients who underwent surgical treatment for CRC. The exclusion criteria were as follows: (1) Received preoperative radiotherapy and chemotherapy; and (2) poor MRI image quality. Ethical approval for this study was obtained from the Ethics Committee of The Second Affiliated Hospital of Fujian Medical University.
The included study subjects were assigned to two groups at a 7:3 ratio: the training group (n = 220) and the validation group (n = 95). Moreover, the clinical features collected in this study included age, sex, carcinoembryonic antigen (CEA), carbohydrate antigen 199, differentiation grade, tumour occupying the circumference of the bowel, tumour location (right: ascending and transverse colon, left: descending colon, sigmoid colon, and rectum), CRC T stage, CRC N stage, neural invasion, and vascular invasion. The differentiation grade was selected as the primary outcome of our study.
All patients were examined with a Philips 3.0T MRI system (Achieva, Philips Healthcare, Best, the Netherlands) using a body coil. Patients fasted for 4-6 h before examination. The patients were placed in the supine position. The cross-sectional T2WI parameters were as follows: TR/TE = 4000/80 MS, FOV = 180 mm × 180 mm, number of excitations = 2-4, layer spacing = 2 mm, and layer thickness = 3.0 mm.
For clinical features, we utilized independent sample t tests for normally distributed data, Mann-Whitney U tests for nonnormally distributed data, and Chi-square tests for counting data to compare the clinical features among patients.
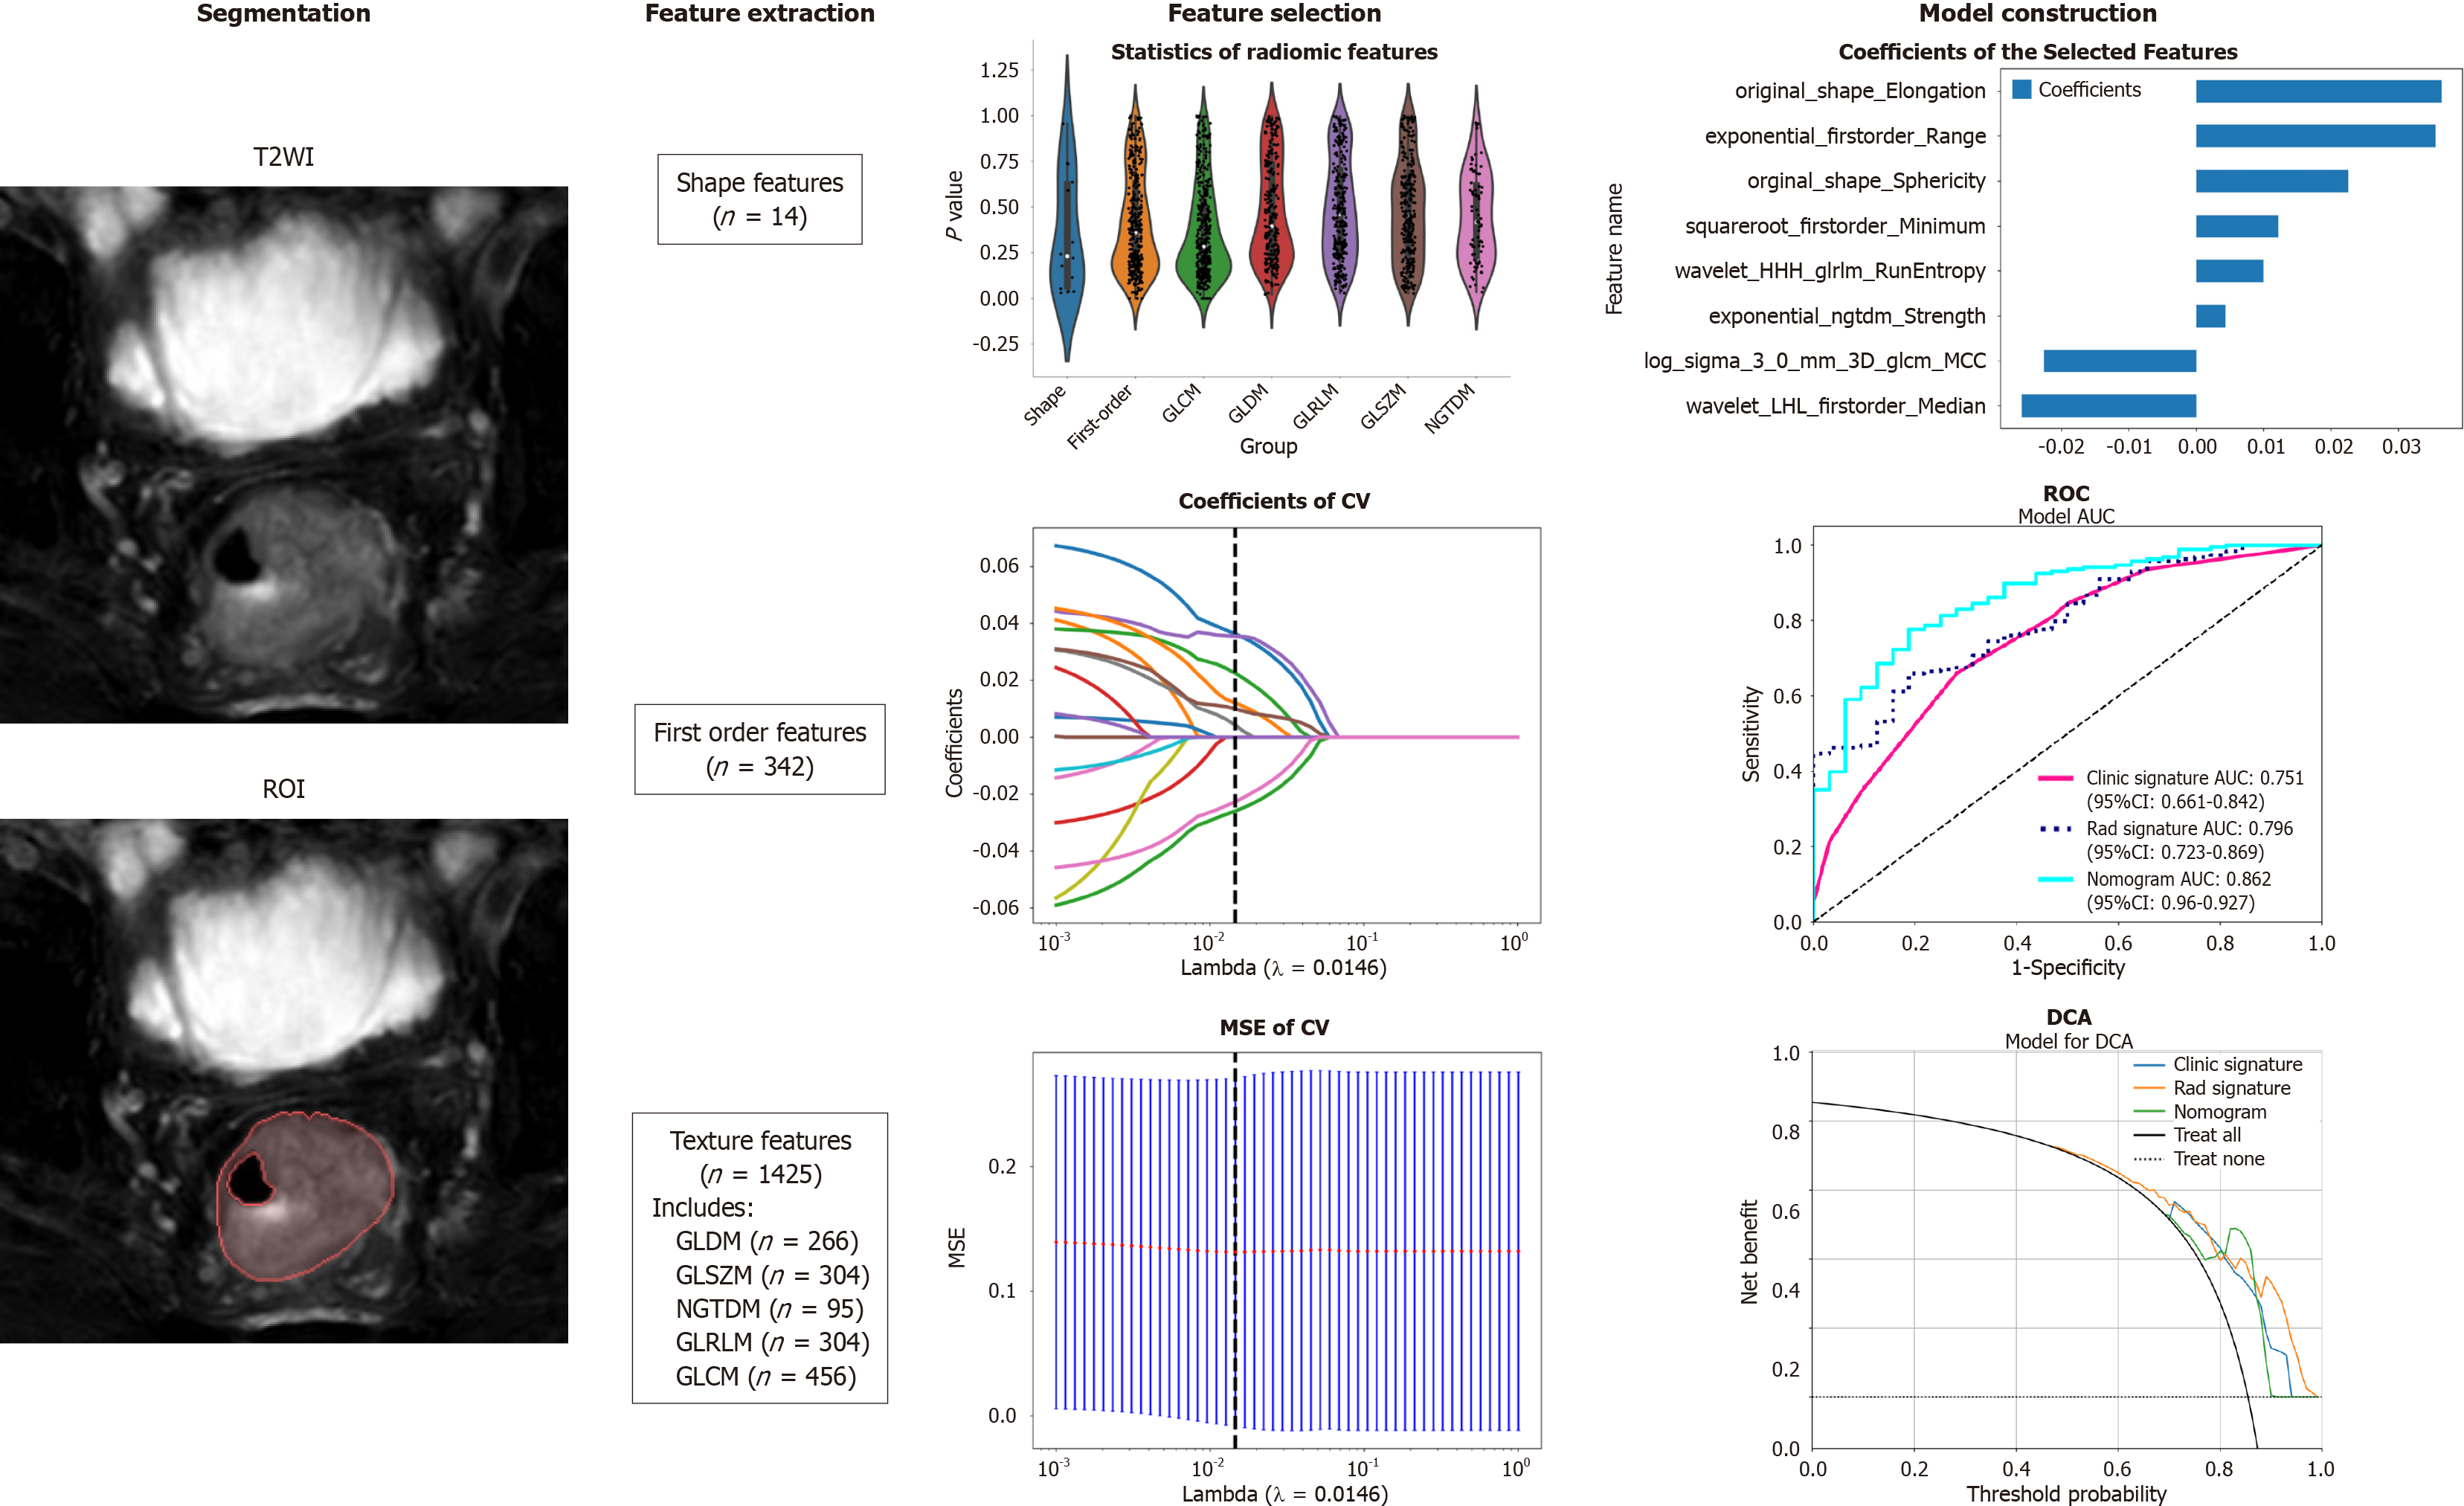
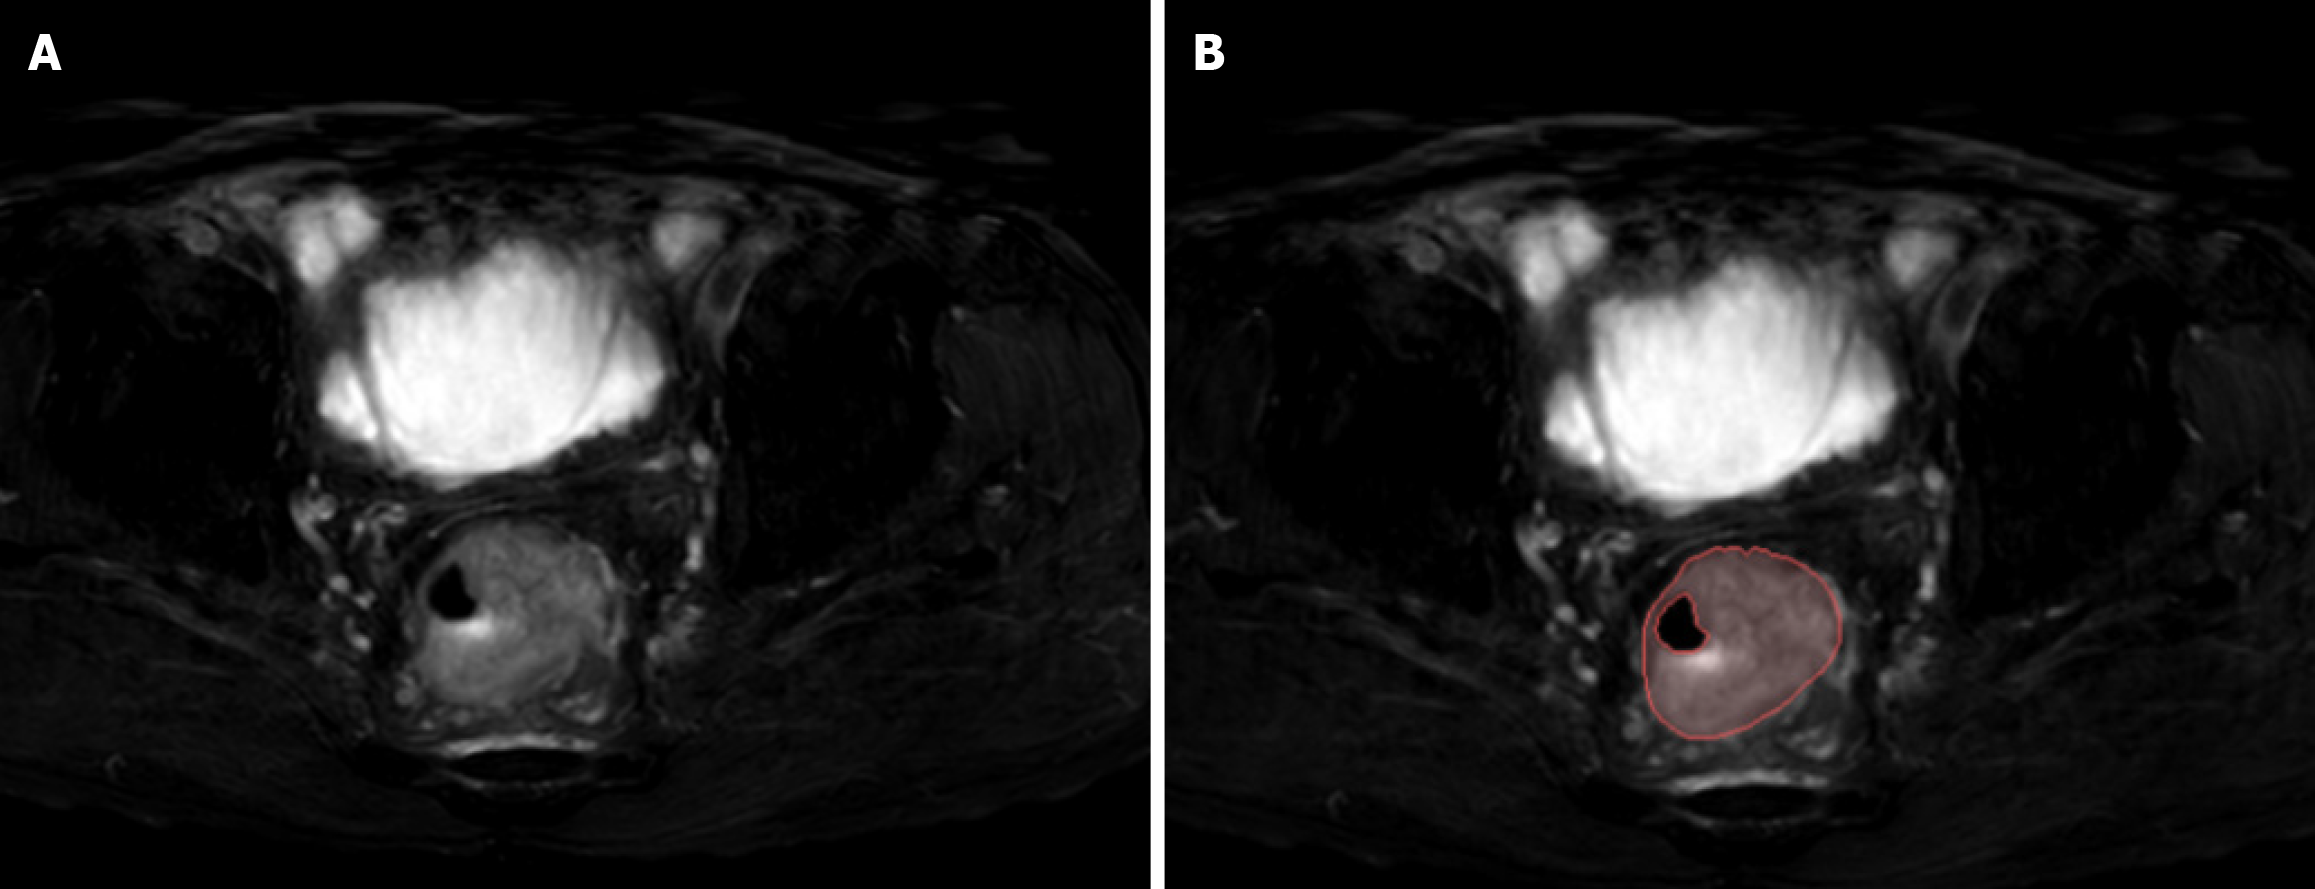
The workflow of T2WI-based radiomic analysis included lesion segmentation, feature extraction, feature selection, and model construction (as illustrated in Figure 1). MRI images of patients were downloaded in DICOM format and imported into the Darwin research platform (https://arxiv.org/abs/2009.00908). Tumour contours were manually delineated slice by slice on T2WI to define the regions of interest (ROI). A radiologist with five years of experience meticulously marked the ROI boundaries, which were subsequently reviewed and refined by abdominal radiology experts with 20 years of experience. Figure 2A shows an example of a primary CRC lesion on a specific level of a T2WI oblique axis image, while Figure 2B shows the manual delineation of CRC lesions on this level using image processing software. The participating doctors were blinded to the pathological findings. In cases of disagreement regarding the outlined results, they engaged in discussions to reach a consensus.
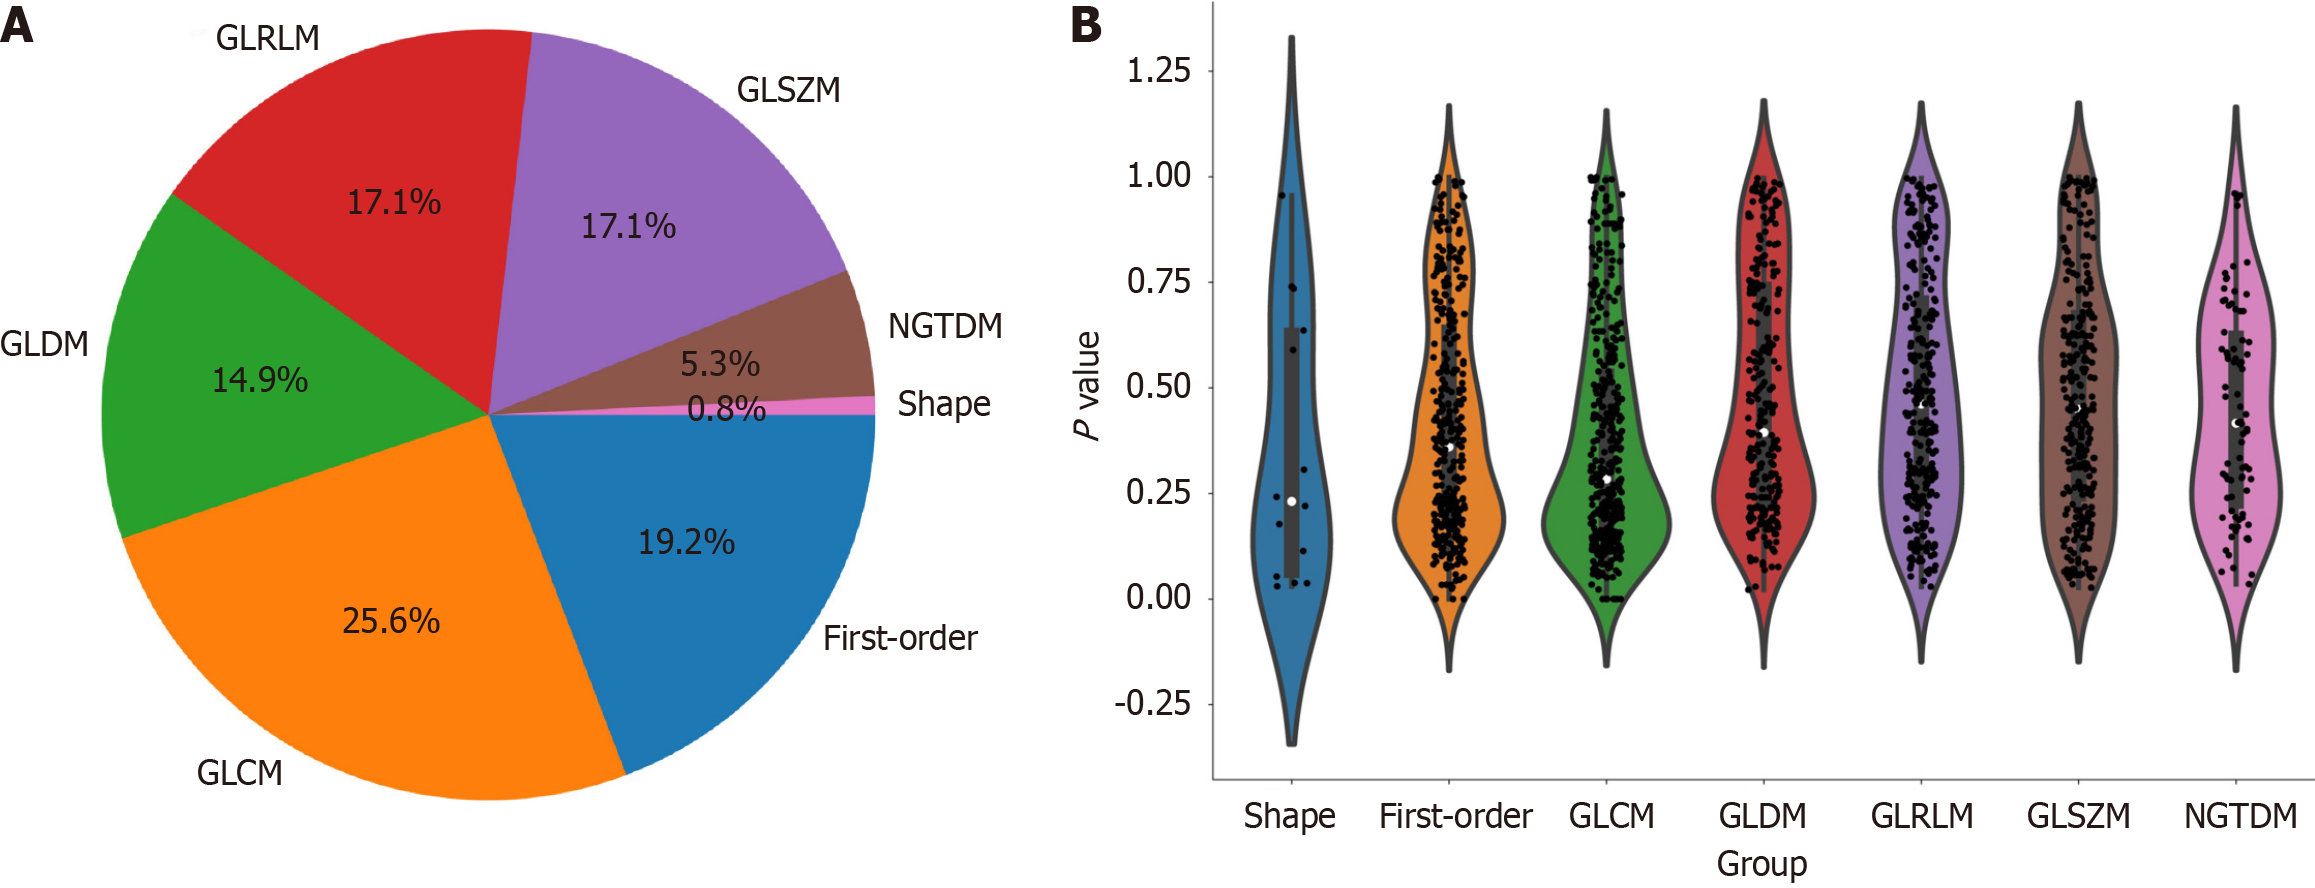
Upon completion of lesion segmentation, a comprehensive set of 1781 features were extracted from each ROI using an in-house feature analysis program implemented in PyRadiomics (http://PyRadiomics.readthedocs.io). Figure 3A shows the proportion of each feature category, while Figure 3B shows all the features and their corresponding P values. These features were classified into three groups: (1) Shape features; (2) first-order features; and (3) texture features. Geometric features were used to describe the three-dimensional shape characteristics of the tumours. Intensity features characterize the first-order statistical distribution of voxel intensity within tumours. Texture features were used to describe patterns or second-order and higher-order spatial distributions of intensity. The texture features included methods such as a grayscale co-occurrence matrix (GLCM), a grayscale run length matrix (GLRLM), a grayscale size region matrix (GLSZM), a neighbourhood grayscale difference matrix (NGTDM), and a grayscale dependency matrix (GLDM).
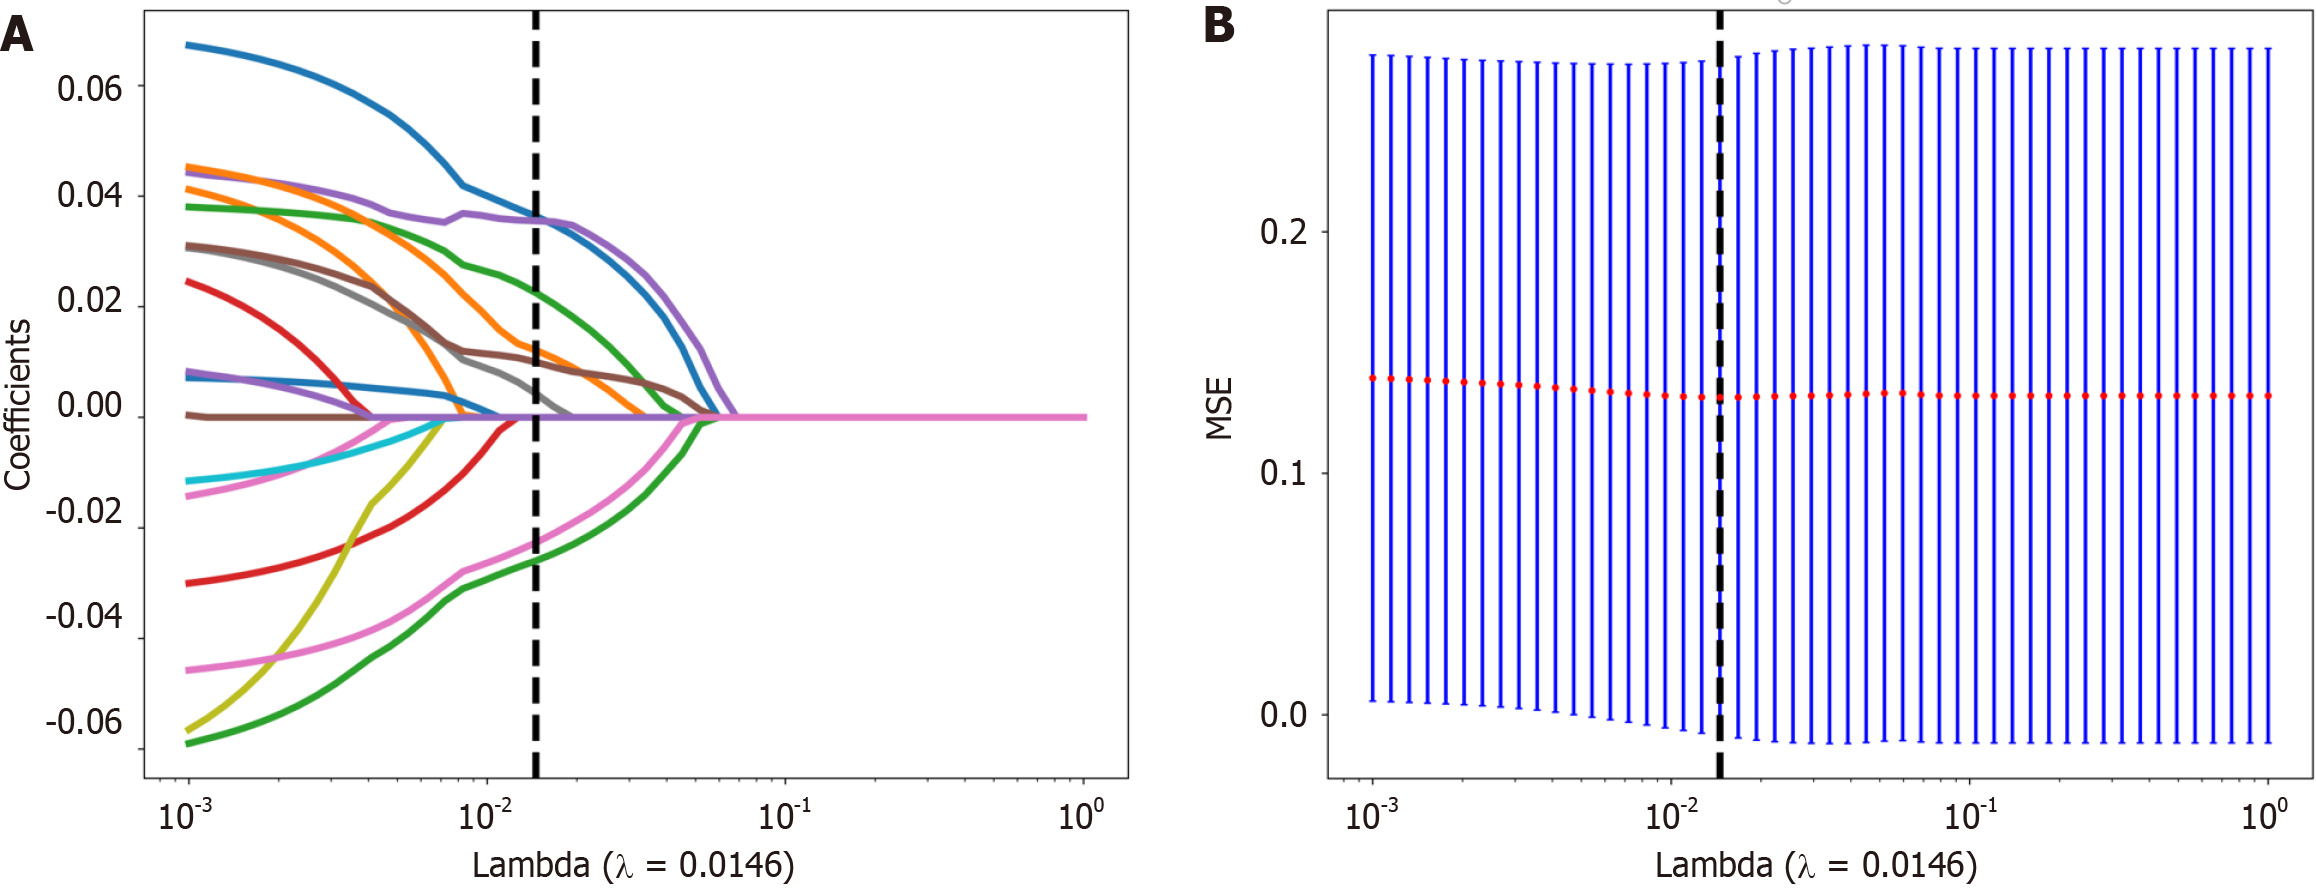
First, the dataset was Z score normalized. We subsequently conducted Mann-Whitney U test-based statistical testing and feature screening on all the radiological features. Only features with P < 0.05 were retained. For radiological features with high repeatability, the Spearman rank correlation coefficient was used to calculate the correlation between features, and features with a correlation coefficient greater than 0.9 between any two features were retained. The greedy recursive deletion strategy for feature filtering was used to maximize the retention of descriptive features, with 32 features ultimately being retaining. We applied the least absolute shrinkage and selection operator (LASSO) algorithm to identify the most informative radiomic features closely related to the differentiation grade. Using a minimum standard of 10-fold cross-validation, we retained nonzero coefficient features for regression model fitting and the formation of radiomic features. Subsequently, each patient's radiomics score (Rad-score) was obtained by using machine learning algorithm. Python scikit-learn was used for LASSO regression modelling.
After the final features were obtained by LASSO regression, they were incorporated to build the model using machine learning with the following methods: Logistic regression (LR), support vector machine (SVM), k-nearest neighbour (KNN), random forest (RF), extra trees (ET), extreme gradient boosting (XGBoost), light gradient boosting machine (LightGBM), multilayer perceptron (MLP). Fivefold cross-validation was employed to obtain the final Radiomics signature.
The approach used to establish the clinical signatures was similar to that used to establish the radiomic signatures. We initially selected features with P < 0.05 through baseline statistics. The same machine learning model was used during the clinical model construction process. Fivefold cross-validation was also applied, and a validation cohort was established.
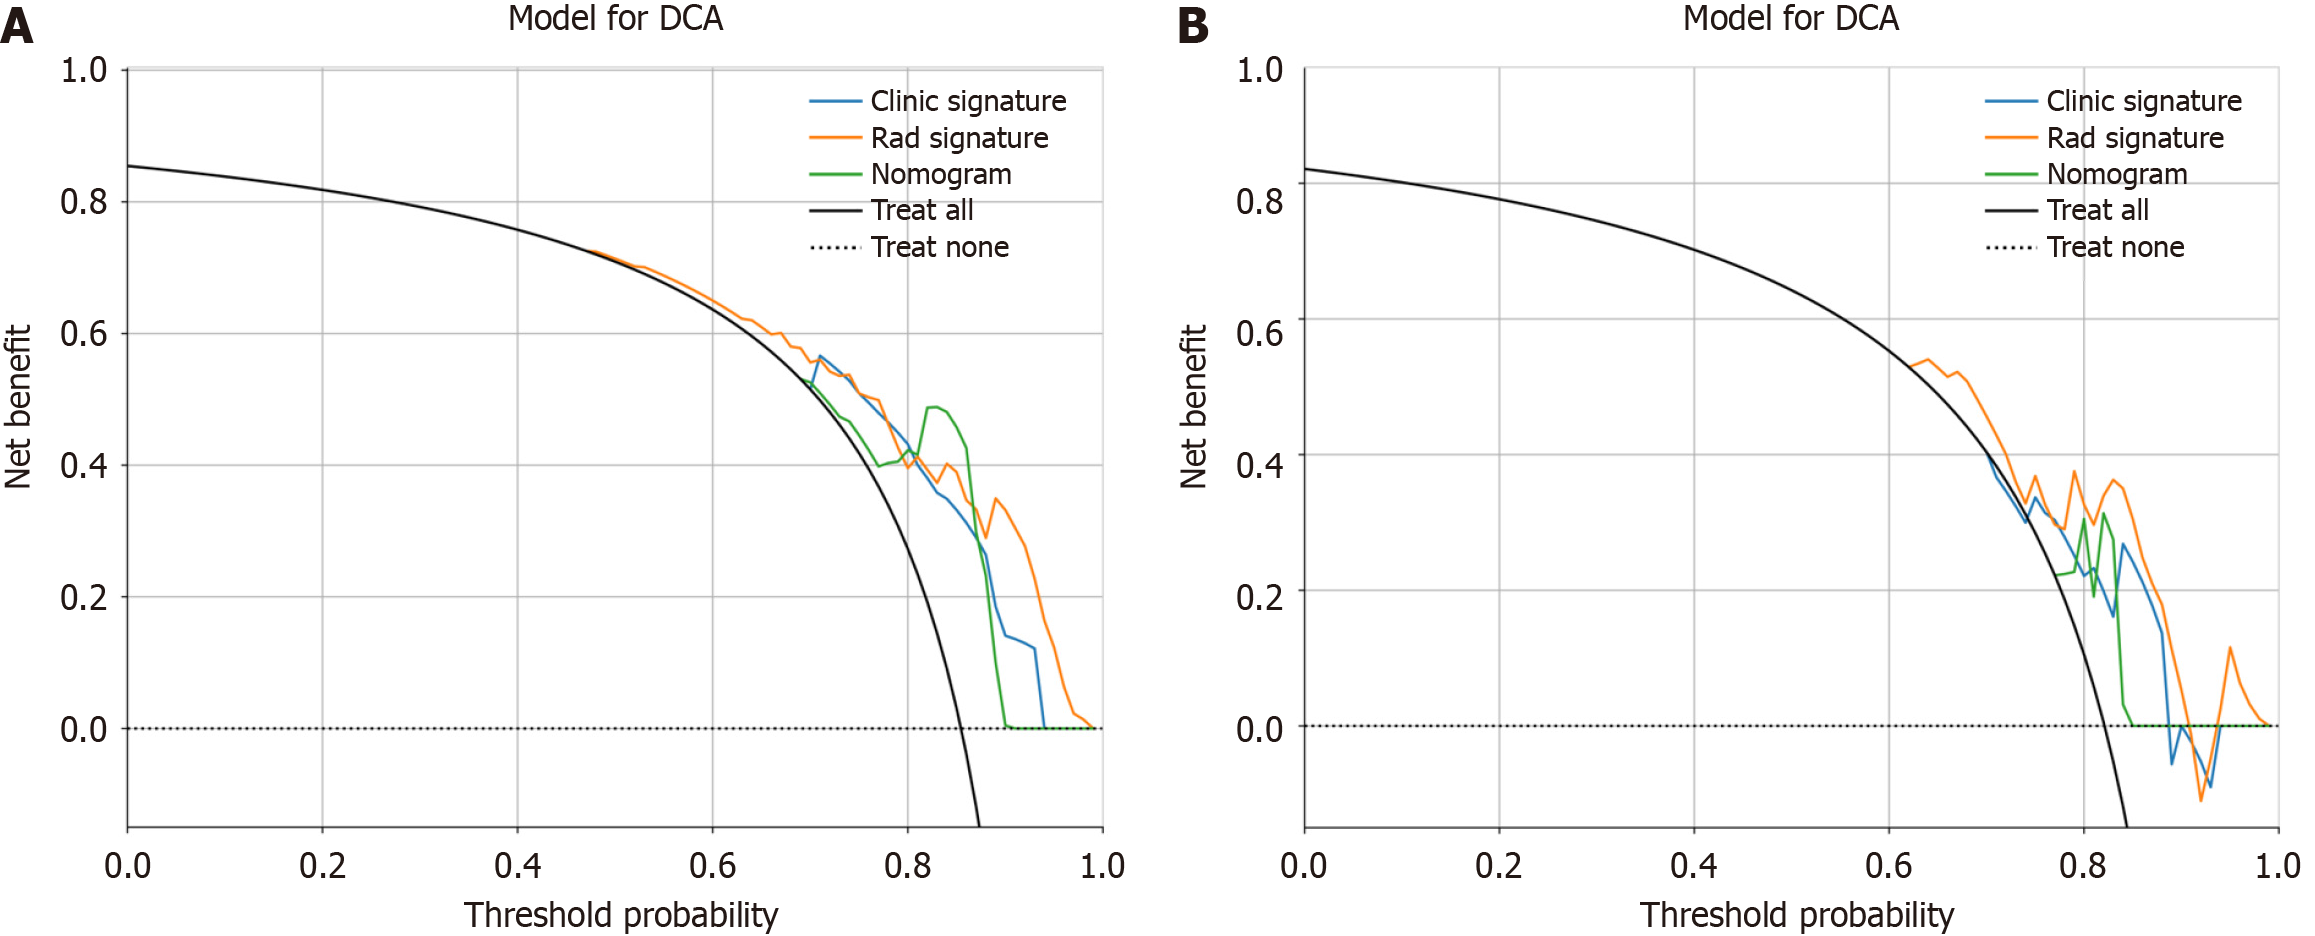
The enumeration data were analyzed using the Chi-square test, independent sample t tests were used for normally distributed continuous variables, and Mann-Whitney U tests were employed for nonnormally distributed data. A clinical-radiomics nomogram was established by combining radiomics and clinical features. Model performance was assessed by quantifying the area under the curve (AUC) of the receiver operating characteristic (ROC) curve. Calibration curves were generated to evaluate the calibration effect of the models, and the Hosmer-Lemeshow test was employed for fitting analysis to assess the calibration of the models. Additionally, decision curve analysis (DCA) was applied to evaluate the clinical practicality of the model.
A total of 315 study subjects were included, comprising 266 patients with well/moderately differentiated CRC and 49 patients with poorly differentiated CRC. The training cohort comprised 220 CRC patients, including 32 with poorly differentiated disease and 188 with well/moderately differentiated disease. The validation cohort included 95 CRC patients, including 17 with poorly differentiated disease and 78 with moderately/well differentiated disease. The clinical characteristics of the patients in the training and validation cohorts are summarized in Table 1. As shown in Table 1, significant differences between the poorly differentiated group and the well/moderately differentiated group were observed in the training cohort in terms of neural invasion, vascular invasion, extent of tumour involvement in bowel circumference, and N staging. No significant differences were found in the other variables. There were no significant differences in clinical features except for N stage in the validation cohort.
| Variable | Training cohort | P value | Validation cohort | P value | ||
| Poor | Well/moderate | Poor | Well/moderate | |||
| Age (yr) | 59.41 ± 11.26 | 63.38 ± 11.07 | 0.072 | 58.12 ± 9.63 | 61.95 ± 11.79 | 0.148 |
| CEA (ng/mL) | 16.65 ± 30.56 | 20.94 ± 61.37 | 0.319 | 24.13 ± 51.84 | 20.94 ± 75.57 | 0.446 |
| CA199 (U/mL) | 55.95 ± 101.64 | 41.13 ± 115.48 | 0.174 | 28.74 ± 36.85 | 26.32 ± 58.41 | 0.349 |
| Size (cm) | 4.26 ± 1.90 | 4.65 ± 1.59 | 0.252 | 4.24 ± 2.23 | 4.88 ± 1.85 | 0.067 |
| Gender | 0.963 | 0.777 | ||||
| Male | 18 (56.25) | 110 (58.51) | 9 (52.94) | 47 (60.26) | ||
| Female | 14 (43.75) | 78 (41.49) | 8 (47.06) | 31 (39.74) | ||
| Location | 0.24 | 0.947 | ||||
| Left | 11 (34.38) | 43 (22.87) | 4 (23.53) | 15 (19.23) | ||
| Right | 21 (65.62) | 145 (77.13) | 13 (76.47) | 63 (80.77) | ||
| T stage | 0.496 | 0.343 | ||||
| T1 | Null | 4 (2.13) | Null | 2 (2.56) | ||
| T2 | 4 (12.50) | 22 (11.70) | 1 (5.88) | 8 (10.26) | ||
| T3 | 22 (68.75) | 142 (75.53) | 11 (64.71) | 58 (74.36) | ||
| T4 | 6 (18.75) | 20 (10.64) | 5 (29.41) | 10 (12.82) | ||
| N stage | < 0.001 | 0.047 | ||||
| N0 | 9 (28.12) | 96 (51.06) | 6 (35.29) | 43 (55.13) | ||
| N1 | 6 (18.75) | 56 (29.79) | 5 (29.41) | 26 (33.33) | ||
| N2 | 17 (53.12) | 36 (19.15) | 6 (35.29) | 9 (11.54) | ||
| Circumference | 0.021 | 0.702 | ||||
| ≤ 1/2 | 6 (18.75) | 79 (42.02) | 8 (47.06) | 30 (38.46) | ||
| > 1/2 | 26 (81.25) | 109 (57.98) | 9 (52.94) | 48 (61.54) | ||
| Neural invasion | 0.033 | 0.81 | ||||
| Absent | 12 (37.50) | 112 (59.57) | 8 (47.06) | 42 (53.85) | ||
| Present | 20 (62.50) | 76 (40.43) | 9 (52.94) | 36 (46.15) | ||
| Vascular invasion | 0.014 | 0.177 | ||||
| Absent | 11 (34.38) | 112 (59.57) | 8 (47.06) | 53 (67.95) | ||
| Present | 21 (65.62) | 76 (40.43) | 9 (52.94) | 25 (32.05) | ||
In this study, the extracted features included 14 shape features, 342 first-order features, and 1425 texture features. There are five types of texture features, including 266 GLDM features, 304 GLSZM features, 95 NGTDM features, 304 GLRLM features and 456 GLCM features. A total of 1781 radiomic features were extracted from the ROIs.
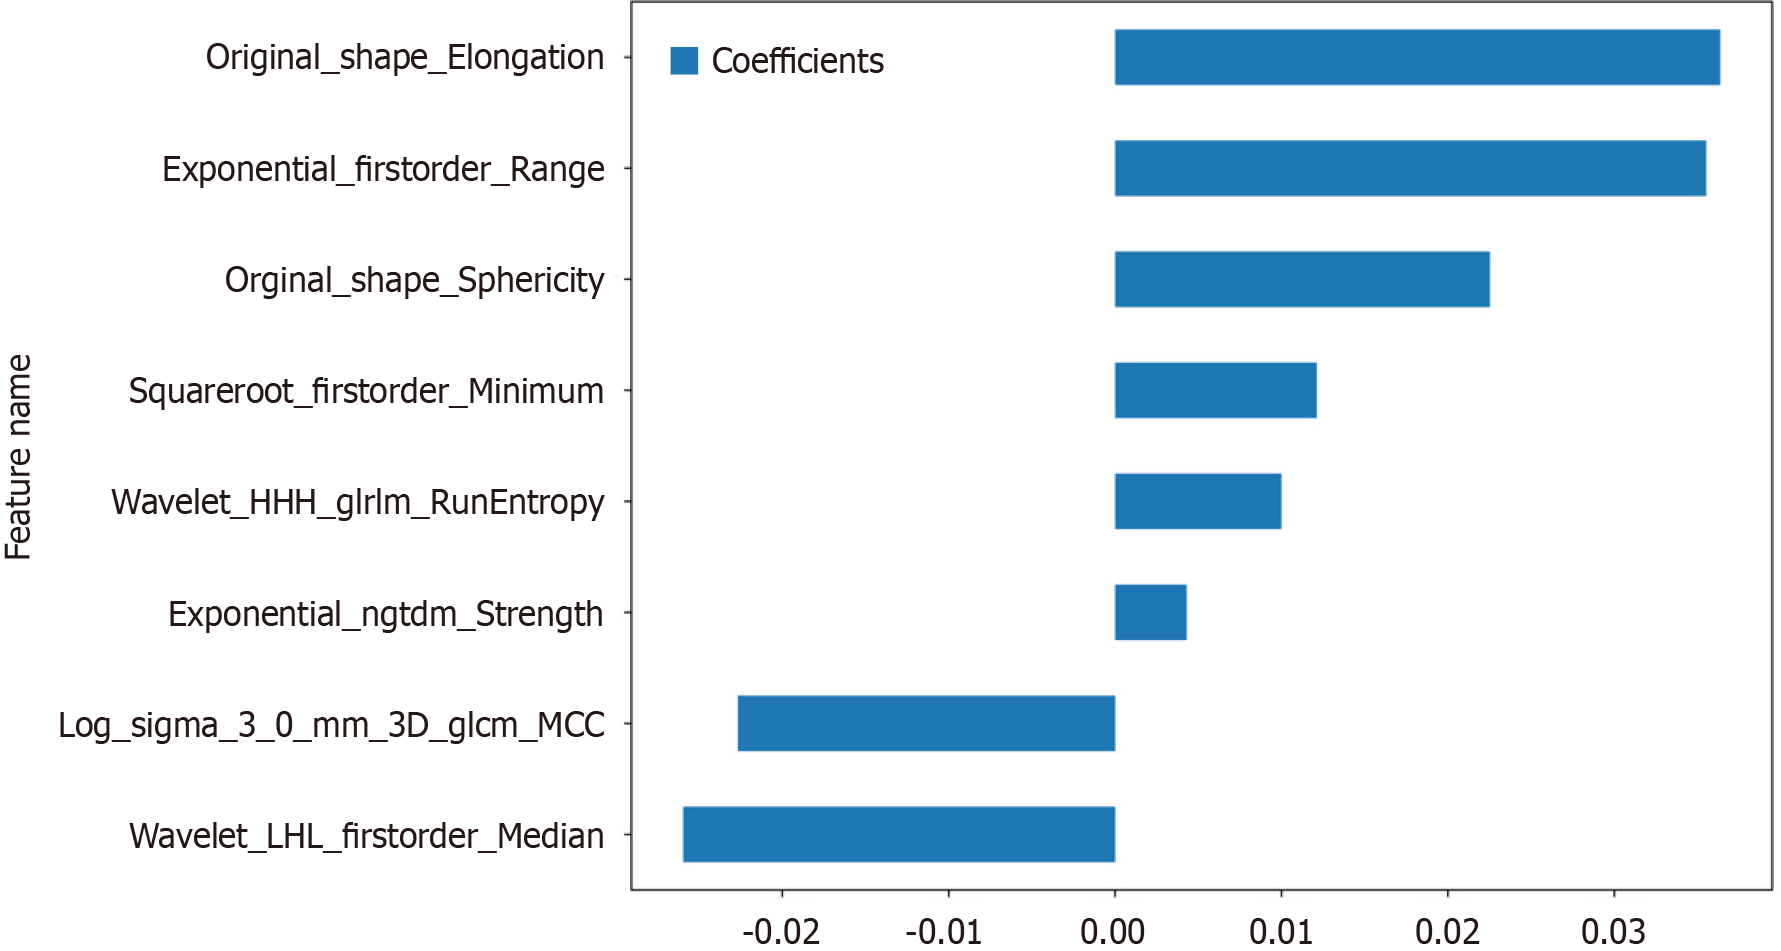
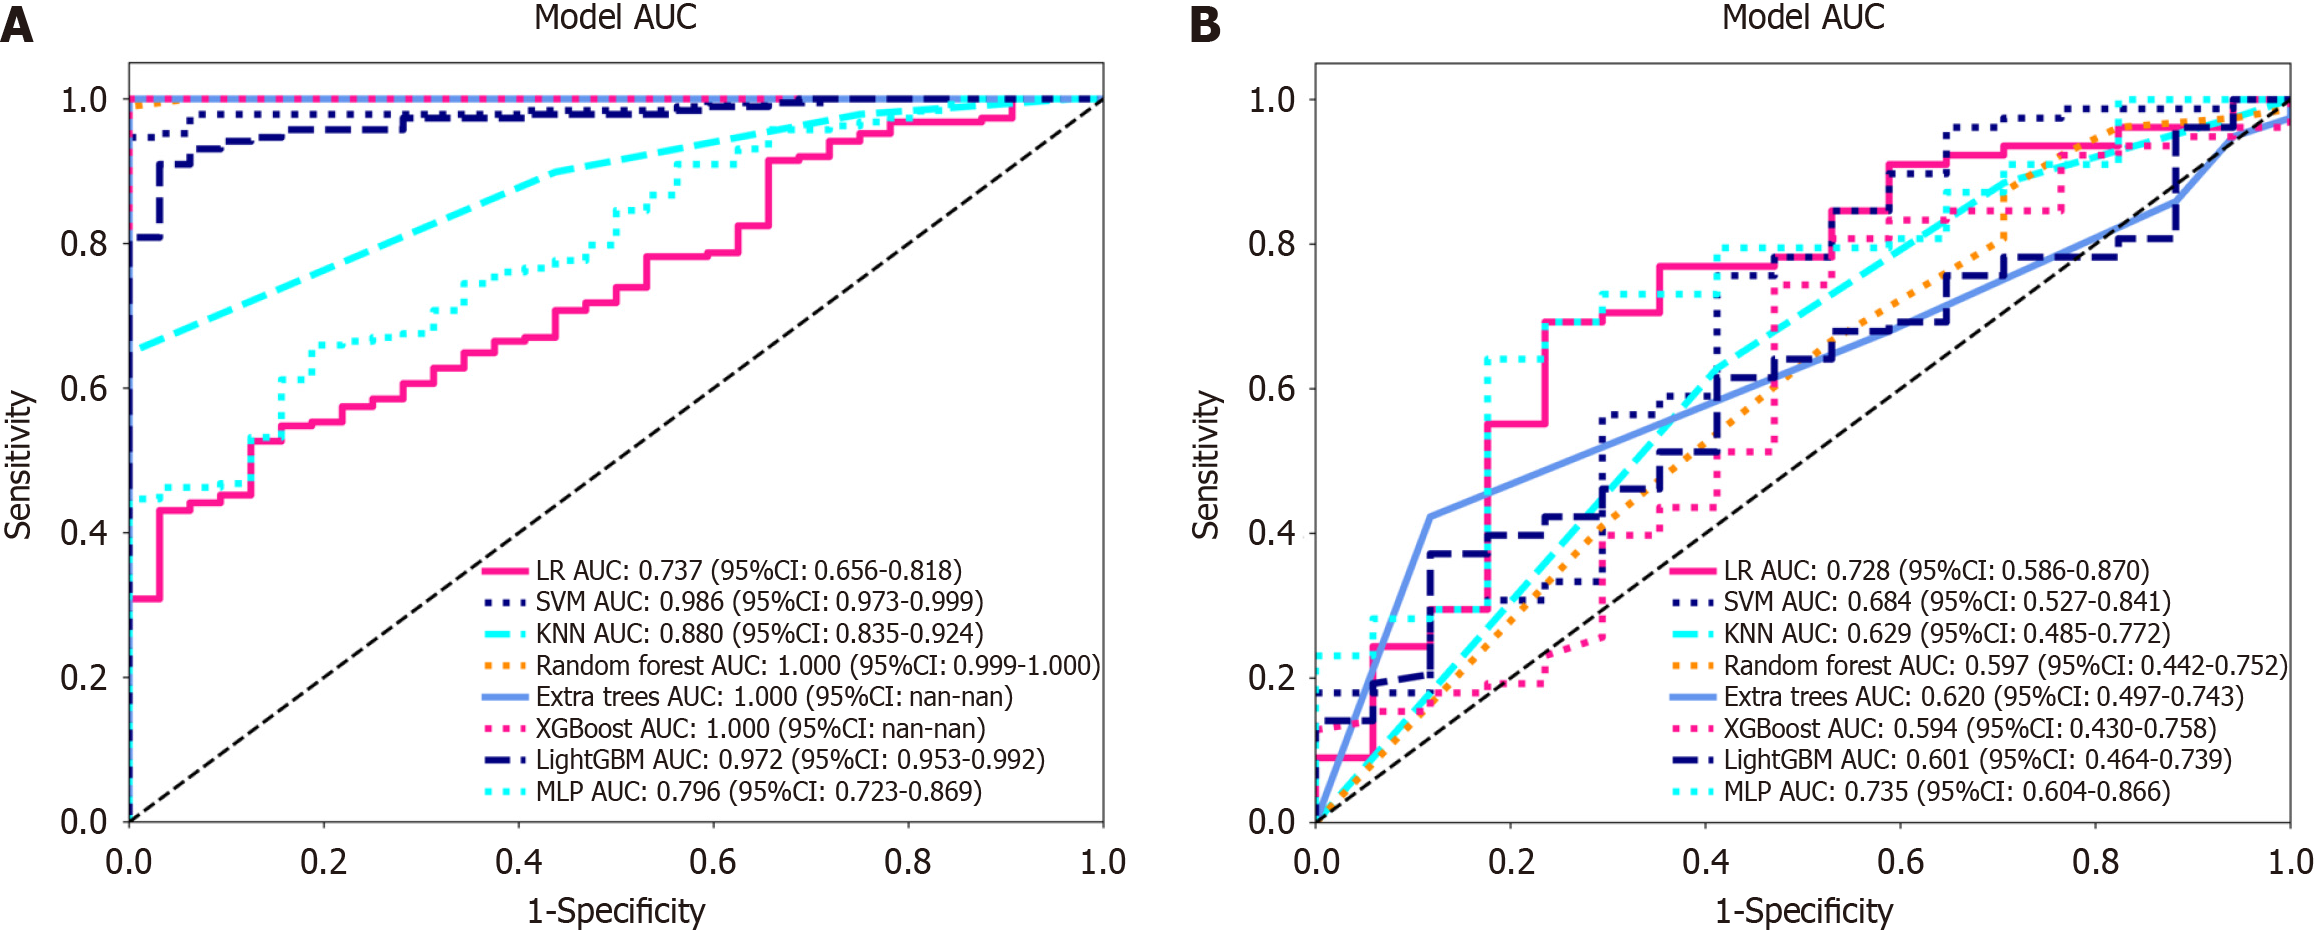
Nonzero coefficient features were selected to establish Rad-scores for logistic regression models utilizing the LASSO algorithm. The coefficients and mean standard error for 10-fold cross-validation are depicted in Figure 4. After LASSO regression, eight features with nonzero coefficient values remained (details are shown in Figure 5). All the selected features were used to construct the radiomics model. The optimal model was determined by comparing radiomic features with various classifiers, including LR, SVM, KNN, RF, ET, XGBoost, LightGBM, and MLP (Figure 6). A comparison of the models revealed that the MLP model performed better in the training cohort (AUC = 0.796; 95%CI: 0.723-0.869) and the validation cohort (AUC = 0.735; 95%CI: 0.604-0.866) because the AUC of the machine learning algorithms, including SVM, KNN, RF, ET, XGBoost and LightGBM, were overfitted, and the AUC of the MLP was greater than that of the LR; thus, the MLP showed the best discrimination and the best prediction stability (as shown in Figure 6 and Table 2).
| AUC | 95%CI | Sensitivity | Specificity | Accuracy | PPV | PPV | |
| Training cohort | |||||||
| LR | 0.737 | 0.656-0.818 | 0.527 | 0.875 | 0.577 | 0.961 | 0.239 |
| SVM | 0.986 | 0.973-0.999 | 0.947 | 1.000 | 0.955 | 1.000 | 0.762 |
| KNN | 0.880 | 0.835-0.924 | 0.649 | 1.000 | 0.700 | 1.000 | 0.327 |
| RF | 1.000 | 0.999-1.000 | 0.989 | 1.000 | 0.991 | 1.000 | 0.941 |
| ET | 1.000 | 1.000-1.000 | 1.000 | 1.000 | 1.000 | 1.000 | 1.000 |
| XGBoost | 1.000 | 1.000-1.000 | 1.000 | 1.000 | 1.000 | 1.000 | 1.000 |
| LightGBM | 0.972 | 0.953-0.992 | 0.910 | 0.969 | 0.918 | 0.994 | 0.646 |
| MLP | 0.796 | 0.723-0.869 | 0.660 | 0.812 | 0.682 | 0.954 | 0.289 |
| Validation cohort | |||||||
| LR | 0.728 | 0.586-0.870 | 0.692 | 0.765 | 0.577 | 0.931 | 0.351 |
| SVM | 0.684 | 0.527-0.841 | 0.756 | 0.588 | 0.955 | 0.894 | 0.345 |
| KNN | 0.629 | 0.485-0.772 | 0.628 | 1.000 | 0.700 | 0.875 | 0.256 |
| RF | 0.597 | 0.442-0.752 | 0.872 | 0.417 | 0.991 | 0.850 | 0.333 |
| ET | 0.620 | 0.497-0.743 | 0.423 | 1.000 | 1.000 | 0.943 | 0.250 |
| XGBoost | 0.594 | 0.430-0.758 | 0.808 | 0.471 | 1.000 | 0.875 | 0.348 |
| LightGBM | 0.601 | 0.464-0.739 | 0.372 | 0.882 | 0.918 | 0.935 | 0.234 |
| MLP | 0.735 | 0.604-0.866 | 0.641 | 0.824 | 0.682 | 0.943 | 0.333 |
Our clinical model was constructed based on the characteristics with P < 0.05 in the training cohort (Table 1), including tumor occupying intestinal circumference, N stage, neural invasion, and vascular invasion.
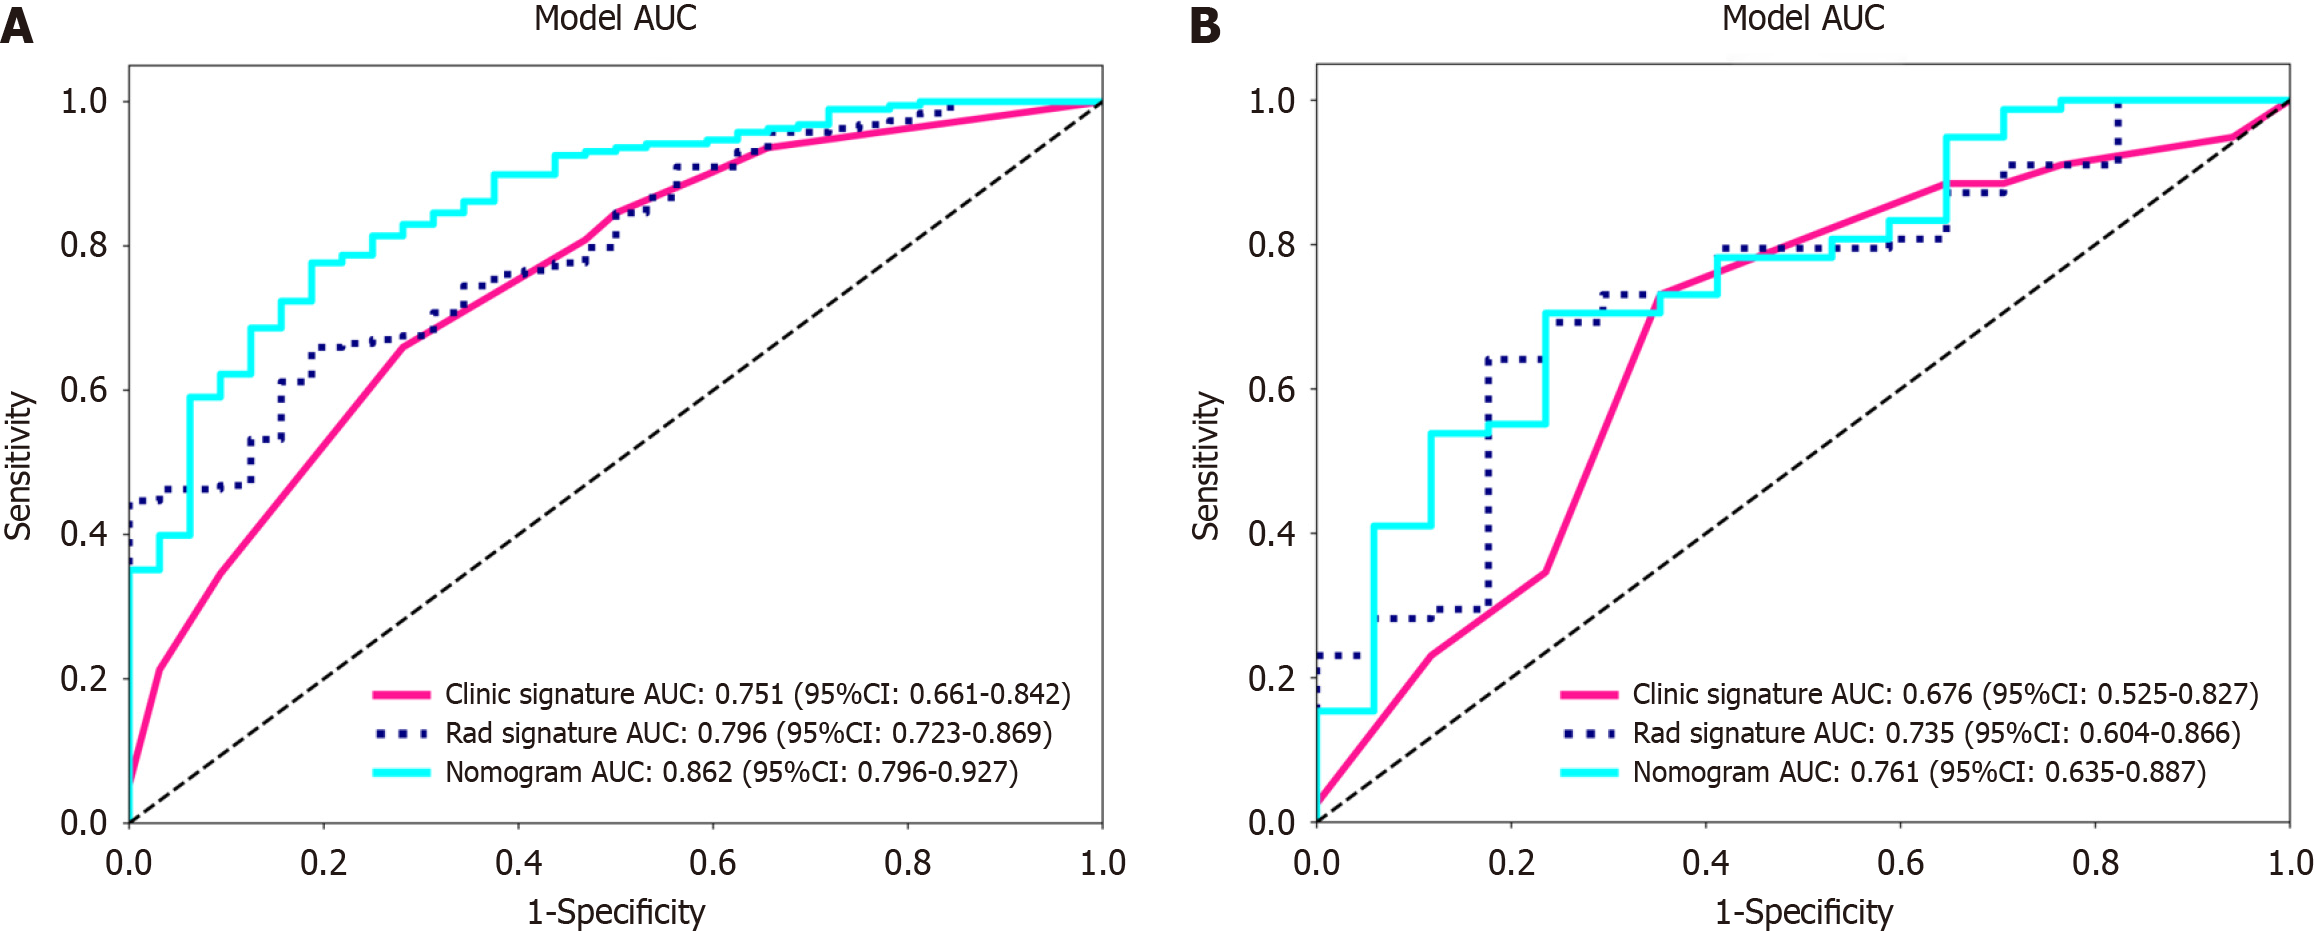
We integrated the clinical prediction model with the radiomic model and utilized the logistic regression algorithm to create a nomogram, which demonstrated the optimal AUC as shown in Figure 7. As shown in Figure 8 and Table 3, the clinical-radiomics model exhibited an AUC of 0.862 (95%CI: 0.796-0.927) in the training cohort and 0.761 (95%CI: 0.635-0.887) in the validation cohort. The Delong test was used to compare clinical characteristics, radiomic features, and the nomogram. Clinical, radiomic, and clinical-radiomic model ROC analyses revealed that the nomogram in the training cohort outperformed the clinical model and radiomic model. The P value of the Delong test was < 0.05, indicating statistical significance. In the validation cohort, the AUC of the nomogram was greater than that of the clinical model and radiomic model, but the P value of the Delong test exceeded 0.05, indicating that although there were variations in the AUC, the differences were not significant.
| Model | Training cohort | Validation cohort | ||||||
| AUC | 95%CI | Sensitivity | Specificity | AUC | 95%CI | Sensitivity | Specificity | |
| clinical | 0.751 | 0.661-0.842 | 0.660 | 0.719 | 0.676 | 0.525-0.827 | 0.731 | 0.647 |
| Radiomics | 0.796 | 0.723-0.869 | 0.660 | 0.812 | 0.735 | 0.604-0.866 | 0.641 | 0.824 |
| Radiomics-clinical model | 0.862 | 0.796-0.927 | 0.777 | 0.812 | 0.761 | 0.635-0.887 | 0.705 | 0.765 |
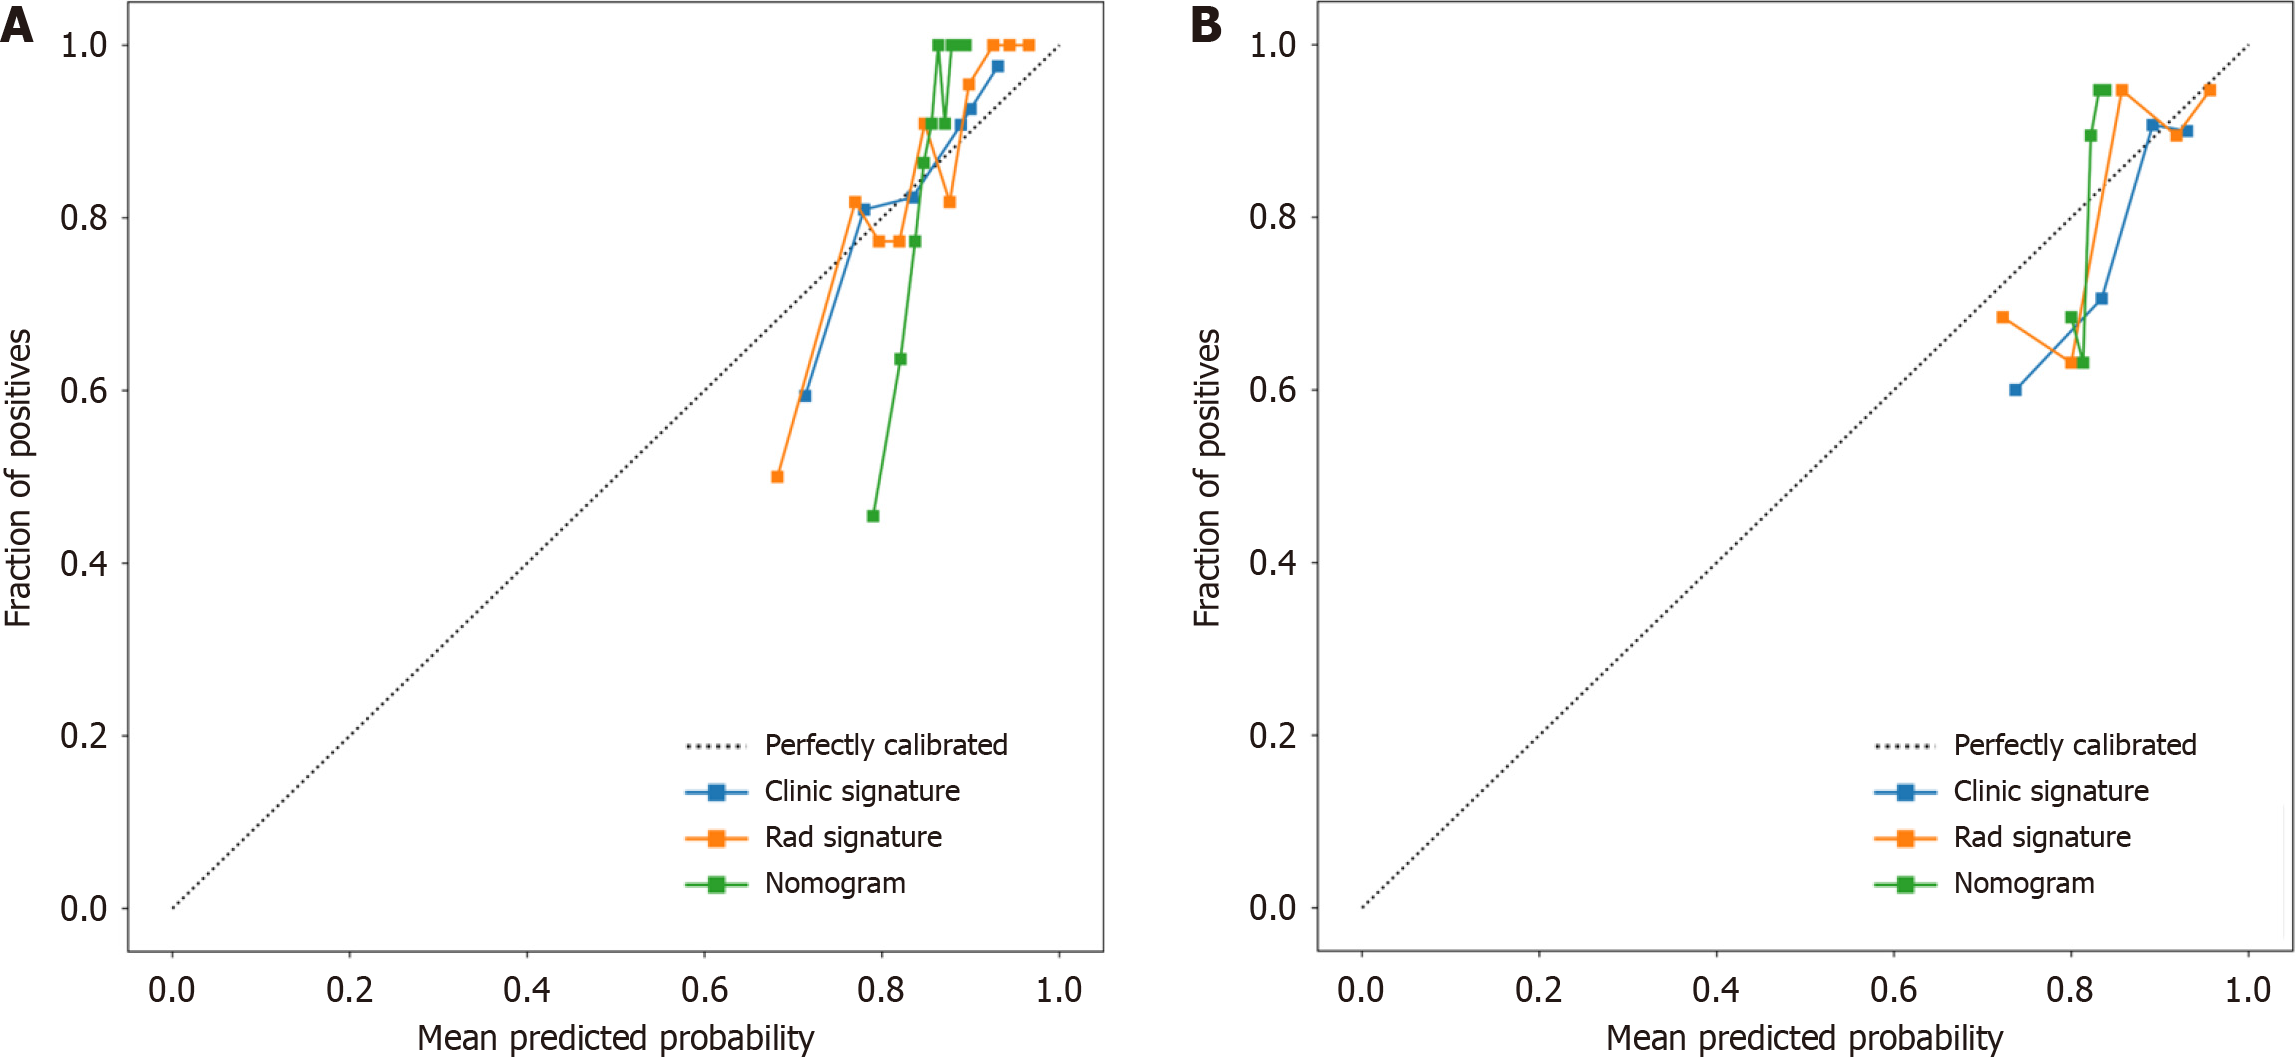
We assessed the calibration of the clinical models, radiomic models, and nomograms using the Hosmer-Lemeshow test. The calibration curves for the radiomic and clinical models displayed good agreement between the predicted and observed values in both the training and validation cohorts (Figure 9). However, the radiomic-clinical model exhibited comparatively weaker consistency. In this study, the clinical utility of the model was evaluated using DCA as shown in Figure 10. DCA indicated that in most cases, these models had a net clinical benefit.
Tumour differentiation grade is an independent prognostic factor for CRC, and the possible subjectivity and interobserver variability that may attend its determination is of concern[5]. Colonoscopy biopsy may provide some insight into tumour histological grade, but its overall accuracy is limited (less than 0.447), in contrast to the higher accuracy observed in our radiomic model[15]. Preoperative evaluation of the CRC differentiation grade has guiding importance for clinical treatment. In our study, a new nomogram based on T2WI was established and validated; this nomogram combined the selected radiomic characteristics and four clinical variables, namely, N stage, vascular invasion, nerve invasion, and the number of weeks spent occupying the intestinal tract, to help clinicians accurately predict the differentiation grade of CRC preoperatively. The AUC of the nomogram established by the machine learning algorithm based on T2WI in the training cohort and the external validation cohort were 0.862 and 0.761, respectively, which proved its good accuracy in predicting the differentiation grade of CRC.
We took the lead in establishing a machine learning radiomic model based on MRI data to accurately predict the preoperative differentiation grade of CRC patients, which has not been previously reported. Li et al[20] conducted a prospective study exploring the potential of quantitative spectral computed tomography (CT) parameters to detect gastric cancer and its histological types. These findings underscore the considerable potential of radiomics for noninvasive preoperative diagnosis of gastric cancer and its histological subtypes. In contrast to this study, which was based on spectral CT, the referenced study involved gastric cancer. Xu et al[21]'s study focused on using 256-slice CT whole-tumour perfusion images to predict differentiation grade. A total of 56 patients were included. The results showed that blood flow according to CT whole-tumour perfusion parameters could predict the grade of CRC, with an AUC of 0.828, which is different from that of our machine learning-based model. T2WI is also different from CT perfusion imaging, and our study showed a greater AUC. Therefore, there is a lack of MRI-based radiomic research on how to predict the differentiation grade of CRC. MRI is widely used to identify poor prognostic factors, evaluate tumour T stage, evaluate liver metastasis and other aspects via CT, and evaluate rectal cancer according to the guidelines of the European Society of Oncologists and the National Comprehensive Cancer Network. Therefore, MRI has become a necessary auxiliary technology in the diagnosis and treatment of CRC[22,23,24]. Especially in the partial stage of primary and recurrent rectal cancer, compared with techniques such as CT and rectal ultrasound, tumor, node, metastasis (TNM) staging can not only accurately predict several other high-risk features, including circumferential resection margins, the extramural vascular infiltration status, and tumour deposits, etc., to aid in tumour stratification[25-28]. Lin et al[29]'s study combined radiomics features with CEA levels, and the established model showed good discrimination, with an AUC as high as 0.882, indicating that the model could accurately predict the preoperative T stage of rectal cancer in patients. A multicentre retrospective study conducted by Li et al[30] showed that the imaging omics model (AUC = 0.78) could suggest the microsatellite instable status of rectal cancer patients. However, it cannot replace genetic testing as the gold standard.
In the constructed radiomic clinical model, in addition to the radiomic characteristics, four clinical risk factors were included: tumour involvement in the intestinal periphery, N stage, nerve invasion and vascular invasion. These factors are closely associated with the heightened proliferative, metastatic, and invasive capabilities often observed in poorly differentiated tumours[31]. Huang et al[15]'s study suggested that tumour location in the right colon was a predictor of the histological grade of colorectal adenocarcinoma, which was different from our results. Tumour location was not significantly different between the two groups. Derwinger et al[5] suggested that the differentiation grade of tumour was associated with the TNM stage of CRC and the risk of lymph node metastasis, similar to the results obtained by that study, revealing the close relationship between the differentiation grade of tumour and lymph node metastasis.
Poorly differentiated adenocarcinoma, constituting approximately 20% of CRC cases, is notorious for its rapid tumour progression, metastatic tendencies, and increased likelihood of recurrence[32]. The molecular underpinnings of the strong correlation between poorly differentiated colorectal adenocarcinoma and poor patient prognosis are still not fully understood[33]. Emerging research suggests that the host gut microbiota may influence CRC differentiation and malignancy during carcinogenesis. An imbalance characterized by an increase in specific microorganisms and a reduction in beneficial bacteria could elevate the risk of poorly differentiated CRC and enhance tumour invasiveness[34]. This study also established a prediction model for poorly differentiated CRC based on intestinal bacteria that included 6 machine learning algorithms, with the highest AUC value of 0.700. However, obtaining information on the intestinal flora is not easy, economical, simple and accurate, giving our study its advantage.
In our study, we developed a radiomic clinical model that can accurately predict the histological type of CRC, and MRI has been widely accepted as a valuable tool for pretreatment evaluation of CRC, suggesting that our research is pro
This study has several limitations. First, this was a retrospective analysis, and sample selection bias was inevitable because we only recruited patients who underwent MRI and were pathologically confirmed to have CRC after surgery. Second, because this was a single-centre study, the sample size was relatively small, and a prospective multicentre study is expected to mitigate this problem. Finally, we used only a machine learning algorithm to build the model, and deep learning may further improve model performance.
Our study underscores the potential of radiomic and clinical-radiomic machine learning-based models involving high-resolution T2WI for predicting the histological grade of CRC. Radiomics offers a promising avenue for evaluating the differentiation grade of CRC tissues, ultimately serving as a practical tool for developing personalized treatment strategies for CRC patients.
Magnetic resonance imaging (MRI) is an important technology for the preoperative evaluation of colorectal cancer (CRC). At present, studies on predicting the differentiation grade of CRC based on MRI are lacking. The development of a noninvasive and accurate preoperative prediction method for evaluating the differentiation grade of disease in CRC patients is highly important for individualized treatment.
Due to tumour heterogeneity, colonoscopy biopsy has limitations in evaluating the differentiation grade of CRC. The prospect of creating an accurate radiomics-based system for differentiating the grade of CRC and facilitating prognosis prediction warrants investigation.
In this study, we sought to construct a prediction model based on radiomic and clinical factors for accurately predicting the differentiation grade of CRC patients.
The enhanced MRI data and clinical information of 315 patients with CRC were collected and analyzed, and a machine learning algorithm was developed based on the extracted radiomic features and important clinical features. Each model was evaluated, and the best model was selected. The performance of the model was evaluated by receiver operating characteristic curve, calibration curve and decision curve analyses.
In this study, eight radiomic features were selected from enhanced MRI, and eight models were constructed based on a machine learning algorithm. The multilayer perceptron (MLP) algorithm showed the best performance, with an area under the curve (AUC) of 0.796 (95%CI: 0.723-0.869) in the training cohort and 0.735 (95%CI: 0.604-0.866) in the validation cohort. Radiomics features were combined with N stage, tumour occupying intestinal circumference, nerve invasion, and vascular invasion to develop a radiomic-clinical model. The AUC of the radiomic-clinical model was 0.862 (95%CI: 0.796-0.927) in the training cohort and 0.761 (95%CI: 0.635-0.887) in the validation cohort.
The model based on the MLP algorithm is helpful for providing individualized differentiation grade assessment for CRC patients.
The radiomic-clinical prediction model constructed in this study is helpful for evaluating the differentiation grade and prognosis of CRC patients, and a prospective multicentre trial will help to improve the performance of the model.
Provenance and peer review: Unsolicited article; Externally peer reviewed.
Peer-review model: Single blind
Specialty type: Oncology
Country/Territory of origin: China
Peer-review report’s scientific quality classification
Grade A (Excellent): 0
Grade B (Very good): 0
Grade C (Good): C, C
Grade D (Fair): 0
Grade E (Poor): 0
P-Reviewer: Blanco-Salazar A, Mexico; Micsik T, Hungary S-Editor: Zhang H L-Editor: A P-Editor: Zheng XM
| 1. | Baidoun F, Elshiwy K, Elkeraie Y, Merjaneh Z, Khoudari G, Sarmini MT, Gad M, Al-Husseini M, Saad A. Colorectal Cancer Epidemiology: Recent Trends and Impact on Outcomes. Curr Drug Targets. 2021;22:998-1009. [RCA] [PubMed] [DOI] [Full Text] [Cited by in Crossref: 26] [Cited by in RCA: 156] [Article Influence: 39.0] [Reference Citation Analysis (2)] |
| 2. | Qu R, Ma Y, Zhang Z, Fu W. Increasing burden of colorectal cancer in China. Lancet Gastroenterol Hepatol. 2022;7:700. [RCA] [PubMed] [DOI] [Full Text] [Cited by in RCA: 52] [Reference Citation Analysis (0)] |
| 3. | Munro MJ, Wickremesekera SK, Peng L, Tan ST, Itinteang T. Cancer stem cells in colorectal cancer: a review. J Clin Pathol. 2018;71:110-116. [RCA] [PubMed] [DOI] [Full Text] [Cited by in Crossref: 139] [Cited by in RCA: 215] [Article Influence: 26.9] [Reference Citation Analysis (0)] |
| 4. | Zheng H, Song K, Fu Y, You T, Yang J, Guo W, Wang K, Jin L, Gu Y, Qi L, Zhao W, Guo Z. A qualitative transcriptional signature for determining the grade of colorectal adenocarcinoma. Cancer Gene Ther. 2020;27:680-690. [RCA] [PubMed] [DOI] [Full Text] [Cited by in Crossref: 2] [Cited by in RCA: 6] [Article Influence: 1.0] [Reference Citation Analysis (0)] |
| 5. | Derwinger K, Kodeda K, Bexe-Lindskog E, Taflin H. Tumour differentiation grade is associated with TNM staging and the risk of node metastasis in colorectal cancer. Acta Oncol. 2010;49:57-62. [RCA] [PubMed] [DOI] [Full Text] [Cited by in Crossref: 50] [Cited by in RCA: 70] [Article Influence: 4.7] [Reference Citation Analysis (0)] |
| 6. | Mendoza-Moreno F, Diez-Alonso M, Matías-García B, Ovejero-Merino E, Gómez-Sanz R, Blázquez-Martín A, Quiroga-Valcárcel A, Vera-Mansilla C, Molina R, San-Juan A, Barrena-Blázquez S, Ortega MA, Alvarez-Mon M, Gutiérrez-Calvo A. Prognostic Factors of Survival in Patients with Peritoneal Metastasis from Colorectal Cancer. J Clin Med. 2022;11. [RCA] [PubMed] [DOI] [Full Text] [Full Text (PDF)] [Cited by in RCA: 9] [Reference Citation Analysis (0)] |
| 7. | Luo C, Cen S, Ying J, Wang X, Fu Z, Liu P, Wu W, Ding G. Tumor clinicopathological characteristics and their prognostic value in mucinous colorectal carcinoma. Future Oncol. 2019;15:4095-4104. [RCA] [PubMed] [DOI] [Full Text] [Cited by in Crossref: 1] [Cited by in RCA: 4] [Article Influence: 0.7] [Reference Citation Analysis (0)] |
| 8. | Rosty C, Williamson EJ, Clendenning M, Walters RJ, Win AK, Jenkins MA, Hopper JL, Winship IM, Southey MC, Giles GG, English DR, Buchanan DD. Should the grading of colorectal adenocarcinoma include microsatellite instability status? Hum Pathol. 2014;45:2077-2084. [RCA] [PubMed] [DOI] [Full Text] [Cited by in Crossref: 39] [Cited by in RCA: 38] [Article Influence: 3.5] [Reference Citation Analysis (0)] |
| 9. | Xiao H, Yoon YS, Hong SM, Roh SA, Cho DH, Yu CS, Kim JC. Poorly differentiated colorectal cancers: correlation of microsatellite instability with clinicopathologic features and survival. Am J Clin Pathol. 2013;140:341-347. [RCA] [PubMed] [DOI] [Full Text] [Cited by in Crossref: 52] [Cited by in RCA: 54] [Article Influence: 4.5] [Reference Citation Analysis (0)] |
| 10. | Nakata S, Tanaka H, Ito Y, Hara M, Fujita M, Kondo E, Kanemitsu Y, Yatabe Y, Nakanishi H. Deficient HER3 expression in poorly-differentiated colorectal cancer cells enhances gefitinib sensitivity. Int J Oncol. 2014;45:1583-1593. [RCA] [PubMed] [DOI] [Full Text] [Cited by in Crossref: 9] [Cited by in RCA: 12] [Article Influence: 1.1] [Reference Citation Analysis (0)] |
| 11. | Dekker E, Tanis PJ, Vleugels JLA, Kasi PM, Wallace MB. Colorectal cancer. Lancet. 2019;394:1467-1480. [RCA] [PubMed] [DOI] [Full Text] [Cited by in Crossref: 1570] [Cited by in RCA: 3029] [Article Influence: 504.8] [Reference Citation Analysis (3)] |
| 12. | Hallinan JT, Venkatesh SK. Gastric carcinoma: imaging diagnosis, staging and assessment of treatment response. Cancer Imaging. 2013;13:212-227. [RCA] [PubMed] [DOI] [Full Text] [Full Text (PDF)] [Cited by in Crossref: 74] [Cited by in RCA: 105] [Article Influence: 8.8] [Reference Citation Analysis (0)] |
| 13. | Huang Q, Qin H, Xiao J, He X, Xie M, Yao Q, Lan P, Lian L. Association of tumor differentiation and prognosis in patients with rectal cancer undergoing neoadjuvant chemoradiation therapy. Gastroenterol Rep (Oxf). 2019;7:283-290. [RCA] [PubMed] [DOI] [Full Text] [Full Text (PDF)] [Cited by in Crossref: 8] [Cited by in RCA: 26] [Article Influence: 3.7] [Reference Citation Analysis (0)] |
| 14. | Gerlinger M, Rowan AJ, Horswell S, Math M, Larkin J, Endesfelder D, Gronroos E, Martinez P, Matthews N, Stewart A, Tarpey P, Varela I, Phillimore B, Begum S, McDonald NQ, Butler A, Jones D, Raine K, Latimer C, Santos CR, Nohadani M, Eklund AC, Spencer-Dene B, Clark G, Pickering L, Stamp G, Gore M, Szallasi Z, Downward J, Futreal PA, Swanton C. Intratumor heterogeneity and branched evolution revealed by multiregion sequencing. N Engl J Med. 2012;366:883-892. [RCA] [PubMed] [DOI] [Full Text] [Cited by in Crossref: 6102] [Cited by in RCA: 5961] [Article Influence: 458.5] [Reference Citation Analysis (0)] |
| 15. | Huang X, Cheng Z, Huang Y, Liang C, He L, Ma Z, Chen X, Wu X, Li Y, Liu Z. CT-based Radiomics Signature to Discriminate High-grade From Low-grade Colorectal Adenocarcinoma. Acad Radiol. 2018;25:1285-1297. [RCA] [PubMed] [DOI] [Full Text] [Cited by in Crossref: 31] [Cited by in RCA: 49] [Article Influence: 7.0] [Reference Citation Analysis (0)] |
| 16. | Huang YQ, Liang CH, He L, Tian J, Liang CS, Chen X, Ma ZL, Liu ZY. Development and Validation of a Radiomics Nomogram for Preoperative Prediction of Lymph Node Metastasis in Colorectal Cancer. J Clin Oncol. 2016;34:2157-2164. [RCA] [PubMed] [DOI] [Full Text] [Cited by in Crossref: 896] [Cited by in RCA: 1321] [Article Influence: 146.8] [Reference Citation Analysis (0)] |
| 17. | Shin J, Seo N, Baek SE, Son NH, Lim JS, Kim NK, Koom WS, Kim S. MRI Radiomics Model Predicts Pathologic Complete Response of Rectal Cancer Following Chemoradiotherapy. Radiology. 2022;303:351-358. [RCA] [PubMed] [DOI] [Full Text] [Cited by in Crossref: 4] [Cited by in RCA: 131] [Article Influence: 43.7] [Reference Citation Analysis (0)] |
| 18. | Barral M, Eveno C, Hoeffel C, Boudiaf M, Bazeries P, Foucher R, Pocard M, Dohan A, Soyer P. Diffusion-weighted magnetic resonance imaging in colorectal cancer. J Visc Surg. 2016;153:361-369. [RCA] [PubMed] [DOI] [Full Text] [Cited by in Crossref: 18] [Cited by in RCA: 17] [Article Influence: 1.9] [Reference Citation Analysis (0)] |
| 19. | Lambin P, Rios-Velazquez E, Leijenaar R, Carvalho S, van Stiphout RG, Granton P, Zegers CM, Gillies R, Boellard R, Dekker A, Aerts HJ. Radiomics: extracting more information from medical images using advanced feature analysis. Eur J Cancer. 2012;48:441-446. [RCA] [PubMed] [DOI] [Full Text] [Cited by in Crossref: 2415] [Cited by in RCA: 3857] [Article Influence: 296.7] [Reference Citation Analysis (2)] |
| 20. | Li R, Li J, Wang X, Liang P, Gao J. Detection of gastric cancer and its histological type based on iodine concentration in spectral CT. Cancer Imaging. 2018;18:42. [RCA] [PubMed] [DOI] [Full Text] [Full Text (PDF)] [Cited by in Crossref: 20] [Cited by in RCA: 42] [Article Influence: 6.0] [Reference Citation Analysis (0)] |
| 21. | Xu Y, Sun H, Song A, Yang Q, Lu X, Wang W. Predictive Significance of Tumor Grade Using 256-Slice CT Whole-Tumor Perfusion Imaging in Colorectal Adenocarcinoma. Acad Radiol. 2015;22:1529-1535. [RCA] [PubMed] [DOI] [Full Text] [Cited by in Crossref: 6] [Cited by in RCA: 5] [Article Influence: 0.5] [Reference Citation Analysis (0)] |
| 22. | Glynne-Jones R, Wyrwicz L, Tiret E, Brown G, Rödel C, Cervantes A, Arnold D; ESMO Guidelines Committee. Rectal cancer: ESMO Clinical Practice Guidelines for diagnosis, treatment and follow-up. Ann Oncol. 2017;28:iv22-iv40. [RCA] [PubMed] [DOI] [Full Text] [Cited by in Crossref: 1112] [Cited by in RCA: 1199] [Article Influence: 149.9] [Reference Citation Analysis (0)] |
| 23. | Benson AB, Venook AP, Al-Hawary MM, Arain MA, Chen YJ, Ciombor KK, Cohen S, Cooper HS, Deming D, Garrido-Laguna I, Grem JL, Gunn A, Hoffe S, Hubbard J, Hunt S, Kirilcuk N, Krishnamurthi S, Messersmith WA, Meyerhardt J, Miller ED, Mulcahy MF, Nurkin S, Overman MJ, Parikh A, Patel H, Pedersen K, Saltz L, Schneider C, Shibata D, Skibber JM, Sofocleous CT, Stoffel EM, Stotsky-Himelfarb E, Willett CG, Johnson-Chilla A, Gurski LA. NCCN Guidelines Insights: Rectal Cancer, Version 6.2020. J Natl Compr Canc Netw. 2020;18:806-815. [RCA] [PubMed] [DOI] [Full Text] [Cited by in Crossref: 355] [Cited by in RCA: 332] [Article Influence: 66.4] [Reference Citation Analysis (0)] |
| 24. | Horvat N, Carlos Tavares Rocha C, Clemente Oliveira B, Petkovska I, Gollub MJ. MRI of Rectal Cancer: Tumor Staging, Imaging Techniques, and Management. Radiographics. 2019;39:367-387. [RCA] [PubMed] [DOI] [Full Text] [Cited by in Crossref: 128] [Cited by in RCA: 313] [Article Influence: 52.2] [Reference Citation Analysis (0)] |
| 25. | Balyasnikova S, Brown G. Optimal Imaging Strategies for Rectal Cancer Staging and Ongoing Management. Curr Treat Options Oncol. 2016;17:32. [RCA] [PubMed] [DOI] [Full Text] [Full Text (PDF)] [Cited by in Crossref: 54] [Cited by in RCA: 68] [Article Influence: 8.5] [Reference Citation Analysis (0)] |
| 26. | Ma X, Shen F, Jia Y, Xia Y, Li Q, Lu J. MRI-based radiomics of rectal cancer: preoperative assessment of the pathological features. BMC Med Imaging. 2019;19:86. [RCA] [PubMed] [DOI] [Full Text] [Full Text (PDF)] [Cited by in Crossref: 39] [Cited by in RCA: 76] [Article Influence: 12.7] [Reference Citation Analysis (0)] |
| 27. | Lord AC, D'Souza N, Shaw A, Rokan Z, Moran B, Abulafi M, Rasheed S, Chandramohan A, Corr A, Chau I, Brown G. MRI-Diagnosed Tumor Deposits and EMVI Status Have Superior Prognostic Accuracy to Current Clinical TNM Staging in Rectal Cancer. Ann Surg. 2022;276:334-344. [RCA] [PubMed] [DOI] [Full Text] [Cited by in Crossref: 29] [Cited by in RCA: 123] [Article Influence: 24.6] [Reference Citation Analysis (0)] |
| 28. | Taylor FG, Quirke P, Heald RJ, Moran BJ, Blomqvist L, Swift IR, Sebag-Montefiore D, Tekkis P, Brown G; Magnetic Resonance Imaging in Rectal Cancer European Equivalence Study Study Group. Preoperative magnetic resonance imaging assessment of circumferential resection margin predicts disease-free survival and local recurrence: 5-year follow-up results of the MERCURY study. J Clin Oncol. 2014;32:34-43. [RCA] [PubMed] [DOI] [Full Text] [Cited by in Crossref: 354] [Cited by in RCA: 443] [Article Influence: 36.9] [Reference Citation Analysis (0)] |
| 29. | Lin X, Zhao S, Jiang H, Jia F, Wang G, He B, Ma X, Li J, Shi Z. A radiomics-based nomogram for preoperative T staging prediction of rectal cancer. Abdom Radiol (NY). 2021;46:4525-4535. [RCA] [PubMed] [DOI] [Full Text] [Full Text (PDF)] [Cited by in Crossref: 2] [Cited by in RCA: 15] [Article Influence: 3.8] [Reference Citation Analysis (0)] |
| 30. | Li Z, Zhang J, Zhong Q, Feng Z, Shi Y, Xu L, Zhang R, Yu F, Lv B, Yang T, Huang C, Cui F, Chen F. Development and external validation of a multiparametric MRI-based radiomics model for preoperative prediction of microsatellite instability status in rectal cancer: a retrospective multicenter study. Eur Radiol. 2023;33:1835-1843. [RCA] [PubMed] [DOI] [Full Text] [Cited by in Crossref: 2] [Cited by in RCA: 20] [Article Influence: 10.0] [Reference Citation Analysis (0)] |
| 31. | Reggiani Bonetti L, Barresi V, Bettelli S, Domati F, Palmiere C. Poorly differentiated clusters (PDC) in colorectal cancer: what is and ought to be known. Diagn Pathol. 2016;11:31. [RCA] [PubMed] [DOI] [Full Text] [Full Text (PDF)] [Cited by in Crossref: 19] [Cited by in RCA: 27] [Article Influence: 3.0] [Reference Citation Analysis (0)] |
| 32. | Liu J, Huang Z, Chen HN, Qin S, Chen Y, Jiang J, Zhang Z, Luo M, Ye Q, Xie N, Zhou ZG, Wei Y, Xie K, Huang C. ZNF37A promotes tumor metastasis through transcriptional control of THSD4/TGF-β axis in colorectal cancer. Oncogene. 2021;40:3394-3407. [RCA] [PubMed] [DOI] [Full Text] [Cited by in Crossref: 9] [Cited by in RCA: 21] [Article Influence: 5.3] [Reference Citation Analysis (0)] |
| 33. | Shen L, Qu X, Li H, Xu C, Wei M, Wang Q, Ru Y, Liu B, Xu Y, Li K, Hu J, Wang L, Ma Y, Li M, Lai X, Gao L, Wu K, Yao L, Zheng J, Zhang J. NDRG2 facilitates colorectal cancer differentiation through the regulation of Skp2-p21/p27 axis. Oncogene. 2018;37:1759-1774. [RCA] [PubMed] [DOI] [Full Text] [Full Text (PDF)] [Cited by in Crossref: 25] [Cited by in RCA: 53] [Article Influence: 7.6] [Reference Citation Analysis (0)] |
| 34. | Qi Z, Zhibo Z, Jing Z, Zhanbo Q, Shugao H, Weili J, Jiang L, Shuwen H. Prediction model of poorly differentiated colorectal cancer (CRC) based on gut bacteria. BMC Microbiol. 2022;22:312. [RCA] [PubMed] [DOI] [Full Text] [Full Text (PDF)] [Cited by in RCA: 18] [Reference Citation Analysis (0)] |
| 35. | Song M, Li S, Wang H, Hu K, Wang F, Teng H, Wang Z, Liu J, Jia AY, Cai Y, Li Y, Zhu X, Geng J, Zhang Y, Wan X, Wang W. MRI radiomics independent of clinical baseline characteristics and neoadjuvant treatment modalities predicts response to neoadjuvant therapy in rectal cancer. Br J Cancer. 2022;127:249-257. [RCA] [PubMed] [DOI] [Full Text] [Full Text (PDF)] [Cited by in Crossref: 1] [Cited by in RCA: 23] [Article Influence: 7.7] [Reference Citation Analysis (0)] |
| 36. | Li H, Chen XL, Liu H, Liu YS, Li ZL, Pang MH, Pu H. MRI-based multiregional radiomics for preoperative prediction of tumor deposit and prognosis in resectable rectal cancer: a bicenter study. Eur Radiol. 2023;33:7561-7572. [RCA] [PubMed] [DOI] [Full Text] [Cited by in Crossref: 30] [Cited by in RCA: 25] [Article Influence: 12.5] [Reference Citation Analysis (0)] |


