Copyright
©The Author(s) 2023.
World J Gastrointest Oncol. Jun 15, 2023; 15(6): 1073-1085
Published online Jun 15, 2023. doi: 10.4251/wjgo.v15.i6.1073
Published online Jun 15, 2023. doi: 10.4251/wjgo.v15.i6.1073
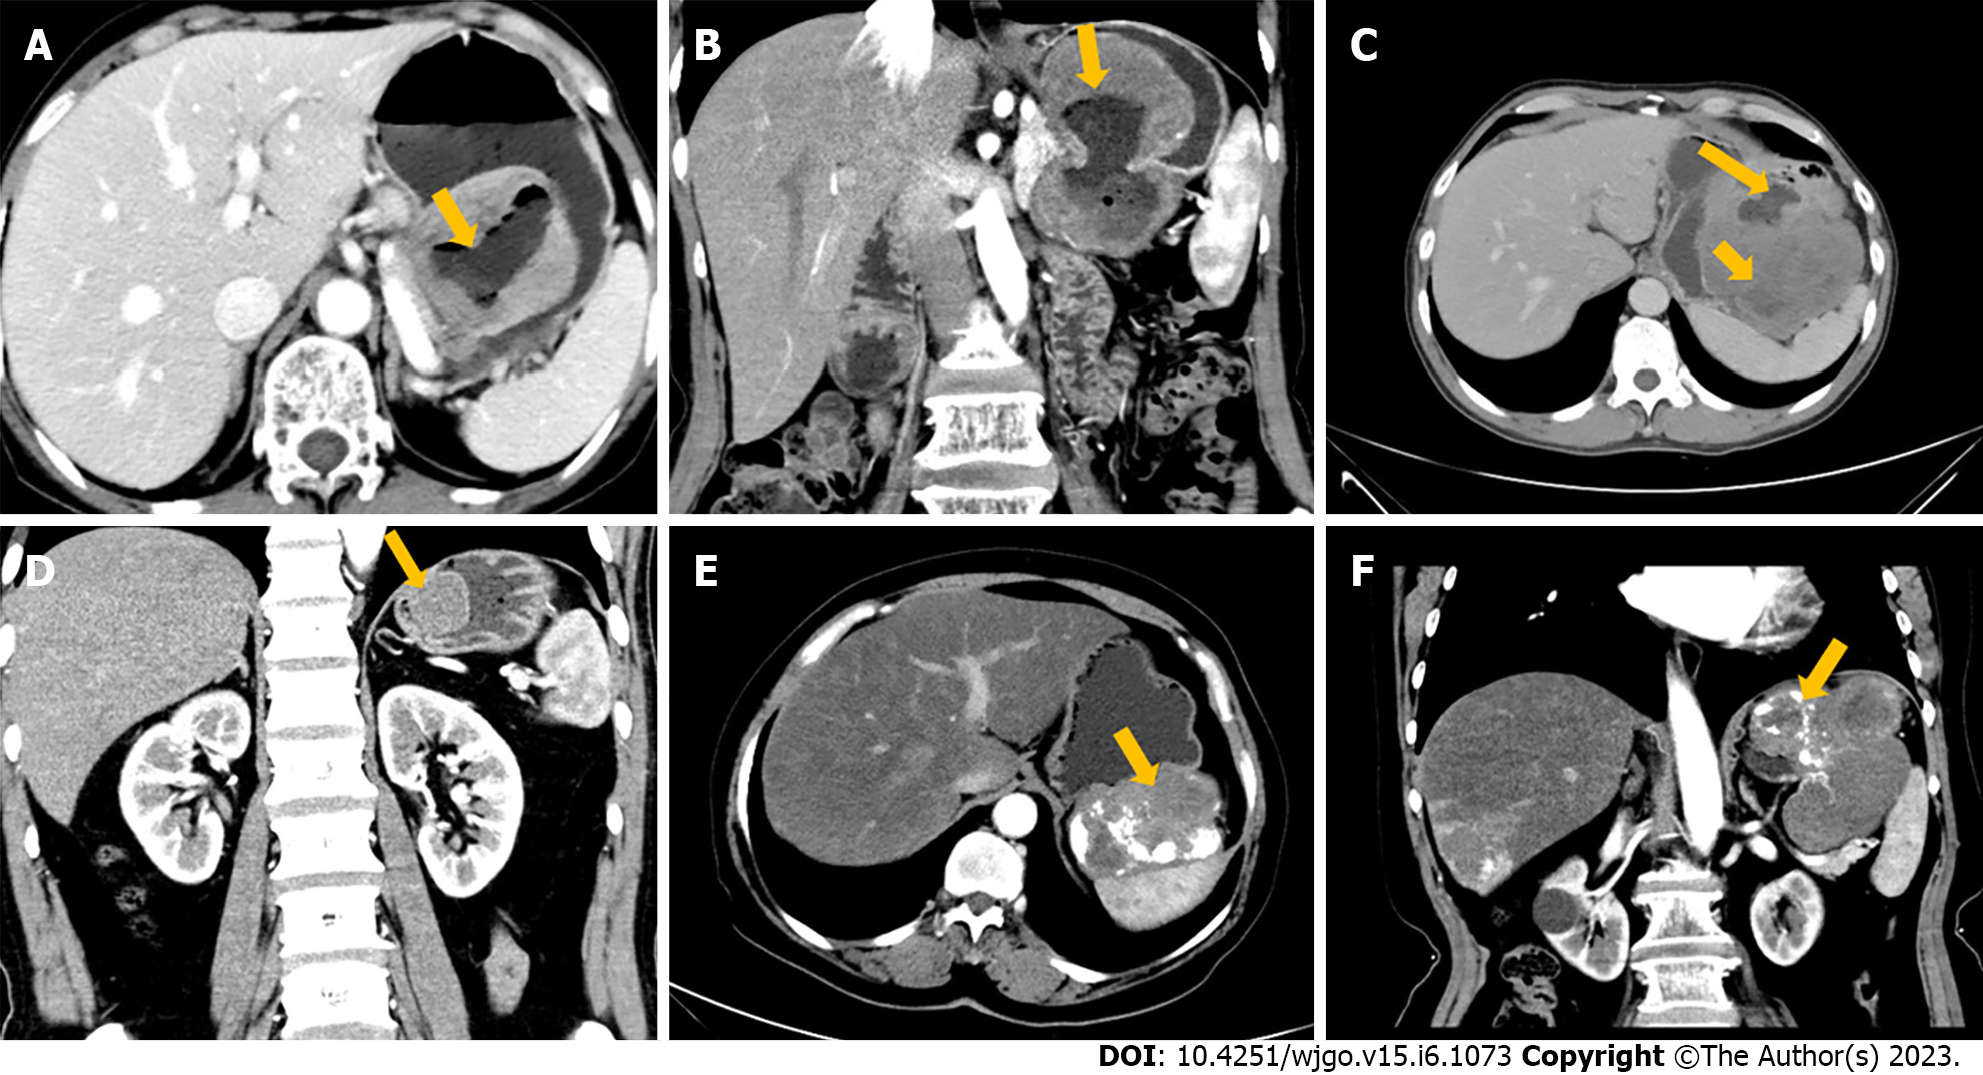
Figure 1 Computed tomography findings.
A and B: A 71-year-old woman with high-risk category gastric gastrointestinal stromal tumor (GIST). Axial (A) and coronal (B) in the arterial phase (AP) computed tomography (CT) images demonstrate an irregular, mixed growth pattern, heterogeneously enhanced tumor with prominent ulceration (arrow); C: A 54-year-old man with high-risk gastric GIST. Axial portal venous phase shows a lesion with a mixed growth pattern, 20-cm, irregular contour, heterogeneous pattern of contrast enhancement with necrotic areas inside (short arrows), and surface ulceration (long arrow); D: A 49-year-old man with low-risk category gastric GIST. Coronal AP shows a 3-cm mass with regular contours, well defined, and homogeneous pattern of contrast enhancement (homogeneous enhancement) (arrow); E and F: A 69-year-old woman with high-risk gastric GIST. Axial (E) and coronal (F) contrast-enhanced CT images in the AP show a lobular, well-defined tumor with exophytic growth pattern and heterogeneous pattern of contrast enhancement, with prominent calcification and necrotic areas inside (arrows).
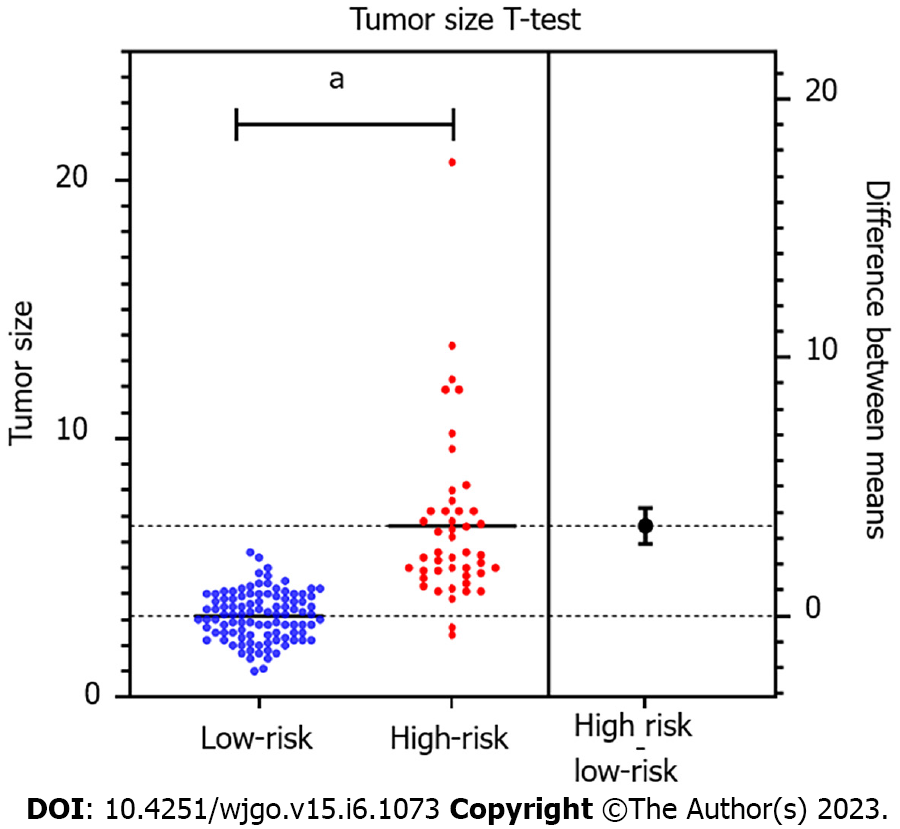
Figure 2 Independent sample t-test estimation chart.
aP < 0.0001.
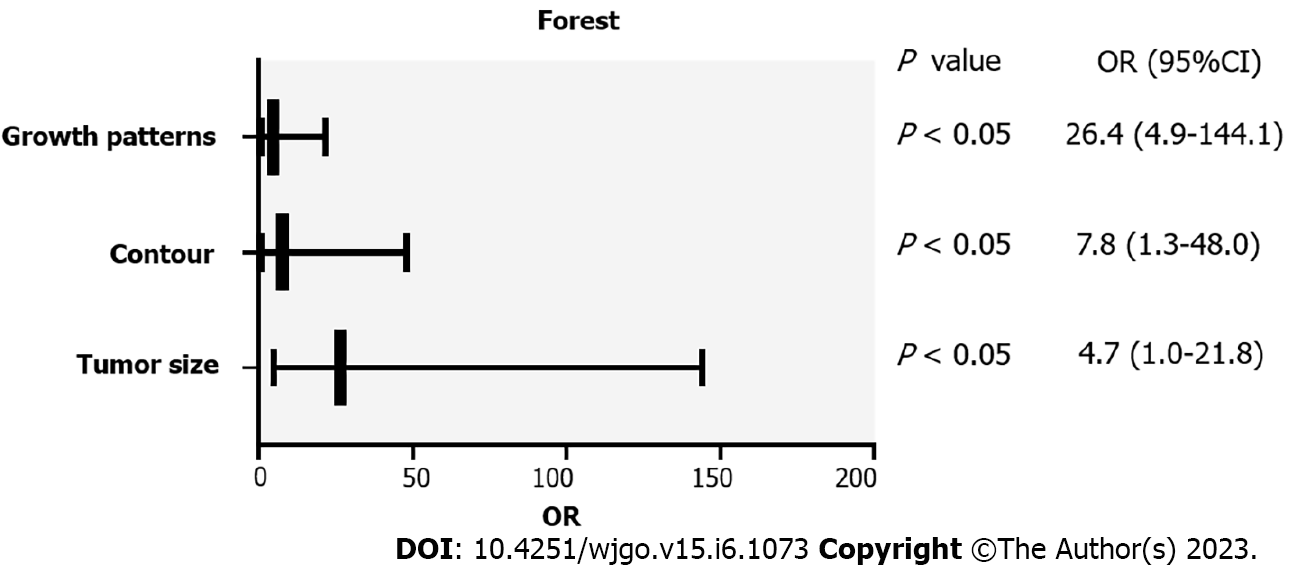
Figure 3 Forest plot of the independent computed tomography features of gastric gastrointestinal stromal tumor with high malignant potential.
OR: Odds ratio; CI: Confidence interval.
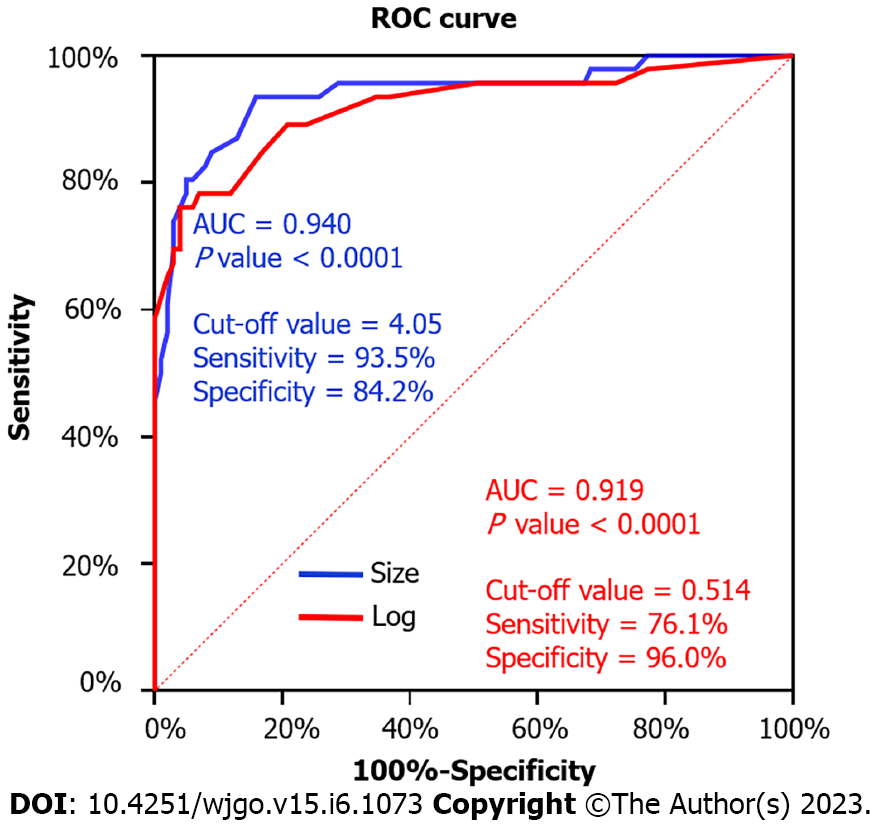
Figure 4 Receiver operating curve for tumor size and the multinomial logistic regression model to differentiate high-malignant potential from low-malignant potential gastrointestinal stromal tumor.
ROC: Receiver operating curve; AUC: Area under the curve.
- Citation: Wang TT, Liu WW, Liu XH, Gao RJ, Zhu CY, Wang Q, Zhao LP, Fan XM, Li J. Relationship between multi-slice computed tomography features and pathological risk stratification assessment in gastric gastrointestinal stromal tumors. World J Gastrointest Oncol 2023; 15(6): 1073-1085
- URL: https://www.wjgnet.com/1948-5204/full/v15/i6/1073.htm
- DOI: https://dx.doi.org/10.4251/wjgo.v15.i6.1073


