Copyright
©The Author(s) 2017.
World J Gastrointest Endosc. Jul 16, 2017; 9(7): 310-318
Published online Jul 16, 2017. doi: 10.4253/wjge.v9.i7.310
Published online Jul 16, 2017. doi: 10.4253/wjge.v9.i7.310
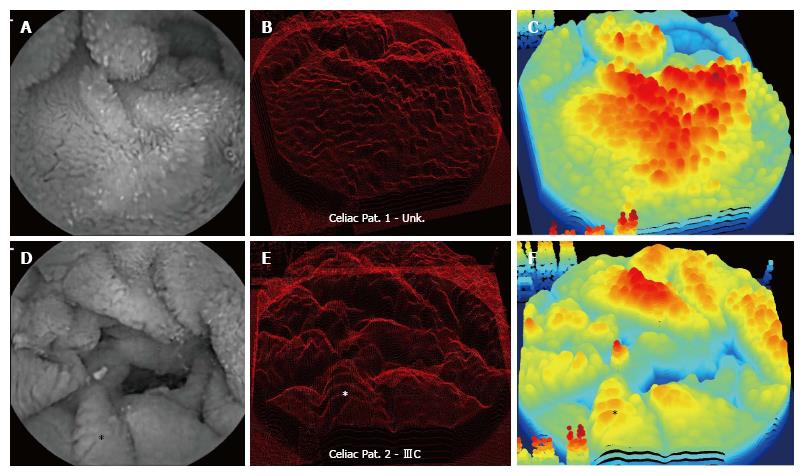
Figure 1 Celiac patient images.
A-C: Patient 1; D-F: Patient 2; A, D: The grayscale endoscopic images; B, E: The three-dimensional projections; C, F: Projections in false color. Colors from blue to yellow, orange, and red represent areas with progressively greater amplitude along the Z-axis (vertical axis). Patient 1 did not have a biopsy obtained due to hemophilia but was thought to have a Marsh score IIIC. Patient 2 also had a Marsh score IIIC. Note the prominent protrusions evident in the three-dimensional projections of both patients, and the similar appearance of texture in the original two-dimensional endoscopic images.
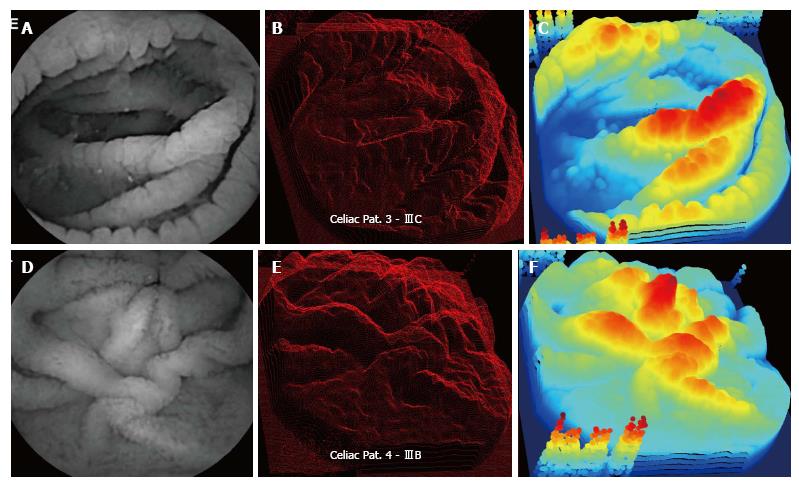
Figure 2 Celiac patient images.
A-C: Patient 3 (Marsh IIIC score); D-F: Patient 4 (Marsh IIIB pathology); A, D: The grayscale endoscopic images; B, E: The three-dimensional projections; C, F: Projections in false color. Colors from blue to yellow, orange, and red represent areas with progressively greater amplitude along the Z-axis (vertical axis). Again note the prominent protrusions evident in the three-dimensional projections of both patients, even though the appearance of texture is somewhat dissimilar in the original two-dimensional endoscopic images.
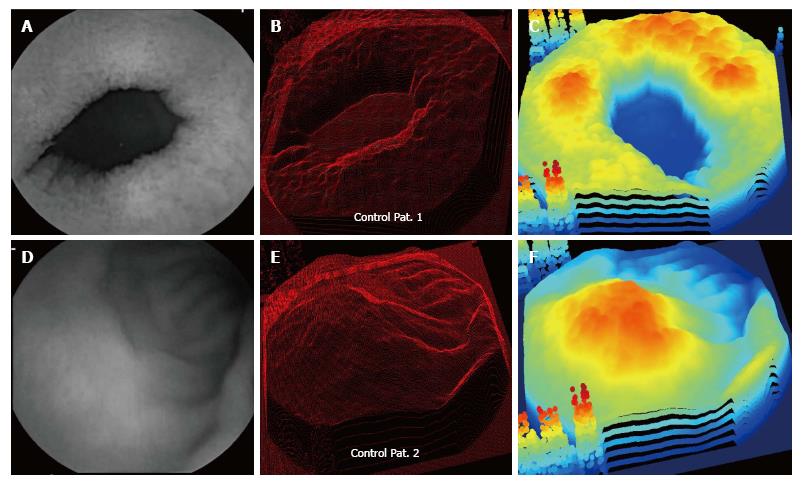
Figure 3 Control patient images.
A-C: Patient 1 (no villous atrophy); D-F: Patient 2 (no villous atrophy); A, D: The grayscale endoscopic images; B, E: The three-dimensional projections; C, F: Projections in false color. Note the lack of prominent protrusions evident in the three-dimensional projections of both patients, even though there is a dissimilar appearance of texture in the original two-dimensional endoscopic images.
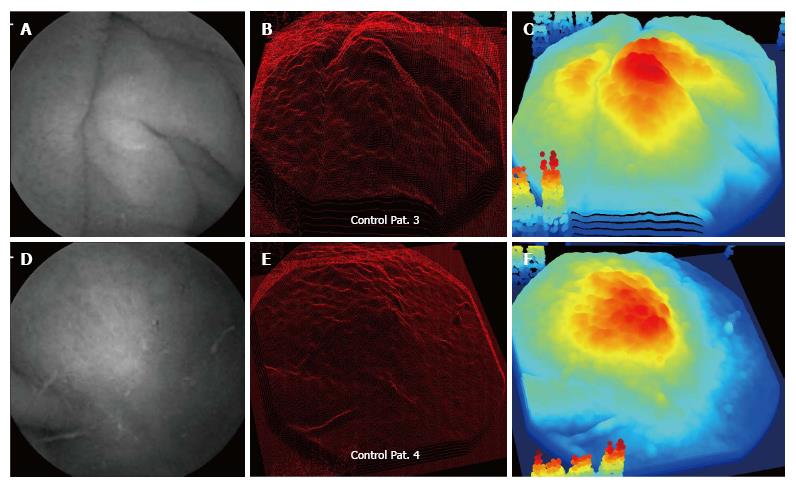
Figure 4 Control patient images.
A-C: Patient 3 (no villous atrophy); D-F: Patient 4 (no villous atrophy); A, D: The grayscale endoscopic images; B, E: The three-dimensional projections; C, F: Projections in false color. Note the lack of prominent protrusions evident in the three-dimensional projections of both patients, even though there is a dissimilar appearance of texture in the original two-dimensional endoscopic images.
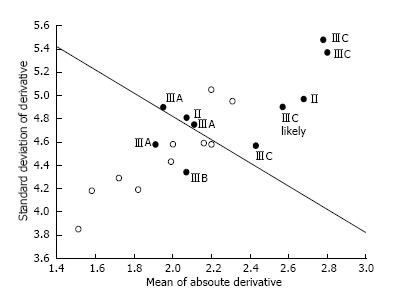
Figure 5 Scatterplot of celiac (black circles) vs control (open circles) patient topographic data.
The ordinate scale gives the standard deviation of the derivative in elevation. The abscissa shows the absolute value of the derivative in elevation. A linear discriminant function mostly separates celiac vs control patient parameter values (black line). Based on the scatterplot, the topography of celiac three-dimensional constructs is typically greater than for controls.
- Citation: Ciaccio EJ, Bhagat G, Lewis SK, Green PH. Use of shape-from-shading to characterize mucosal topography in celiac disease videocapsule images. World J Gastrointest Endosc 2017; 9(7): 310-318
- URL: https://www.wjgnet.com/1948-5190/full/v9/i7/310.htm
- DOI: https://dx.doi.org/10.4253/wjge.v9.i7.310


