Copyright
©The Author(s) 2017.
World J Gastrointest Endosc. Jun 16, 2017; 9(6): 243-254
Published online Jun 16, 2017. doi: 10.4253/wjge.v9.i6.243
Published online Jun 16, 2017. doi: 10.4253/wjge.v9.i6.243
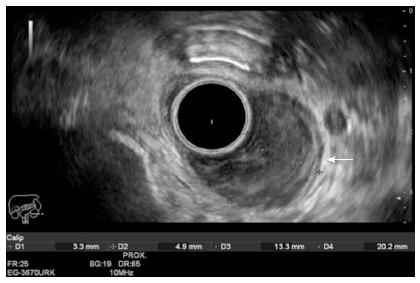
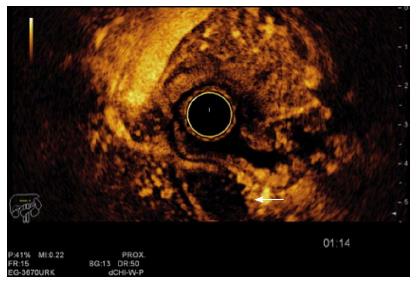
Figure 1 Esophageal carcinoma staging by endoscopic ultrasound T2 N1.
The tumor is being measure (13.3 mm × 20.2 mm). It invades up to the muscularis propria (white arrow). A round, sharply demarcated and hypoechoic lymph node can be seen next to the tumor. EUS images were obtained using a Hitachi-Avius console with a radial scope EG-3630URK (from Pentax Medical). EUS: Endoscopic ultrasound.
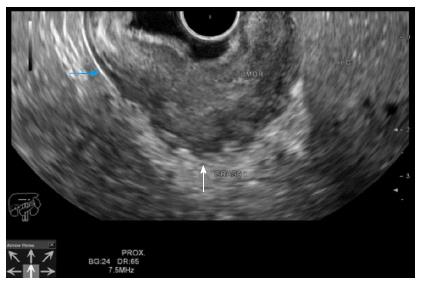
Figure 2 Gastric adenocarcinoma staging by endoscopic ultrasound T3 N0.
The tumor overcomes the muscularis propria (blue arrow) and penetrates the subserosal connective tissue (white arrow). EUS images were obtained using a Hitachi-Avius console with a radial scope EG-3630URK (from Pentax Medical). EUS: Endoscopic ultrasound.
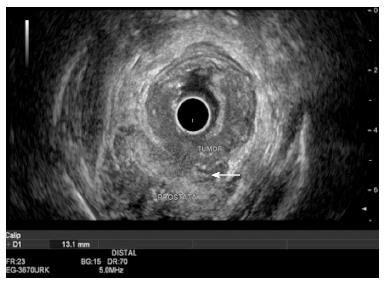
Figure 3 Rectal adenocarcinoma staging by endoscopic ultrasound T4 N0.
The tumor invasion overcomes the rectal wall and penetrates the prostate. There is a lack of separation plane between the tumor and the prostate (white arrow).
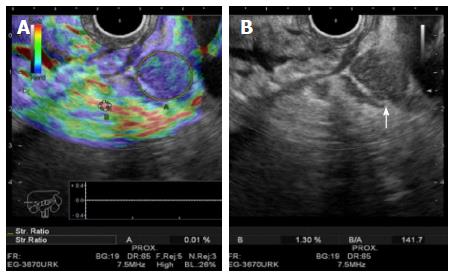
Figure 4 A lymph node being evaluated by elastography, for a gastric tumor staging.
A: Qualitative elastography (color tones red-green-blue) shows the lesion with a blue-predominant color tone, which represents a hard tissue and suggest malignancy. The Strain Ratio (quantitative elastography) is being calculated by compering two different areas (A and B). Area A includes as much of the target lesion as possible. Area B is selected within a soft (red) reference area outside the target lesion. The result (B/A = 141.7) suggests malignancy; B: Shows the round, sharply demarcated and hypoechoic lymph node (white arrow). The endoscopic ultrasound-elastography was done using a Hitachi-Avius console with a radial scope EG-3630URK (from Pentax Medical).
Figure 5 The same lesion presented in Figure 3 being evaluated by contrast enhanced ultrasonography.
The white arrow shows the lymph node with no enhancement after the contrast application, which suggests malignancy. The endoscopic ultrasound-contrast enhancement was done using a Hitachi-Avius console with a radial scope EG-3630URK (from Pentax Medical) and a Sonovue contrast agent (from Bracco).
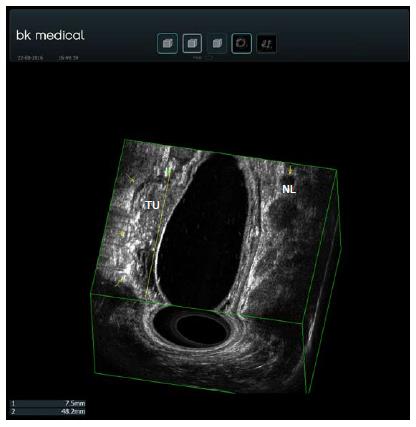
Figure 6 Rectal adenocarcinoma staging by 3D endoscopic ultrasound T1 N1.
The yellow arrows on the left show the muscularis propria. The tumor invades up to the submucosa. A white submucosa plane can be seen between the tumor (TU) and the muscularis propria. The yellow arrow on the right shows a round lymph node. The 3D image was obtained using a transanal rigid probe with an ultrasound from bk medical.
- Citation: Valero M, Robles-Medranda C. Endoscopic ultrasound in oncology: An update of clinical applications in the gastrointestinal tract. World J Gastrointest Endosc 2017; 9(6): 243-254
- URL: https://www.wjgnet.com/1948-5190/full/v9/i6/243.htm
- DOI: https://dx.doi.org/10.4253/wjge.v9.i6.243


