Copyright
©The Author(s) 2017.
World J Gastrointest Endosc. Oct 16, 2017; 9(10): 506-513
Published online Oct 16, 2017. doi: 10.4253/wjge.v9.i10.506
Published online Oct 16, 2017. doi: 10.4253/wjge.v9.i10.506
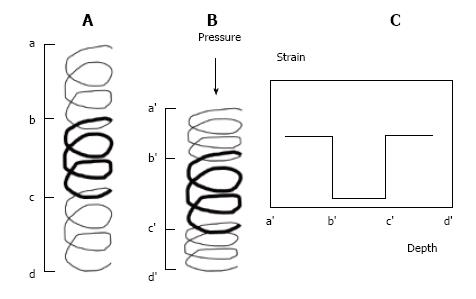
Figure 1 The principle of strain elastography is illustrated by coil spring appearance.
A: After applying pressure, more deformation is demonstrated in tissue with higher elasticity; B: The strain on each tissue depends on the tissue stiffness; C: Higher strain is seen in softer tissue after compression (Adapted from Ophir[2]).
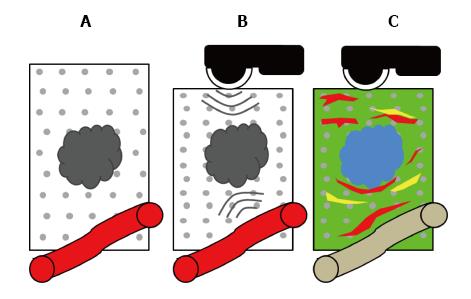
Figure 2 The principle of endoscopic ultrasound elastography for solid pancreatic lesions.
A: Pancreatic carcinoma has more stiffness than normal pancreas; B: The strain elastography measured the degree of displacement after applying manual pressure or vascular pulsation; C: The degree of displacement is represented as colors: Green is the average stiffness, blue is stiffer tissue, and red is softer tissue.
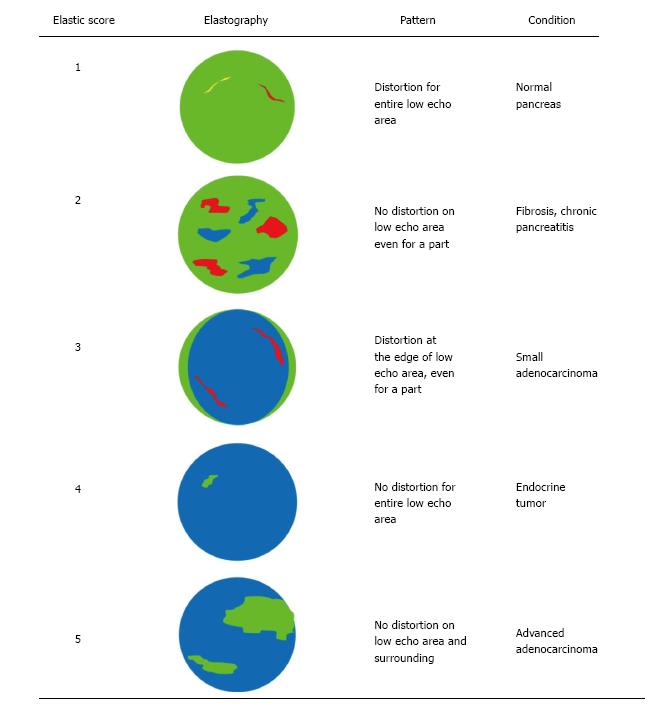
Figure 3 Classification of elastography findings proposed by Giovannini[4].
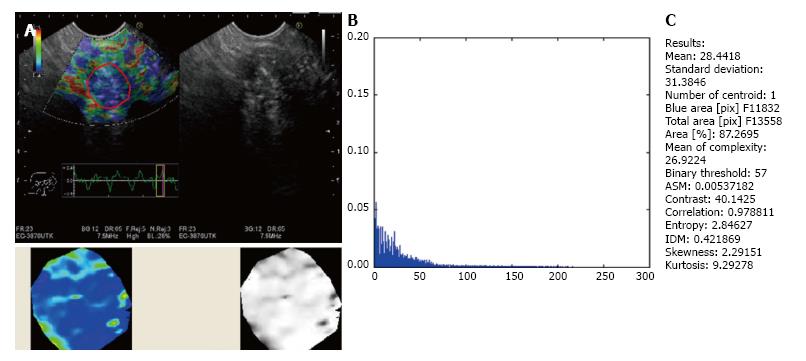
Figure 4 Histogram analysis using MATLABver 1.
6.7. A and B: The color image of the elastography is converted into the gray scale (value) of 256 tones ranging from 0 to 255:0 represents the blue area (hard) and 255 represents the red area (soft); C: The distribution of the gray scale is presented as a histogram from which the parameters are calculated.
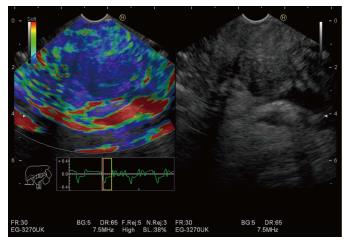
Figure 5 Endoscopic ultrasound elastography of pancreatic adenocarcinoma.
The color pattern showed predominant blue color pattern without distortion of surrounding area.
- Citation: Chantarojanasiri T, Kongkam P. Endoscopic ultrasound elastography for solid pancreatic lesions. World J Gastrointest Endosc 2017; 9(10): 506-513
- URL: https://www.wjgnet.com/1948-5190/full/v9/i10/506.htm
- DOI: https://dx.doi.org/10.4253/wjge.v9.i10.506


