Copyright
©The Author(s) 2015.
World J Gastrointest Endosc. May 16, 2015; 7(5): 555-562
Published online May 16, 2015. doi: 10.4253/wjge.v7.i5.555
Published online May 16, 2015. doi: 10.4253/wjge.v7.i5.555
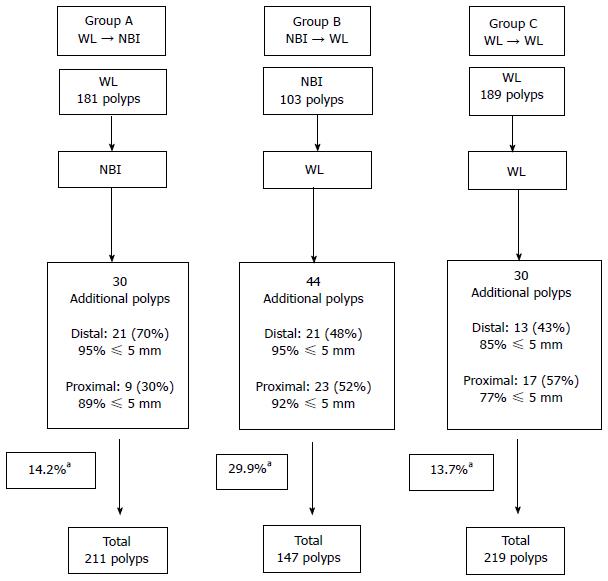
Figure 1 Yield of polyp detection.
aP < 0.05, Group A and Group C vs Group B. WL: White light; NBI: Narrow band imaging.
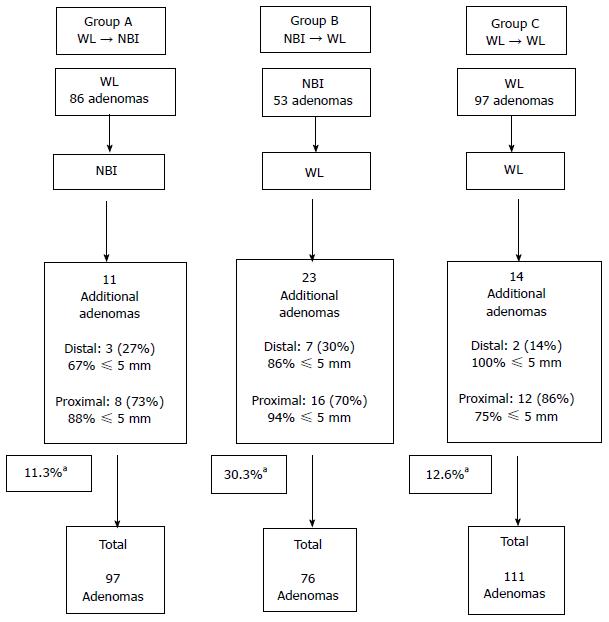
Figure 2 Yield of adenoma detection.
aP < 0.05, Group A and Group C vs Group B. WL: White light; NBI: Narrow band imaging.
- Citation: Gilani N, Stipho S, Panetta JD, Petre S, Young MA, Ramirez FC. Polyp detection rates using magnification with narrow band imaging and white light. World J Gastrointest Endosc 2015; 7(5): 555-562
- URL: https://www.wjgnet.com/1948-5190/full/v7/i5/555.htm
- DOI: https://dx.doi.org/10.4253/wjge.v7.i5.555


