Copyright
©The Author(s) 2015.
World J Gastrointest Endosc. Nov 10, 2015; 7(16): 1222-1229
Published online Nov 10, 2015. doi: 10.4253/wjge.v7.i16.1222
Published online Nov 10, 2015. doi: 10.4253/wjge.v7.i16.1222
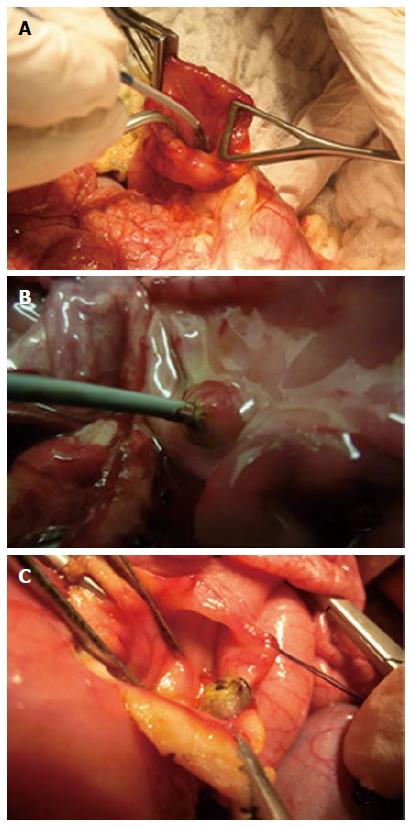
Figure 1 Radiofrequency ablation on the ampulla of Vater.
A: The introduction of the probe (pig #3); B: The early mucosal changes visible during radiofrequency procedure (pig #2); C: Features of early and excessive tissue damage after probe withdrawal (pig #1).
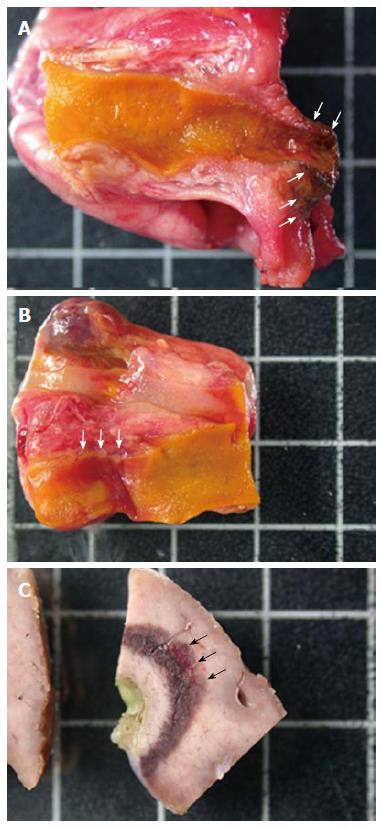
Figure 2 Macroscopic findings on the bile tract after radiofrequency ablation in pig #2.
A: The papillary region and distal common bile duct, with tissue damage reaching the duodenal wall (arrows); B: An ablated zone limited to the wall of the common bile duct (arrows); C: An example of intrahepatic parenchymal damage up to 4 mm away from the bile ducts (arrows).
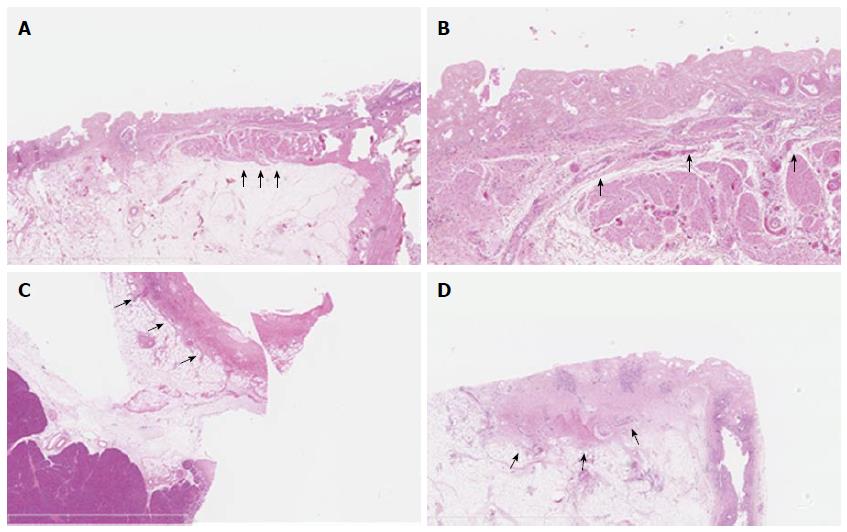
Figure 3 Histological findings in the three ampullae Vaterii treated by radiofrequency ablation.
A: Taken from pig #3, shows satisfying ablation of the ampulla of Vater sparing the submucosa; arrows indicate the intact submucosa; hematoxylin eosin and saffron, original magnification × 25; B: The vertical extension of tissue damage in pig #1, reaching the muscularis mucosae; arrows indicate the muscularis mucosae; hematoxylin eosin saffron, original magnification × 100; C and D: The ampullae of pigs #1 and 2 (respectively), with deep tissue necrosis extending far beyond the muscularis propria up to the adipose tissue; arrows indicate the extent of coagulation necrosis; hematoxylin eosin and saffron, original magnification × 25.
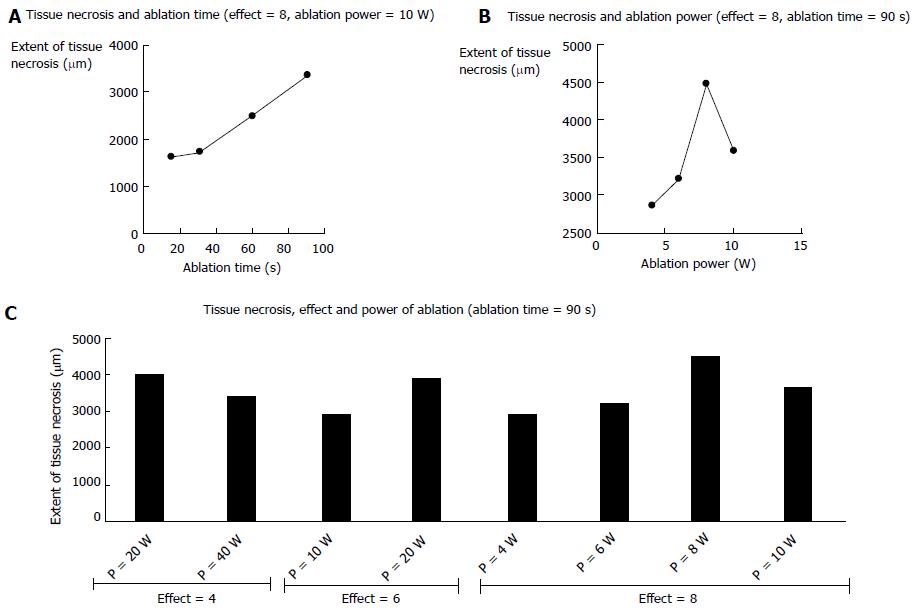
Figure 4 Variation of the extent in depth of thermal tissue damage after radiofrequency ablation in the liver according to electrical settings (VIO 300D).
A: Variation of depth with shot duration; B: Variation of depth with power output setting; C: Variation of depth with effect.
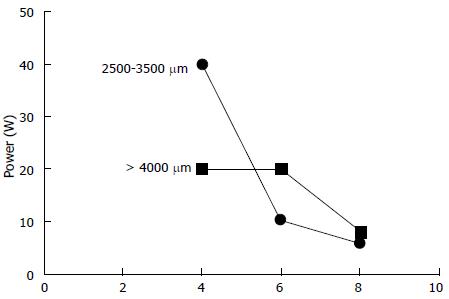
Figure 5 Relative variation of power output and effect setting for a given depth of tissue ablation and a 90 s ablation time in the liver.
- Citation: Barret M, Leblanc S, Vienne A, Rouquette A, Beuvon F, Chaussade S, Prat F. Optimization of the generator settings for endobiliary radiofrequency ablation. World J Gastrointest Endosc 2015; 7(16): 1222-1229
- URL: https://www.wjgnet.com/1948-5190/full/v7/i16/1222.htm
- DOI: https://dx.doi.org/10.4253/wjge.v7.i16.1222


