Copyright
©2013 Baishideng Publishing Group Co.
World J Gastrointest Endosc. Nov 16, 2013; 5(11): 540-550
Published online Nov 16, 2013. doi: 10.4253/wjge.v5.i11.540
Published online Nov 16, 2013. doi: 10.4253/wjge.v5.i11.540
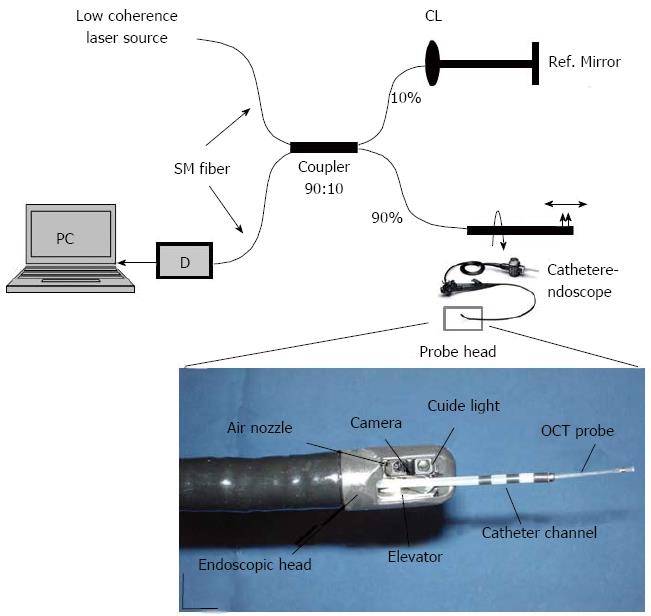
Figure 1 Schematic diagram of an endoscopic optical coherence tomography system.
The endoscopic probe is connected to the sample arm (Color online). Light generated from a low coherence laser source spits into two parts, the sample arm and reference arm. Both back-reflected lights from sample and reference arms recombine in a fiber coupler (10:90). If both back-reflected reference and sample light travels the same distance (optical) then interference will occur and the interference signal will fed to a detector (D). Magnified region of interest in the second image is the endoscopic probe head, consisting primarily of an optical fiber (OCT probe), catheter channel, elevator, video camera and aiming light[55]. Scale bar: 10 mm.
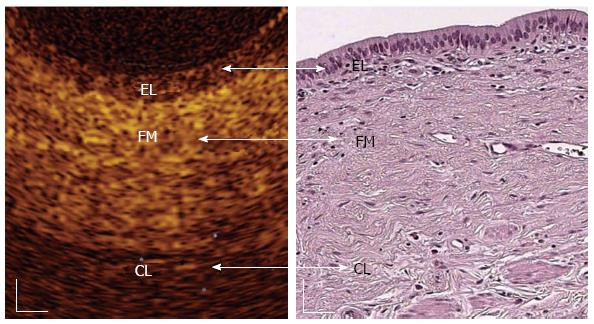
Figure 2 In vivo optical coherence tomography image of a normal common bile duct wall.
Three recognizable layers were observed from the surface of the duct to a depth of 1 mm (Color online). The inner single layer of epithelial (EL) cells (400-600 μm thick) is visible as a superficial, hypo-reflective layer. The intermediate connective fibro-muscular (FM) layer surrounding the epithelium is visible as a hyper-reflective layer (350-480 μm thick) and the outer connective layer (CL) is visible as a hypo-reflective layer with longitudinal relatively hyper-reflective strips (smooth muscle fibers)[58]. White scale bar: 150 μm.
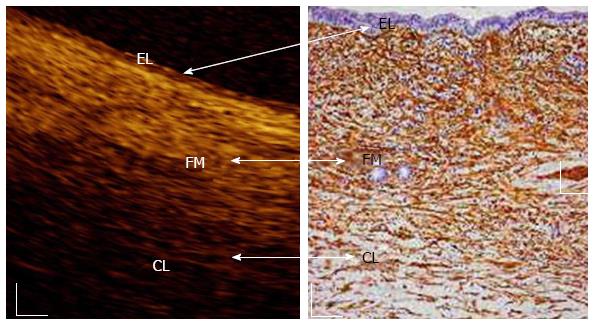
Figure 3 In vivo optical coherence tomography image of a normal main pancreatic duct wall compared with histology.
Three recognizable layers were observed from the surface of the duct to a depth of 1 mm (Color online). The inner single layer of epithelial (EL) cells (400-800 μm thick) is visible as a superficial, hypo-reflective layer. The intermediate, connective fibro-muscular (FM) layer surrounding the epithelium, is visible as a hyper-reflective layer (350-600 μm thick). The outer connective-acinar (CL) structure close to the ductal wall epithelium is visible as a hypo-reflective layer[58]. White scale bar: 150 μm (right image).
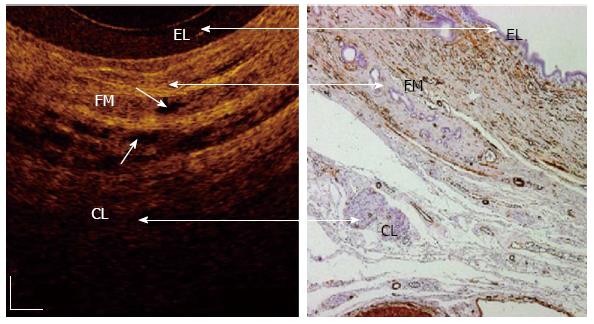
Figure 4 In vivo optical coherence tomography image of a normal sphincter of Oddi wall.
Three recognizable layers were observed from the surface of the duct to a depth of 1 mm (Color online). The inner single layers of epithelial (EL) cells are visible as a superficial, hypo-reflective layer (400-800 μm thick). The intermediate connective-muscular (FM) layer surrounding the epithelium is visible as a hyper-reflective layer (250-400 μm thick). The outer connective layer (CL) is visible as a hypo-reflective layer with longitudinal relatively hyper-reflective strips (smooth muscle fibers). Within intermediate and outer layer, vessels could be visualized (marked with arrows) as nonreflecting areas. The boundaries between the intermediate and outer layers are not clearly recognizable due to irregular distribution of the connective and muscular structure[59]. White scale bar: 150 μm.
Figure 5 Magnified optical coherence tomography images.
A: Sections with normal main pancreatic duct (MPD) wall; B: The presence of chronic pancreatitis; C: Low-grade dysplasia; D: Adenocarcinoma. Three differentiated layer architecture with a linear, regular surface, and a homogeneous back-scattered signal from each of the layer was observed in the normal condition. In the presence of chronic pancreatitis the optical coherence tomography (OCT) image still showed three-layer architecture, however, the inner epithelial layer appeared slightly larger than normal and the intermediate layer appeared more hyper-reflective; probably due to the presence of the dense mononuclear cell infiltrate. In the presence of dysplasia, OCT image showed thickened, strongly hypo-reflective and hetero-geneous inner MPD layer. Irregular surfaces were observed in the whole MPD structure. None of these layers were recognizable in the presence of adenocarcinoma[66]. Scale bar: 200 μm (Color online).
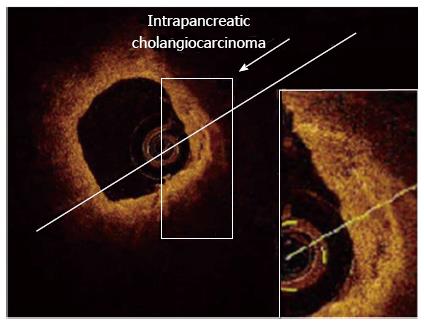
Figure 6 Adenocarcinoma (neoplasia) of the common bile duct at early stage, detected with optical coherence tomography probe maintained inside the endoscopic retrograde cholangiopancheatography catheter.
In the presence of Adenocarcinoma (neoplasia), optical coherence tomography (OCT) patterns showed distorted common bile duct (CBD) wall structure (Color online). All three-layer architecture and their linear and regular surface, normally giving a homogeneous back-scattered signal, are not recognizable. OCT image shows heterogeneous back-scattered signal with minute, multiple, nonreflective areas (necrotic areas) in the highly disorganized CBD microstructure. Therefore, epithelial structure and various biliary disorders in early-stage of cancer can be distinguishable with OCT[67].
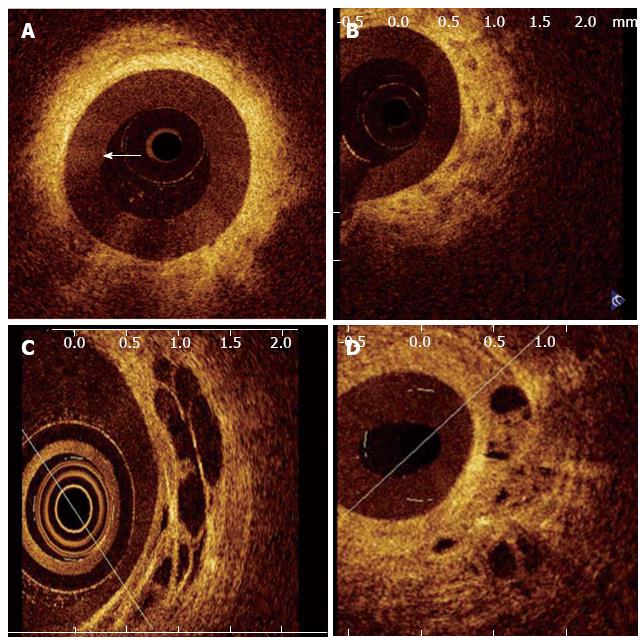
Figure 7 Optical coherence tomography image of a patient with a benign stricture.
The three-layered structure of the biliary wall is recognizable (Color online). A-D shows images of malignant bile duct strictures. B: Disorganized layered structure with unidentifiable margins and a strongly heterogeneous back-scattering signal; C: Large, nonreflective areas in the intermediate layer suggesting the tumor vessels; D: Malignant stricture due to hilar metastases of an esophageal squamous carcinoma showing nonreflective areas and disorganized layer architecture[2].
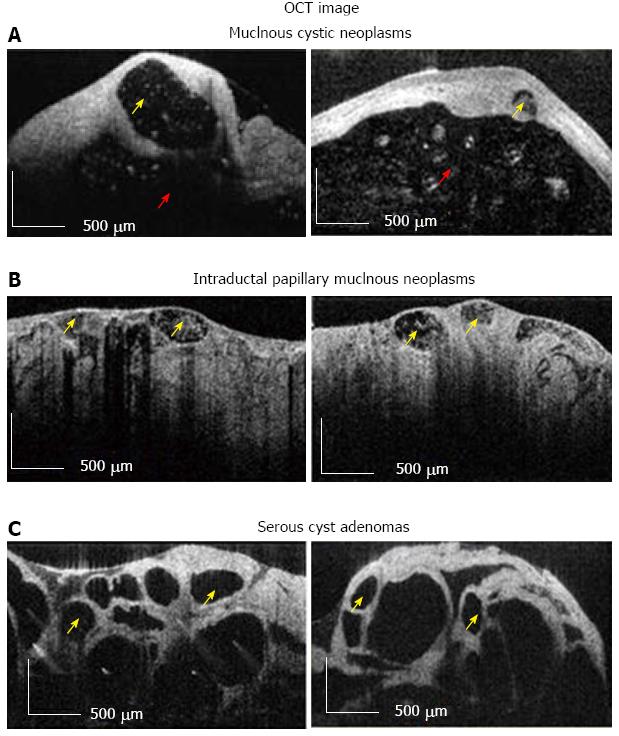
Figure 8 Optical coherence tomography image.
A, B: Diagnostic criteria for high-risk (i.e., Mucinous Cystic Neoplasms, Intraductal Papillary Mucinous Neoplasms); C: Low risk (i.e., Serous Cysts Adenomas) pancreatic cysts. Multiple small cysts are marked with yellow arrow, while surrounded main cystic cavity is marked with red arrow. Scale bar = 500 μm[69]. OCT: Optical coherence tomography.
- Citation: Mahmud MS, May GR, Kamal MM, Khwaja AS, Sun C, Vitkin A, Yang VX. Imaging pancreatobiliary ductal system with optical coherence tomography: A review. World J Gastrointest Endosc 2013; 5(11): 540-550
- URL: https://www.wjgnet.com/1948-5190/full/v5/i11/540.htm
- DOI: https://dx.doi.org/10.4253/wjge.v5.i11.540


