Copyright
©2012 Baishideng.
World J Gastrointest Endosc. Sep 16, 2012; 4(9): 387-397
Published online Sep 16, 2012. doi: 10.4253/wjge.v4.i9.387
Published online Sep 16, 2012. doi: 10.4253/wjge.v4.i9.387
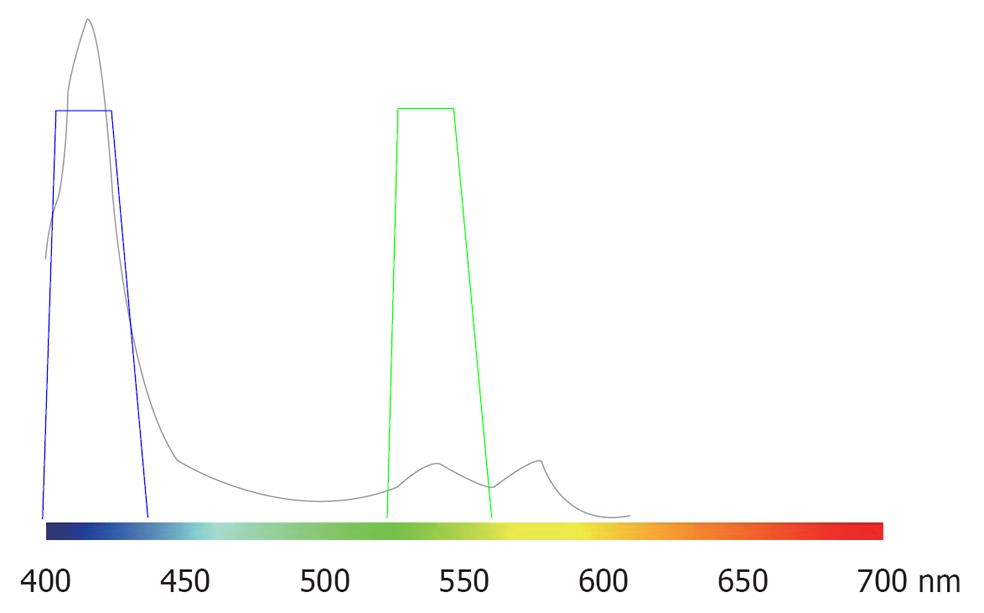
Figure 1 Light wavelength-related differences in hemoglobin absorption (hemoglobin absorption curve).
The transverse axis indicates the wavelength of visible light. The longitudinal axis indicates the absorption coefficient. The curve represents the relationship between the wavelength and hemoglobin absorption coefficient (provided from Olympus).
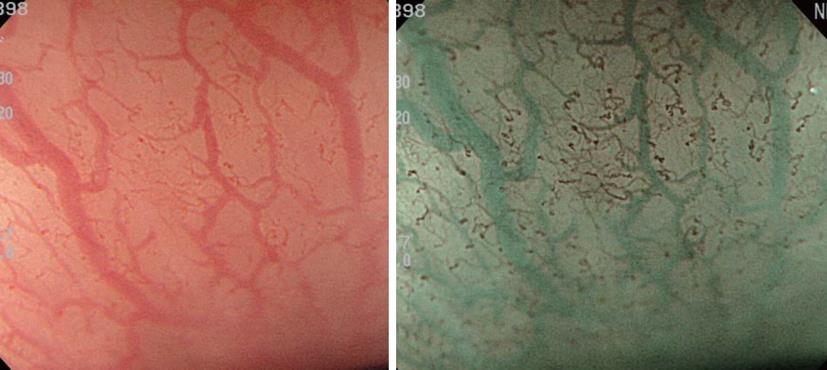
Figure 2 Basic effects of narrow band imaging (white light and narrow band imaging).
Figure 3 Diagnosis of an esophageal micro-lesion.
A: In the upper esophagus, a flare lesion measuring 4 mm was noted; B: When switching standard endoscopy to narrow band imaging-combined magnifying endoscopy, the lesion could be recognized as a clear brownish area; C: On magnifying endoscopy, a tumorous intra-epithelial papillary capillary loop pattern was visualized.
Figure 4 The development of narrow band imaging facilitated the visual observation of intra-epithelial papillary capillary loop, revolutionizing the diagnosis of the depth.
A: Findings of narrow band imaging-combined magnifying observation of a lesion diagnosed as M2 after endoscopic submucosal dissection (ESD). Dilated and curving intra-epithelial papillary capillary loop (IPCL) with an irregular width extending in a transverse direction; B: Findings of narrow band imaging-combined magnifying observation of a lesion diagnosed as M3 after ESD. IPCL was severely damaged , and a connection with the adjacent IPCL was also observed.
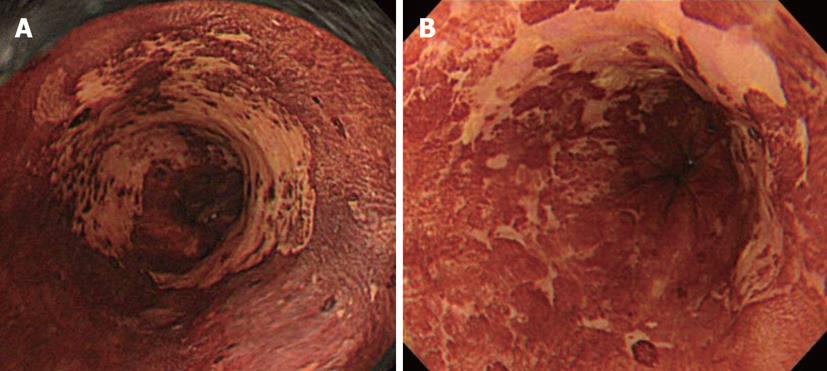
Figure 5 Lugol spray-induced morphological changes in lesions.
A: A 4/5 circumferential zone unstained with Lugol was observed on the left side of the middle thoracic esophagus; B: The lesion shown in A, 2 wk after Lugol spraying. The morphology and size of the unstained zone changed.
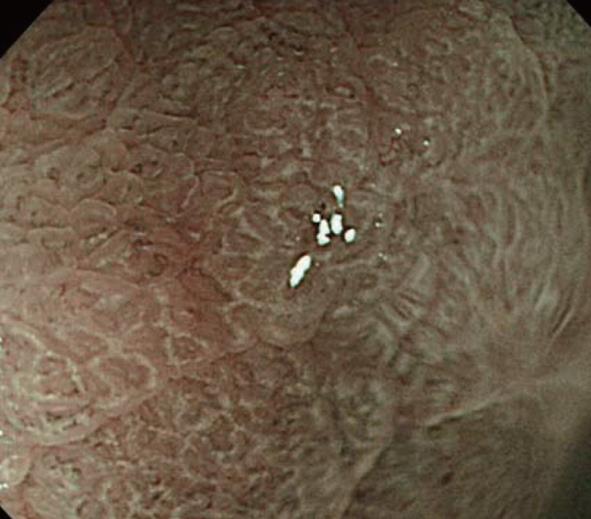
Figure 6 Marginal crypt epithelium.
Coil-like subepithelial capillaries were visualized as brown areas, and the peripheral, multi-angle marginal crypt epithelium as a white area.
Figure 7 White opaque substance.
Magnifying endoscopy findings with narrow band imaging within an adenoma of the superficial elevated type. The subepithelial microvessels cannot be visualized because a dense white opaque substance obscuring the subepithelial microvessels.
Figure 8 Light blue crest.
A light blue crest was observed along the marginal crypt epithelium surface.
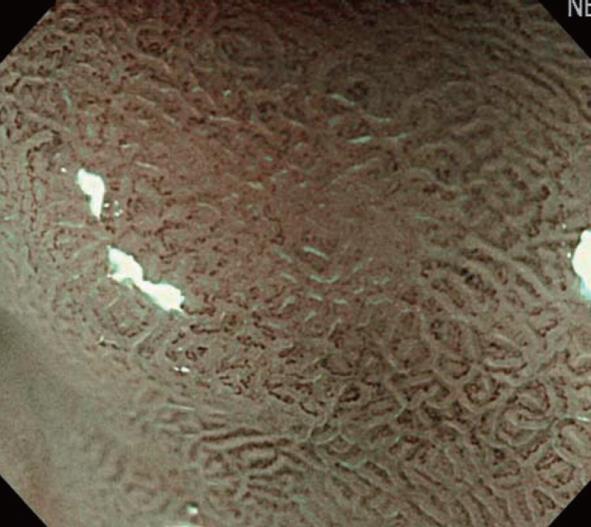
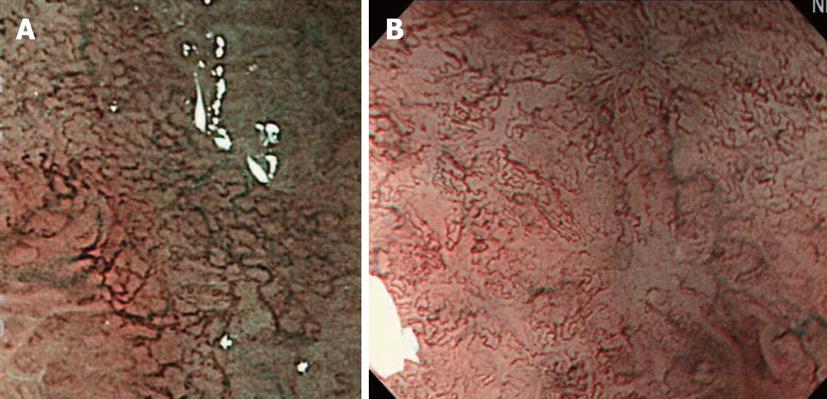
Figure 9 A fine network pattern, a corkscrew pattern.
A: Fine network pattern: microvessels comprising a mesh-like network; B: Corkscrew pattern: isolated, disordered microvessels.
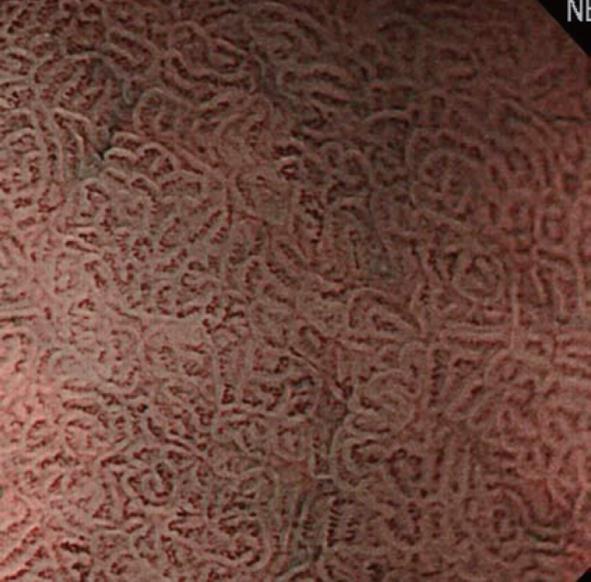
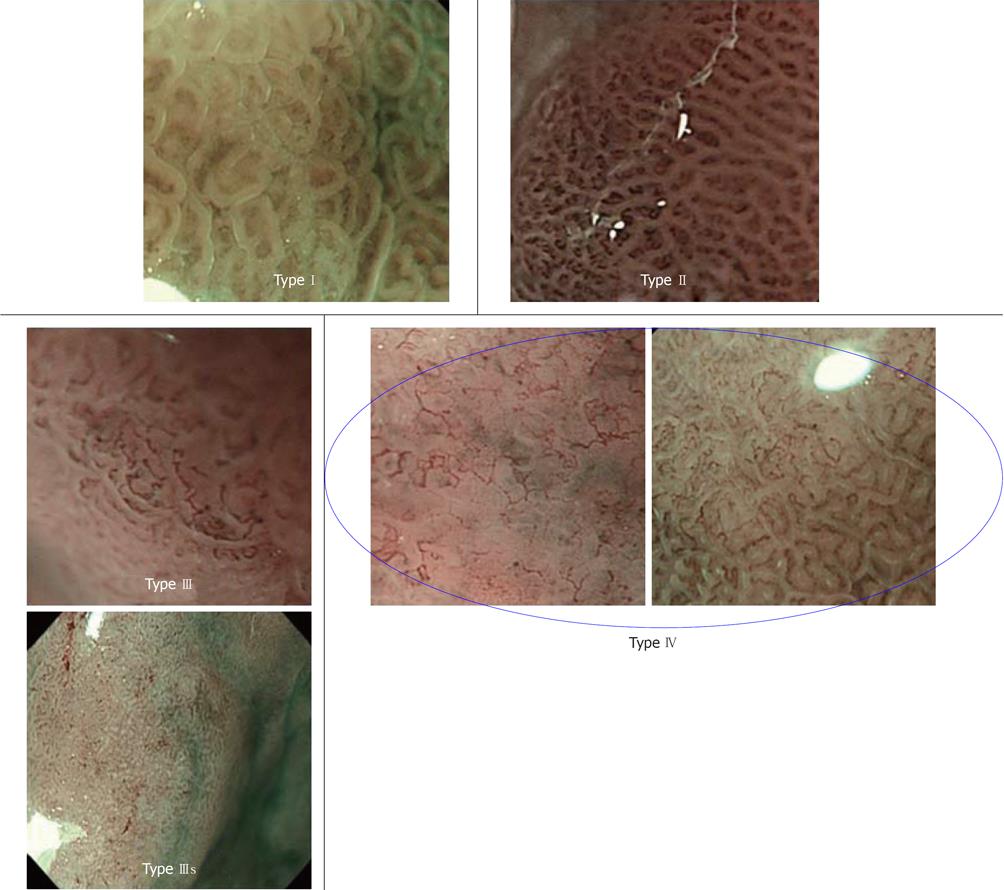
Figure 10 Narrow band imaging typing.
Type I: “Clear” mucosal microstructure and “unclear” microvessel image; Type II: “Clear” mucosal microstructure and “clear” microvessel image; Type III: “Clear” mucosal microstructure and “abnormal” microvessel image; Type IIIs: Very dense arrangement of small glands and “dots” or “unclear” microvessel image; Type IV: “Obscured” mucosal microstructure and “abnormal” microvessel image.
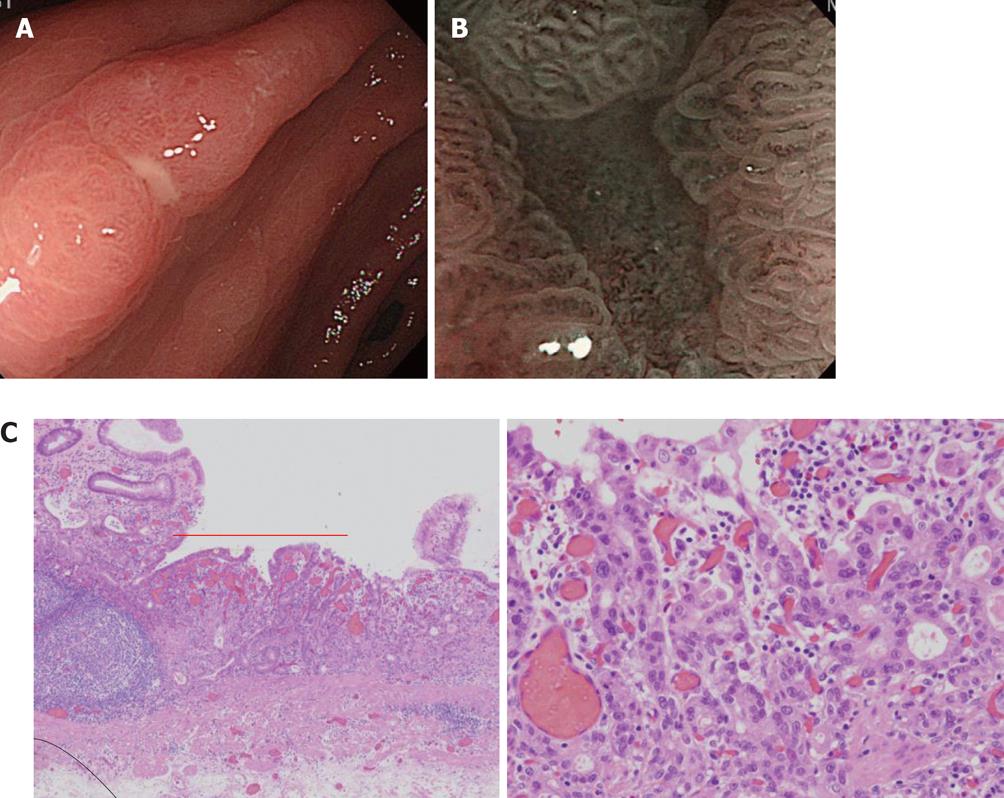
Figure 11 Differentiation of benignity and malignancy of a small depressed lesion.
A: A solitary erosion was present in the antrum on the small curvature side. Differentiation of benignity and malignancy by conventional observation was difficult; B: The gland structure on the erosion surface was apparently different from the surrounding region, and a few abnormal micro blood vessels with an abnormal distribution and irregular width were present in this region; C: The lesion was an intramucosal moderately differentiated adenocarcinoma on pathological examination after endoscopic submucosal dissection. HE, original magnification, × 100 (left), original magnification, × 400 (right).
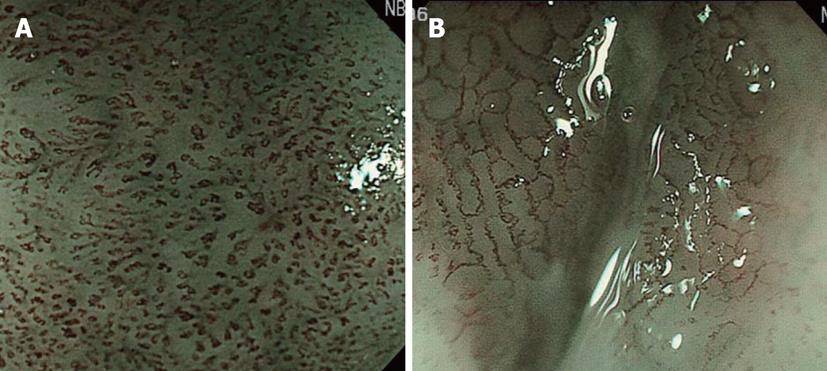
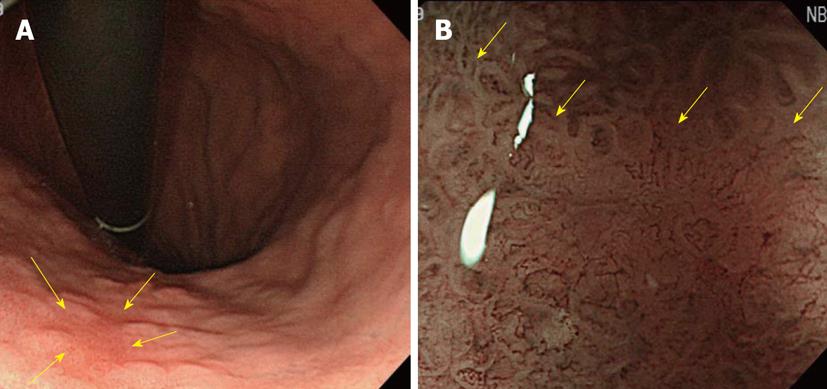
Figure 12 A case of small flat-type differentiated early-stage gastric cancer with an unclear boundary.
A: A small flat-type differentiated early-stage gastric cancer of about 6 mm with an unclear boundary was present in the small curvature of the lower body of the stomach (arrows), but visualization of the lesion by conventional observation was difficult; B: Findings on narrow band imaging-combined magnifying observation: The border between the tumor and non-tumorous region was clearly observed, and apparently abnormal blood vessels were present inside the demarcation line (arrows).
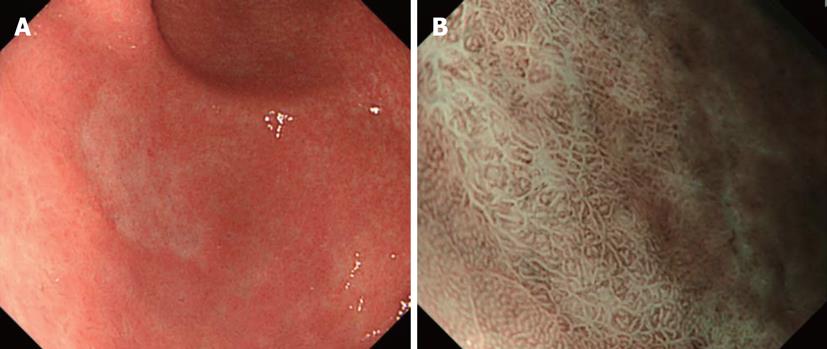
Figure 13 A case of gastric undifferentiated adenocarcinoma.
A: A pale concave lesion was noted in the antrum on the anterior wall side of the greater curvature (undifferentiated cancer was diagnosed by biopsy); B: Findings on narrow band imaging-combined magnifying observation of A: Only swollen intervening parts and increased intervals between the white lines were observed, and there were no abnormal blood vessels. The gland structures in the surrounding normal mucosa appeared different from those of the concave surface.
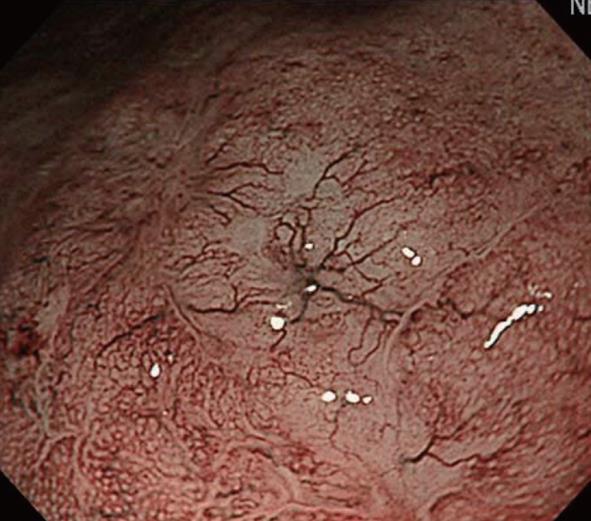
Figure 14 Tree Like appearance.
Images of abnormal blood vessels resembling branches from the trunk of a tree in the shiny mucosa, in which the glandular structure tends to be lost.
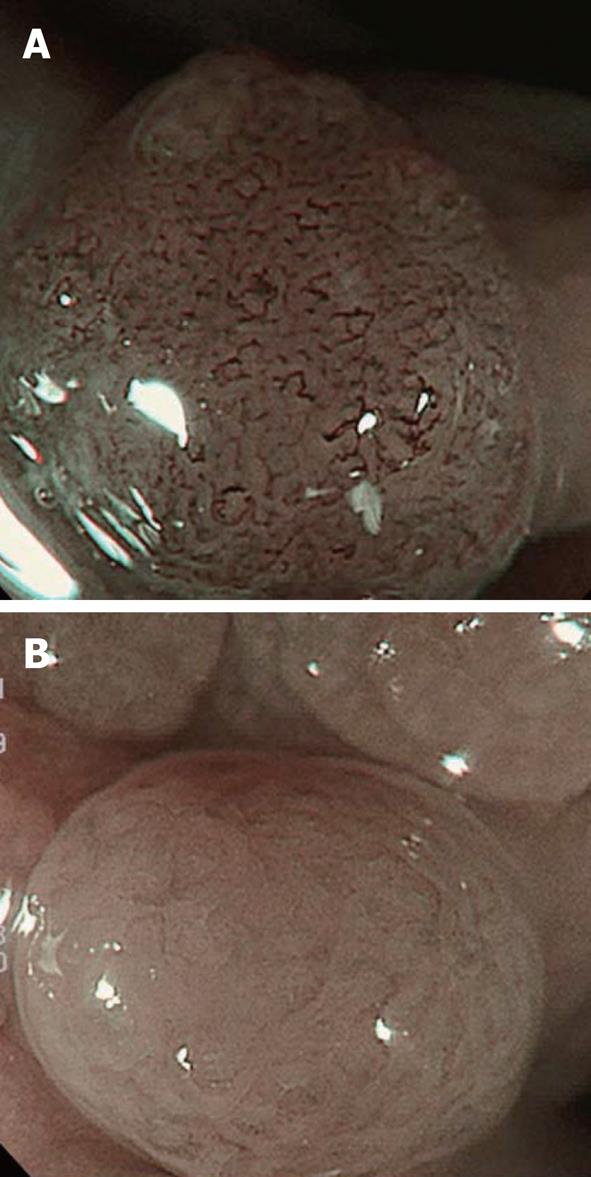
Figure 15 Hyperplastic polyp and adenoma.
A: Hyperplastic polyp: meshed capillary vessels (-); B: Adenoma: meshed capillary vessels (+), capillary vessel surrounding mucosal glands.
- Citation: Nonaka K, Nishimura M, Kita H. Role of narrow band imaging in endoscopic submucosal dissection. World J Gastrointest Endosc 2012; 4(9): 387-397
- URL: https://www.wjgnet.com/1948-5190/full/v4/i9/387.htm
- DOI: https://dx.doi.org/10.4253/wjge.v4.i9.387


