Copyright
©The Author(s) 2019.
World J Gastrointest Endosc. Dec 16, 2019; 11(12): 589-595
Published online Dec 16, 2019. doi: 10.4253/wjge.v11.i12.589
Published online Dec 16, 2019. doi: 10.4253/wjge.v11.i12.589
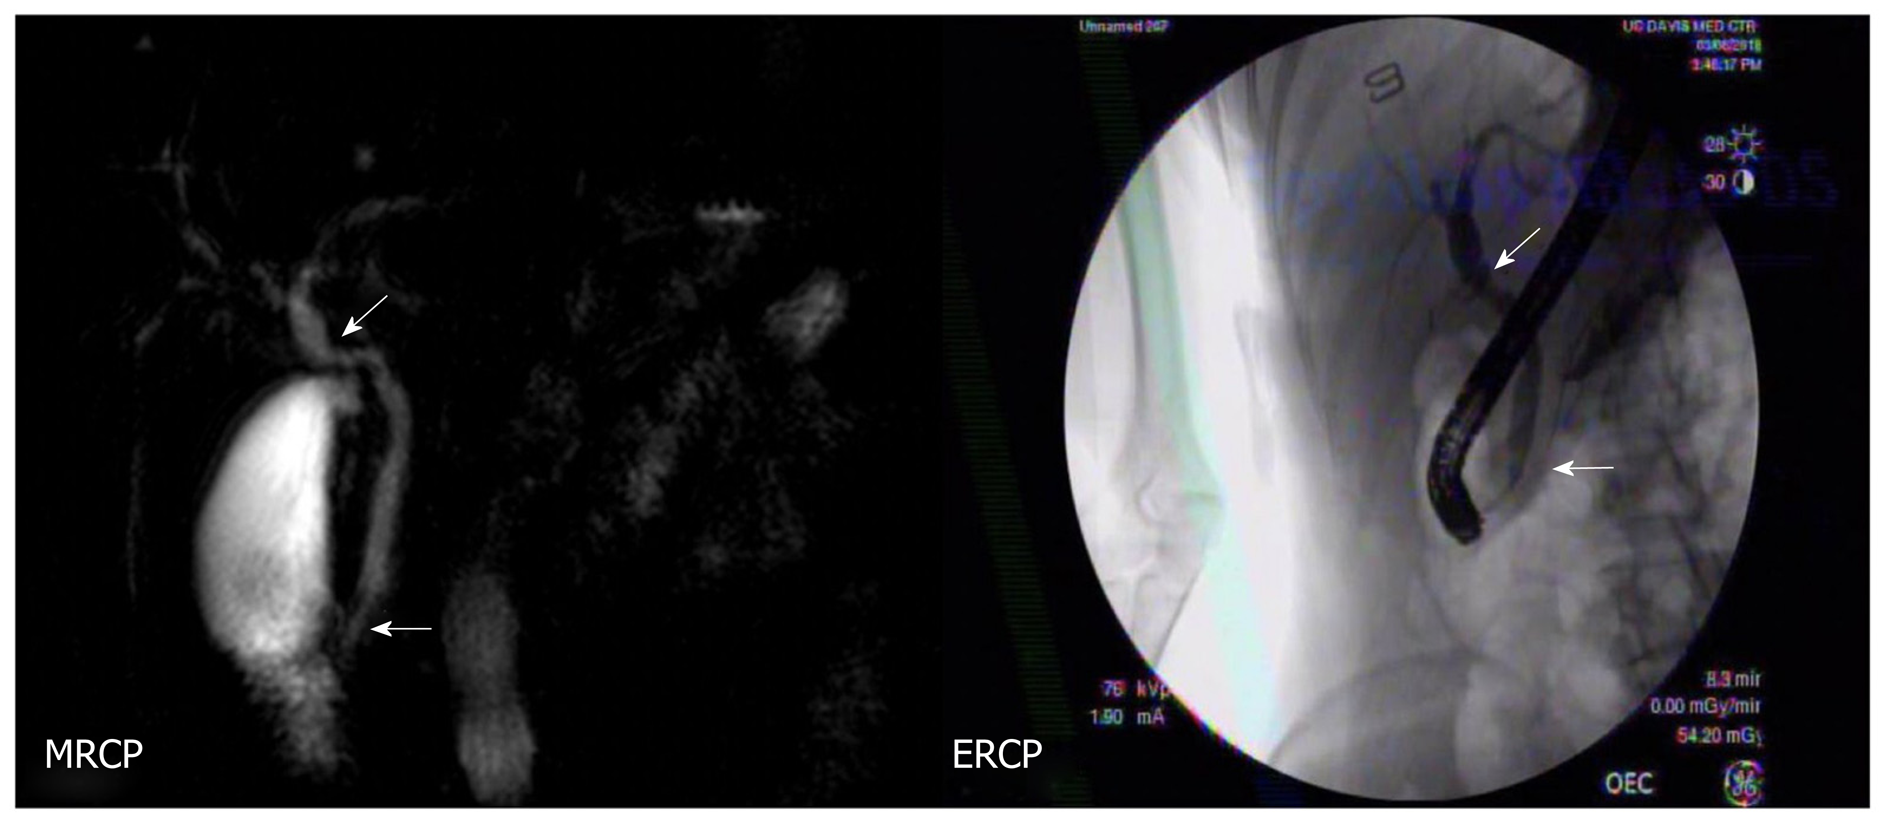
Figure 1 Biliary obstruction, showing mid common hepatic duct and distal common bile duct narrowing (arrows).
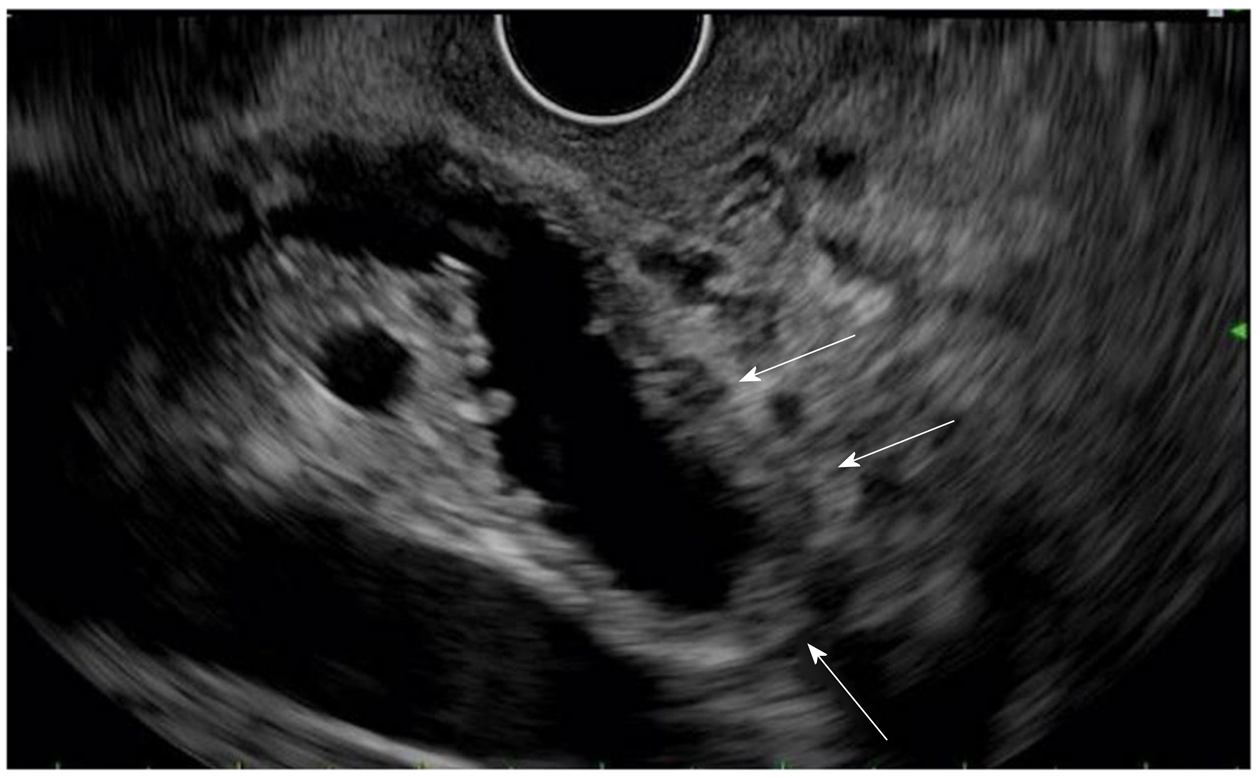
Figure 2 Endoscopic ultrasound showing bile duct wall thickening (arrows).
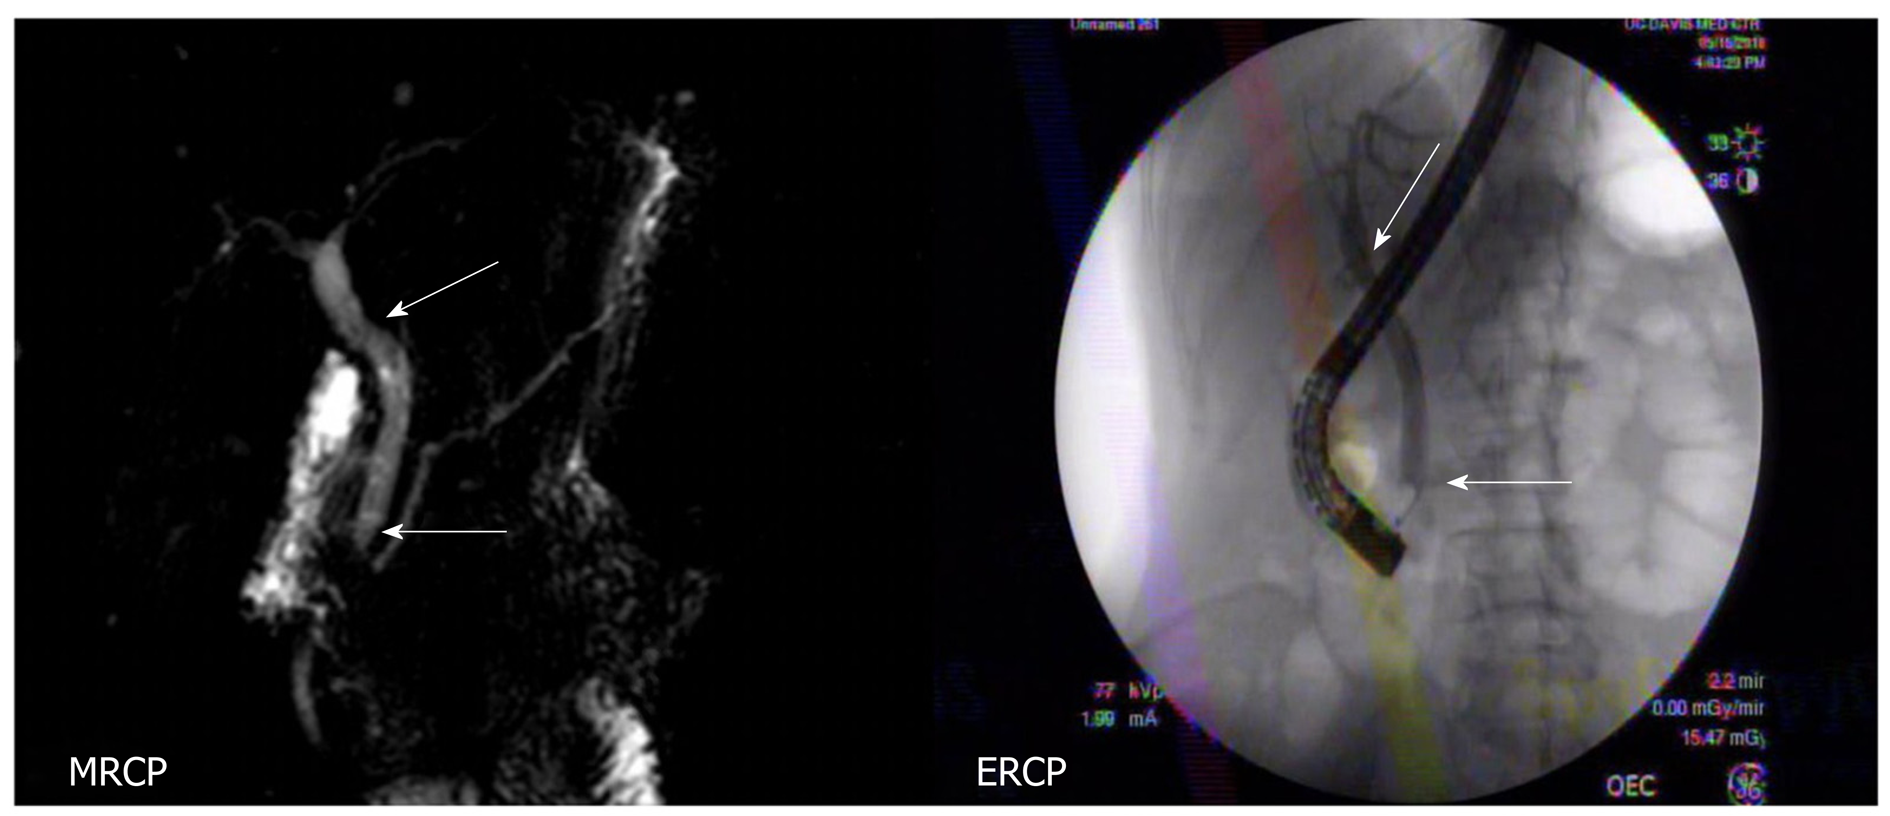
Figure 3 Resolution of biliary ductal narrowing, with resolved strictures (arrows).
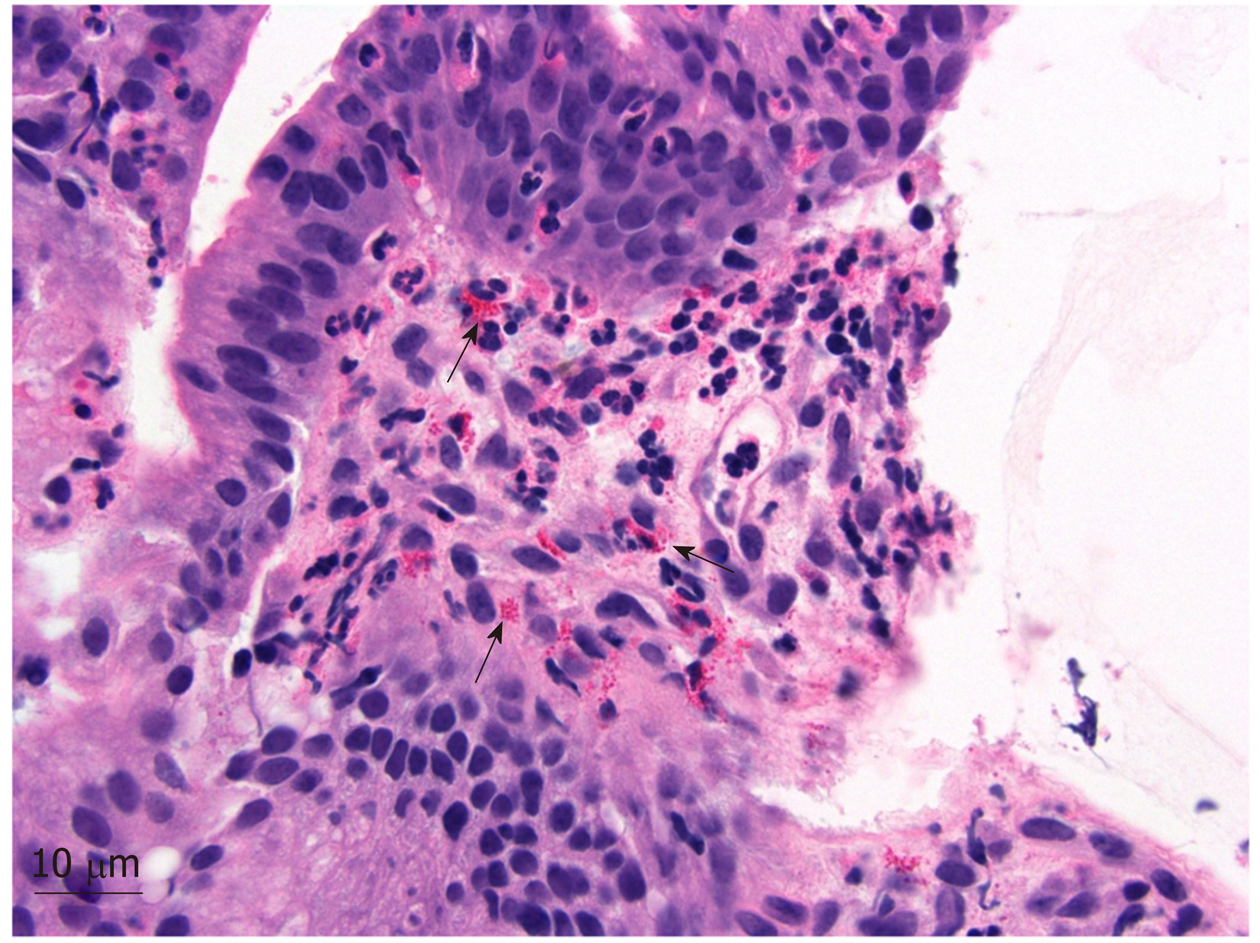
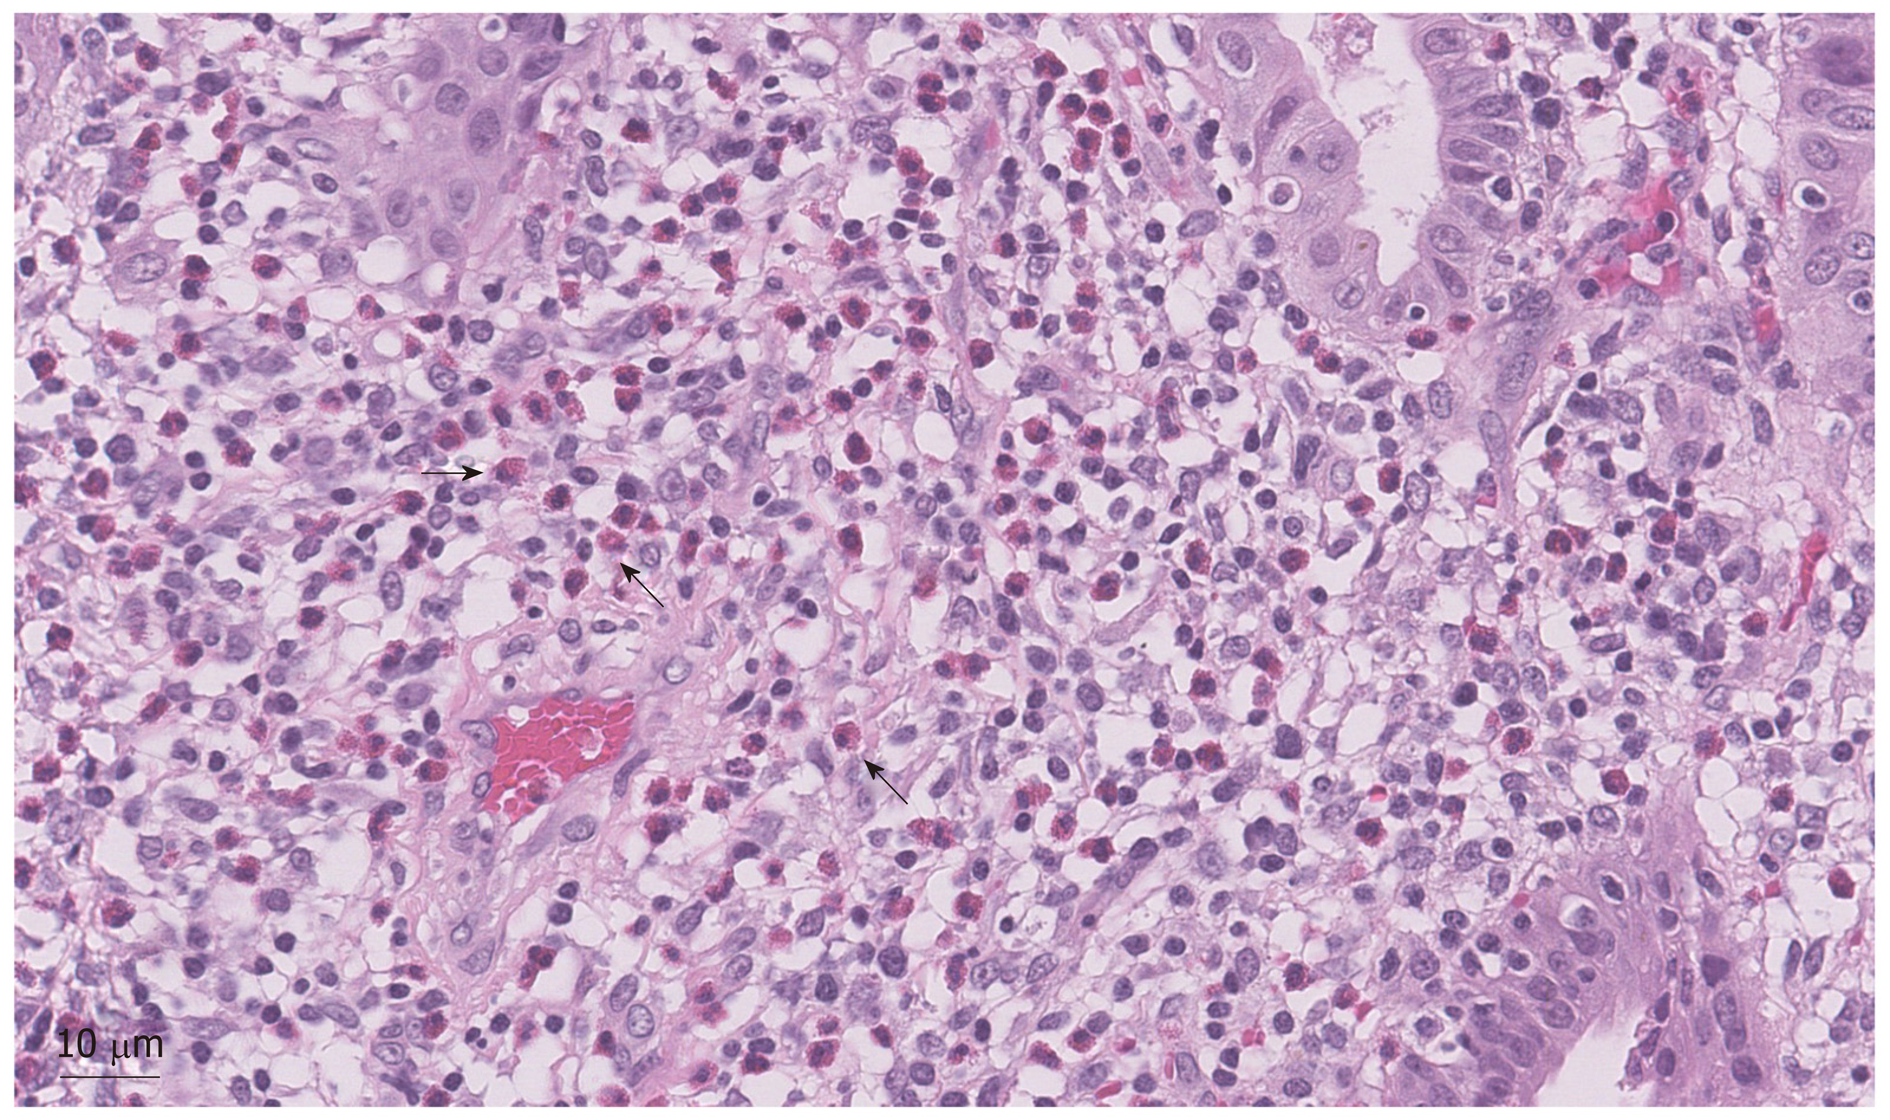
Figure 4 Bile duct specimen with eosinophils (arrows) (× 400).
Figure 5 Gallbladder specimen with eosinophils (arrows) (× 400).
- Citation: Dodda A, Matsukuma K, Urayama S. Eosinophilic cholangitis: A case report of diagnostically challenging eosinophilic infiltrative biliary obstruction. World J Gastrointest Endosc 2019; 11(12): 589-595
- URL: https://www.wjgnet.com/1948-5190/full/v11/i12/589.htm
- DOI: https://dx.doi.org/10.4253/wjge.v11.i12.589


