Copyright
©The Author(s) 2018.
World J Gastrointest Endosc. Sep 16, 2018; 10(9): 200-209
Published online Sep 16, 2018. doi: 10.4253/wjge.v10.i9.200
Published online Sep 16, 2018. doi: 10.4253/wjge.v10.i9.200
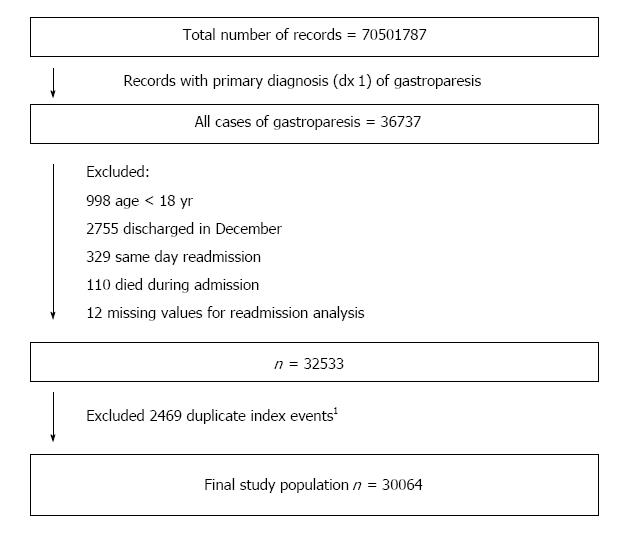
Figure 1 Data selection for Gastroparesis admissions.
1Duplicate index events are records that fit the criteria for index gastroparesis admission, but were also identified as readmissions within 30 d of a previous index gastroparesis admission. These records were not analyzed as a separate index admission, but were included in the readmission analysis.
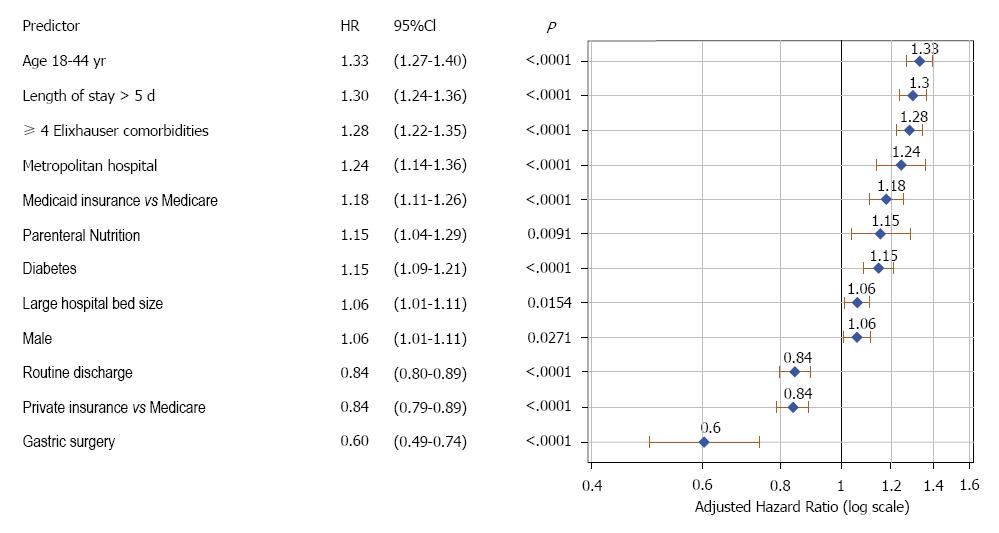
Figure 2 Multivariable proportional hazard analysis of predictors of 30-d readmission in Patients hospitalized with gastroparesis, National Readmission Database, 2010-2014.
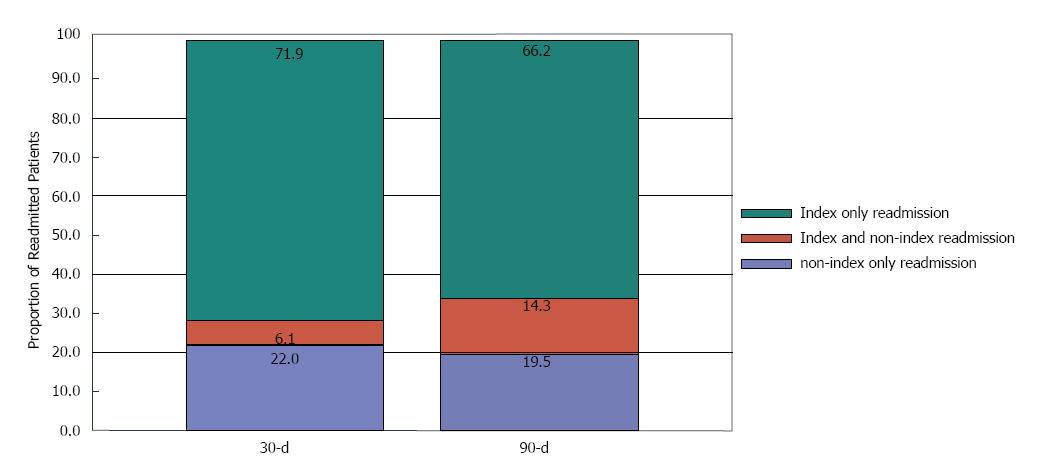
Figure 3 Proportion of 30 and 90-d readmissions to index and non-index hospitals.
Blue represents non-index only readmissions, which is also the percent underestimation of care if only institutional databases are used. Blue and red represent fragmentation of care.
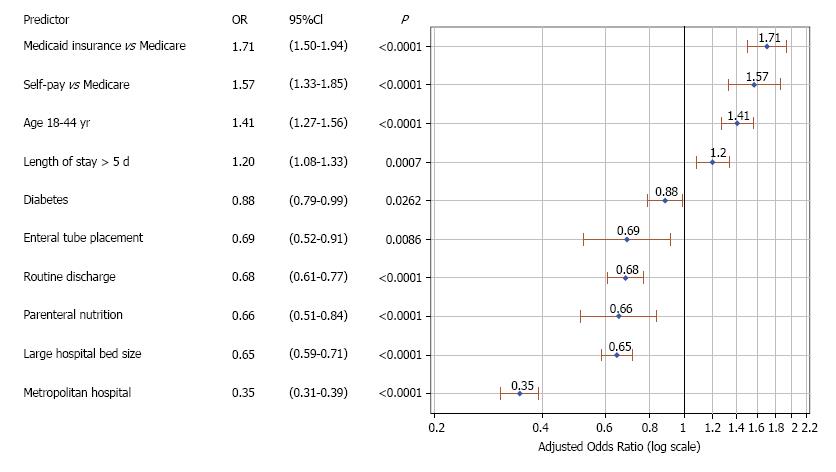
Figure 4 Multivariable logistic regression analysis of predictors of 30-d readmission to non-index hospital (care fragmentation) in patients hospitalized with gastroparesis, National Readmission Database, 2010-2014.
- Citation: Qayed E, Muftah M. Frequency of hospital readmission and care fragmentation in gastroparesis: A nationwide analysis. World J Gastrointest Endosc 2018; 10(9): 200-209
- URL: https://www.wjgnet.com/1948-5190/full/v10/i9/200.htm
- DOI: https://dx.doi.org/10.4253/wjge.v10.i9.200


