Copyright
©The Author(s) 2018.
World J Gastrointest Endosc. Dec 16, 2018; 10(12): 422-441
Published online Dec 16, 2018. doi: 10.4253/wjge.v10.i12.422
Published online Dec 16, 2018. doi: 10.4253/wjge.v10.i12.422
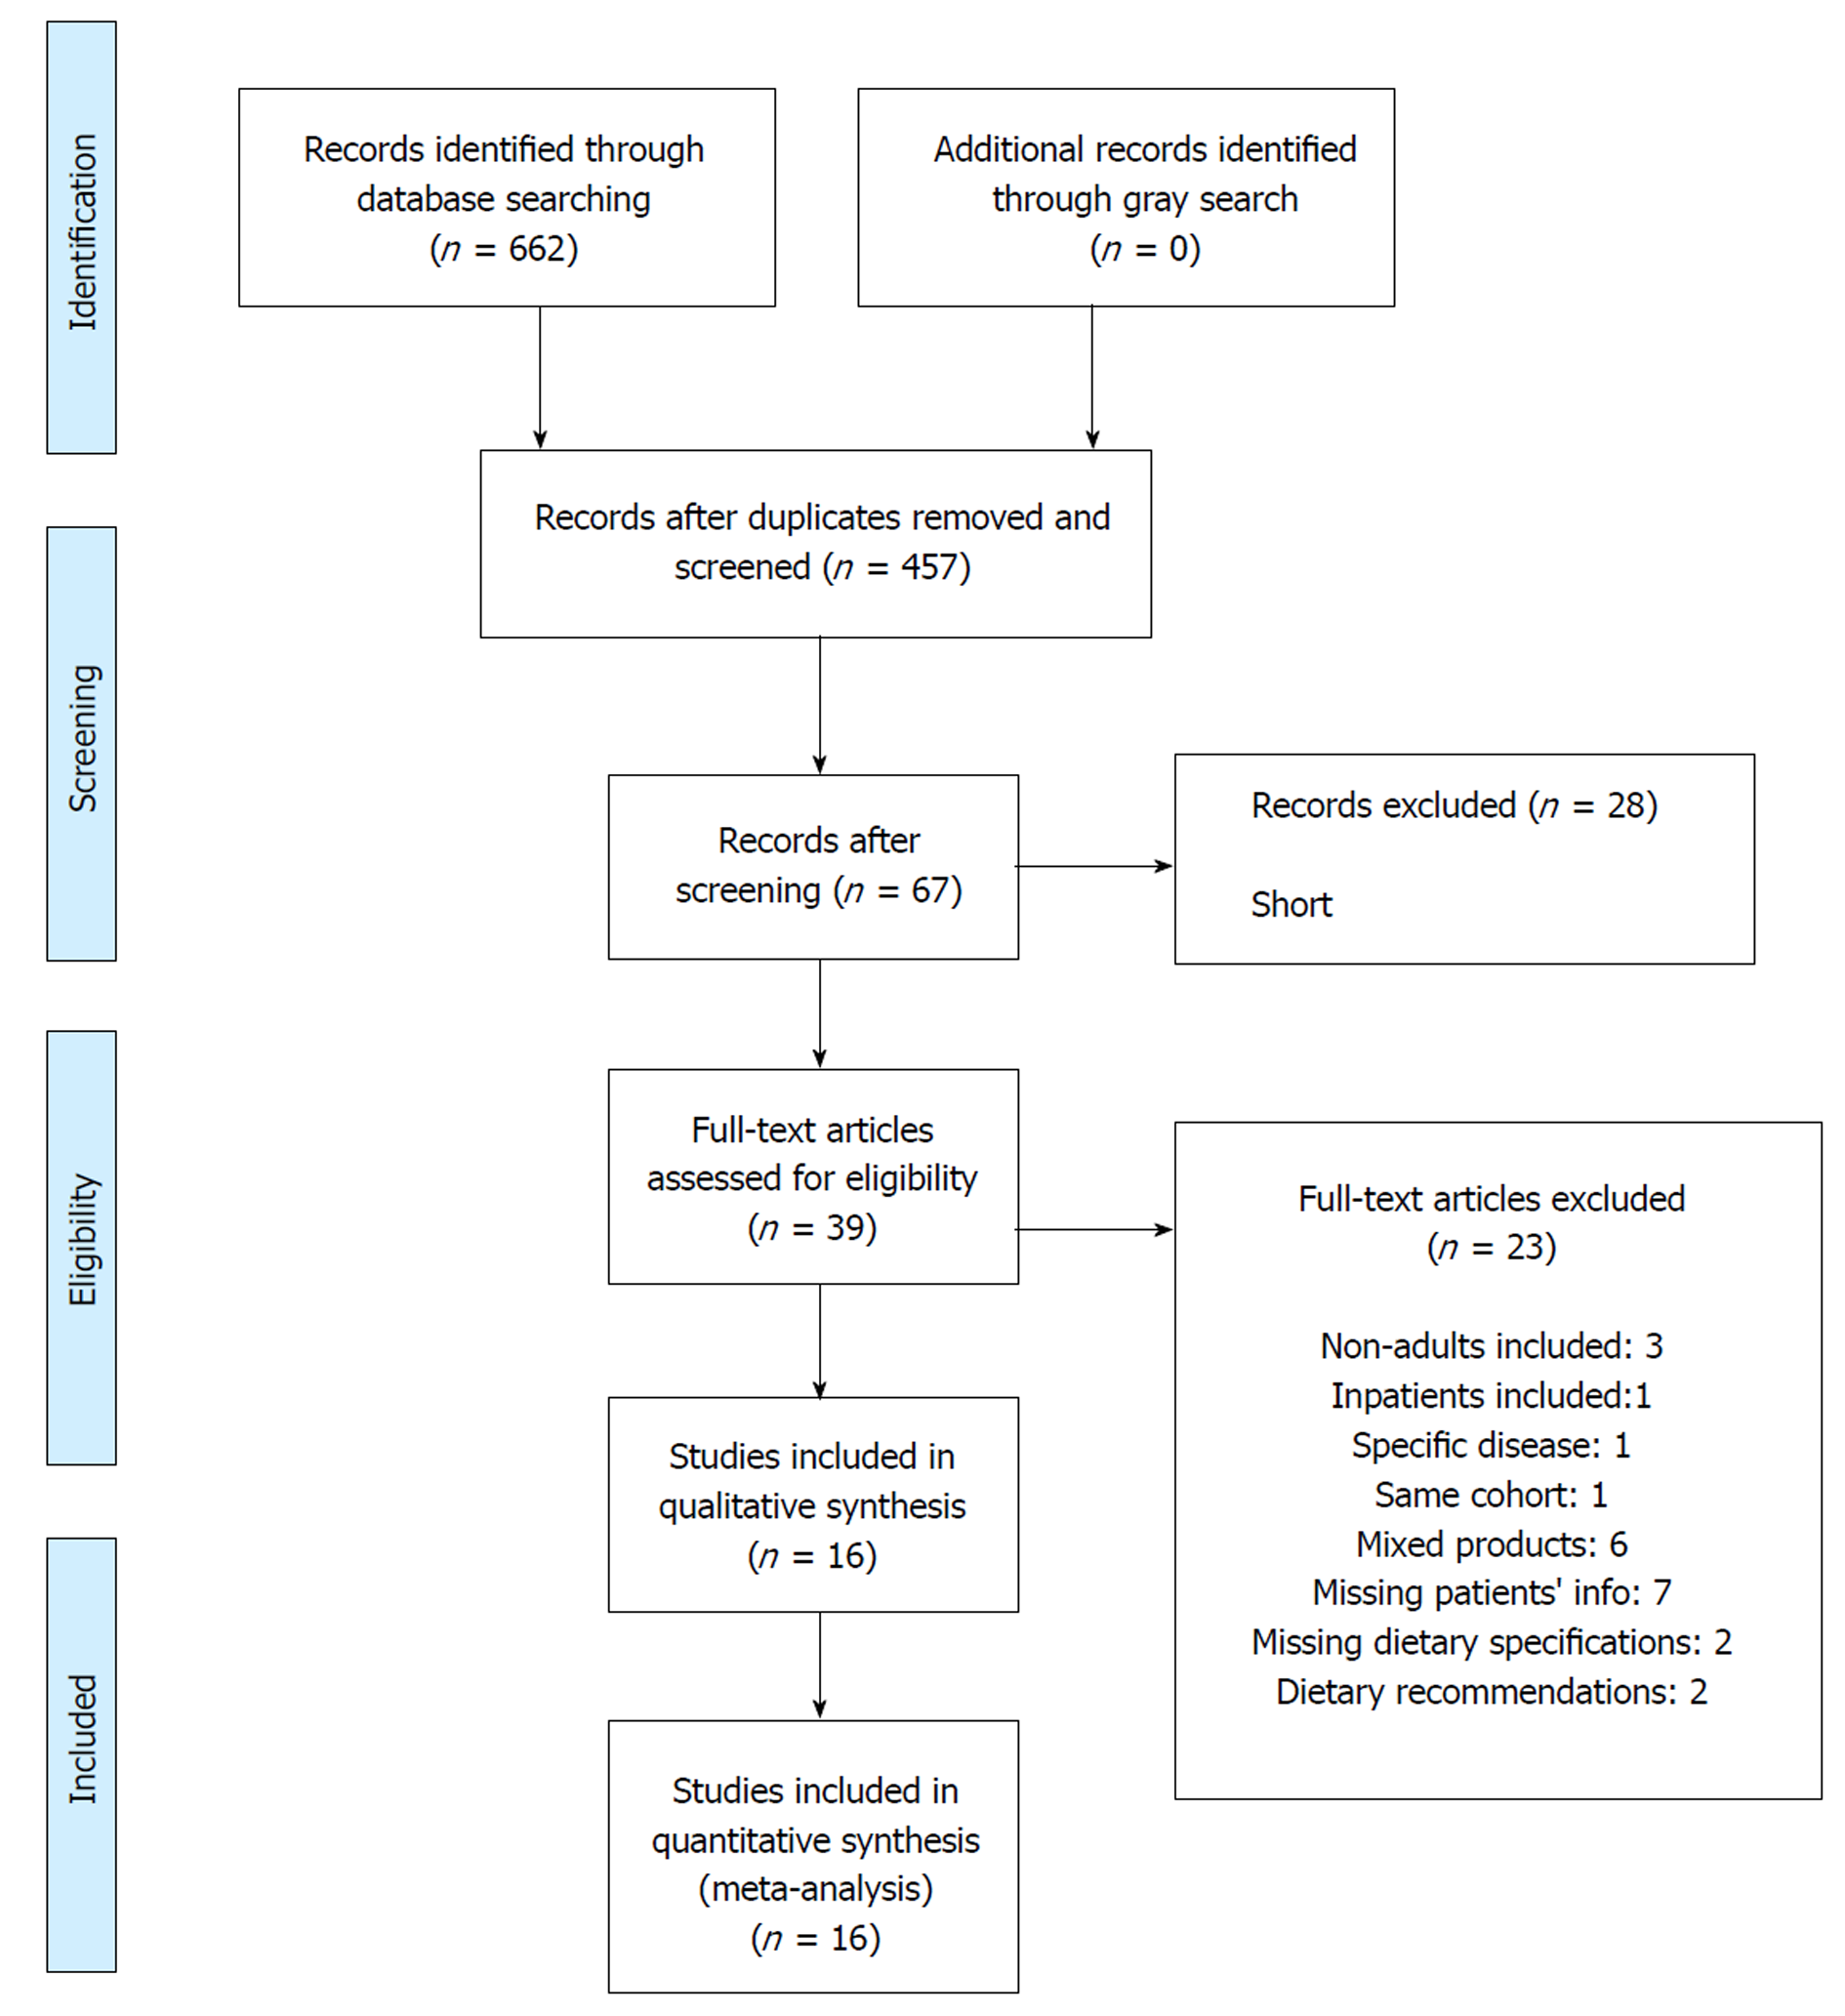
Figure 1 Flow diagram of included studies.
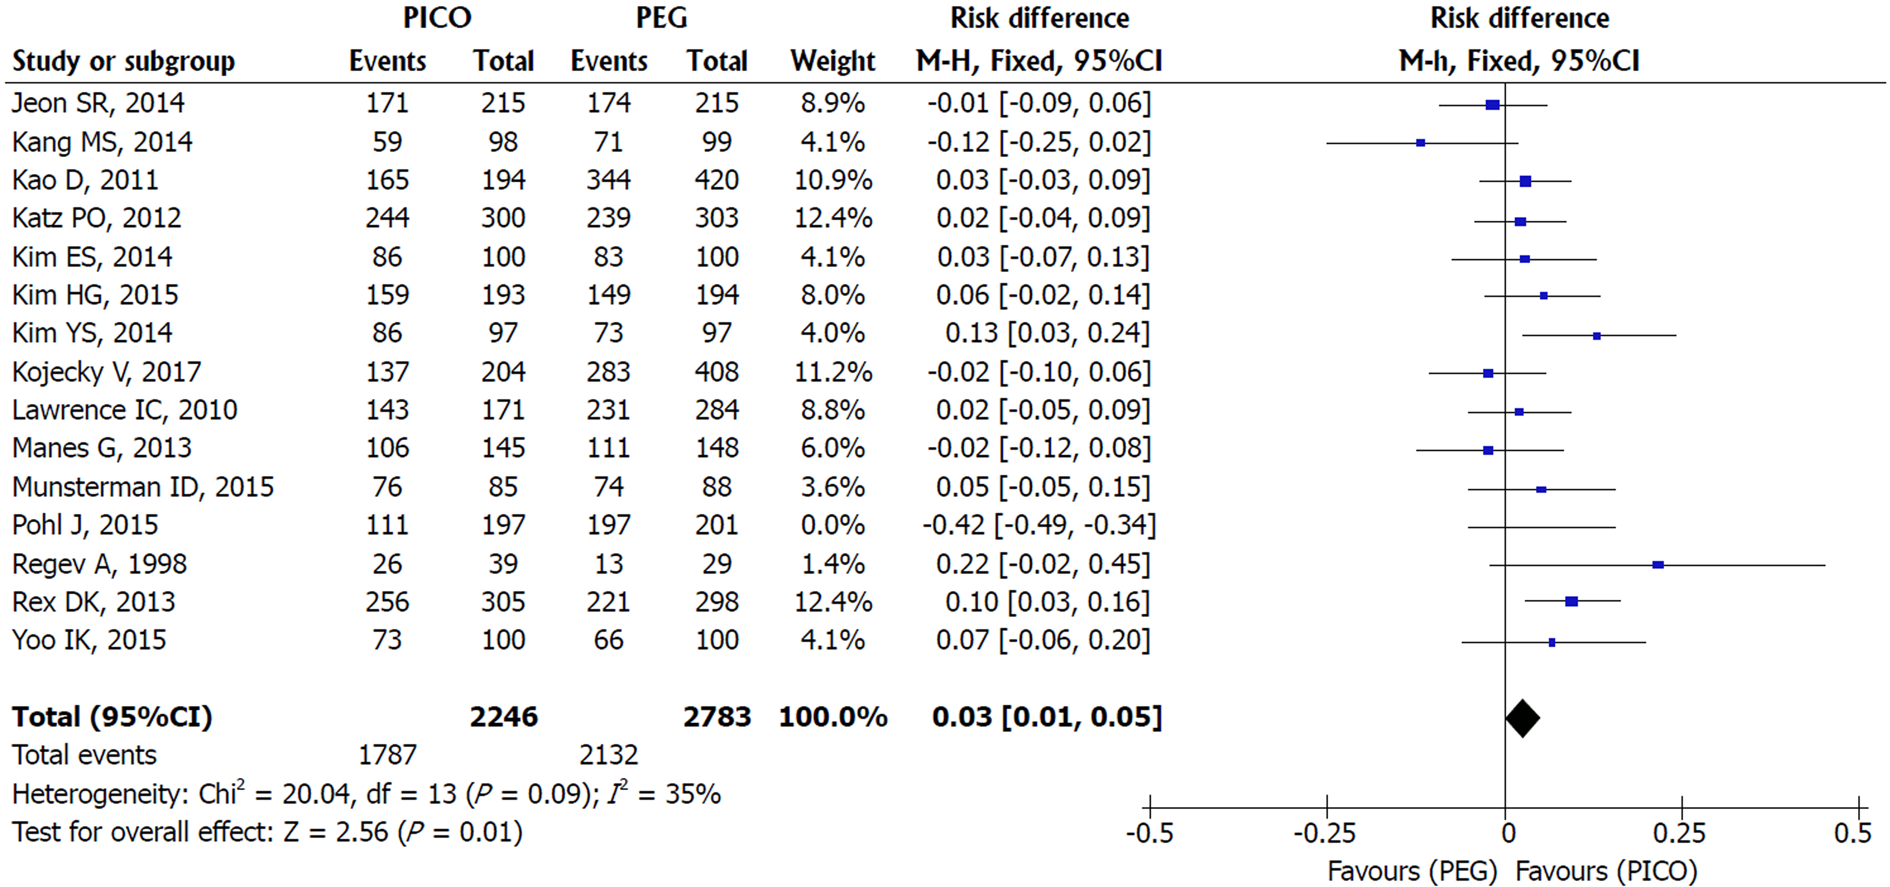
Figure 2 Metanalysis forest plot of bowel cleaning success.
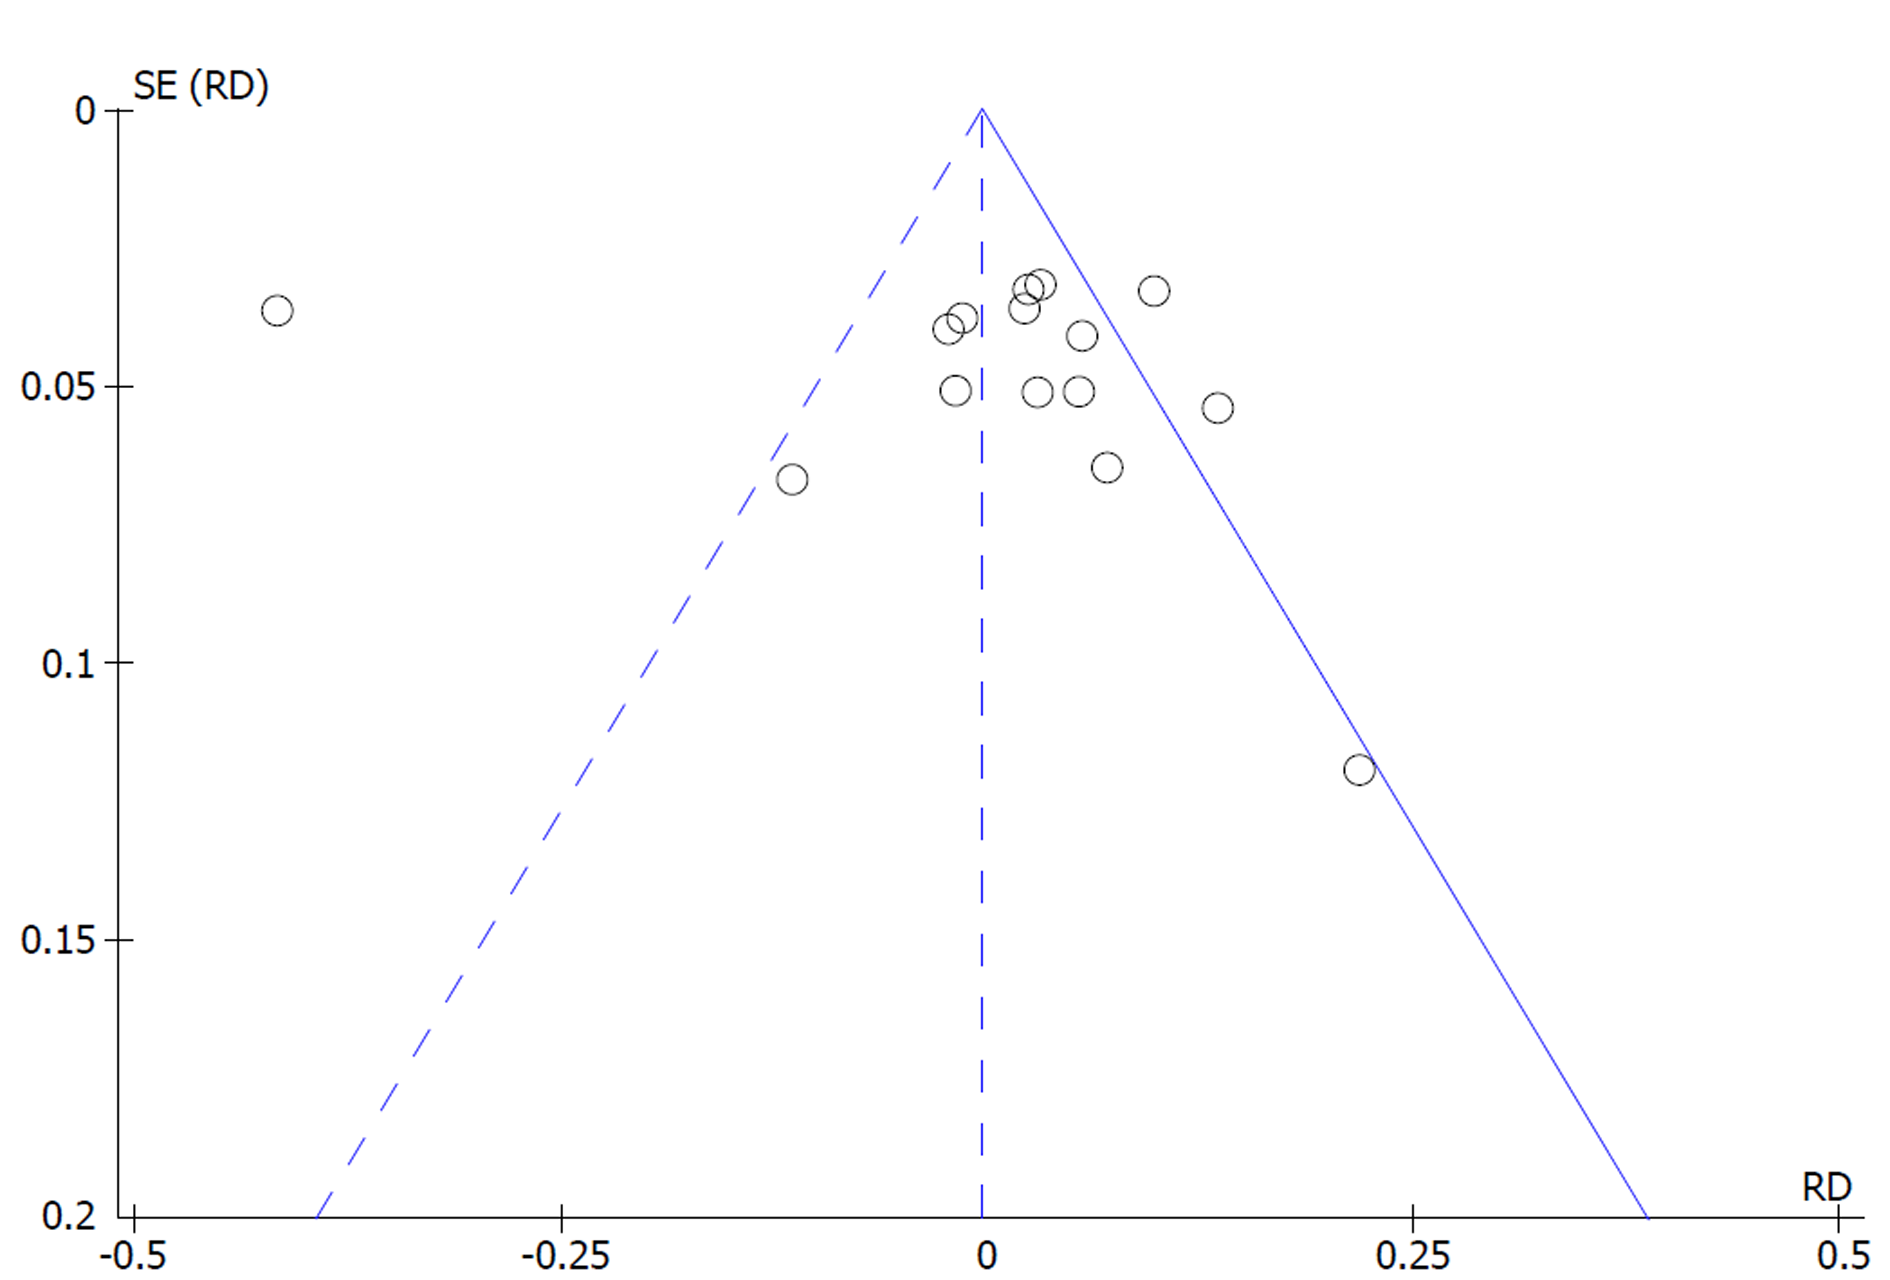
Figure 3 Metanalysis funnel plot of bowel cleaning success.
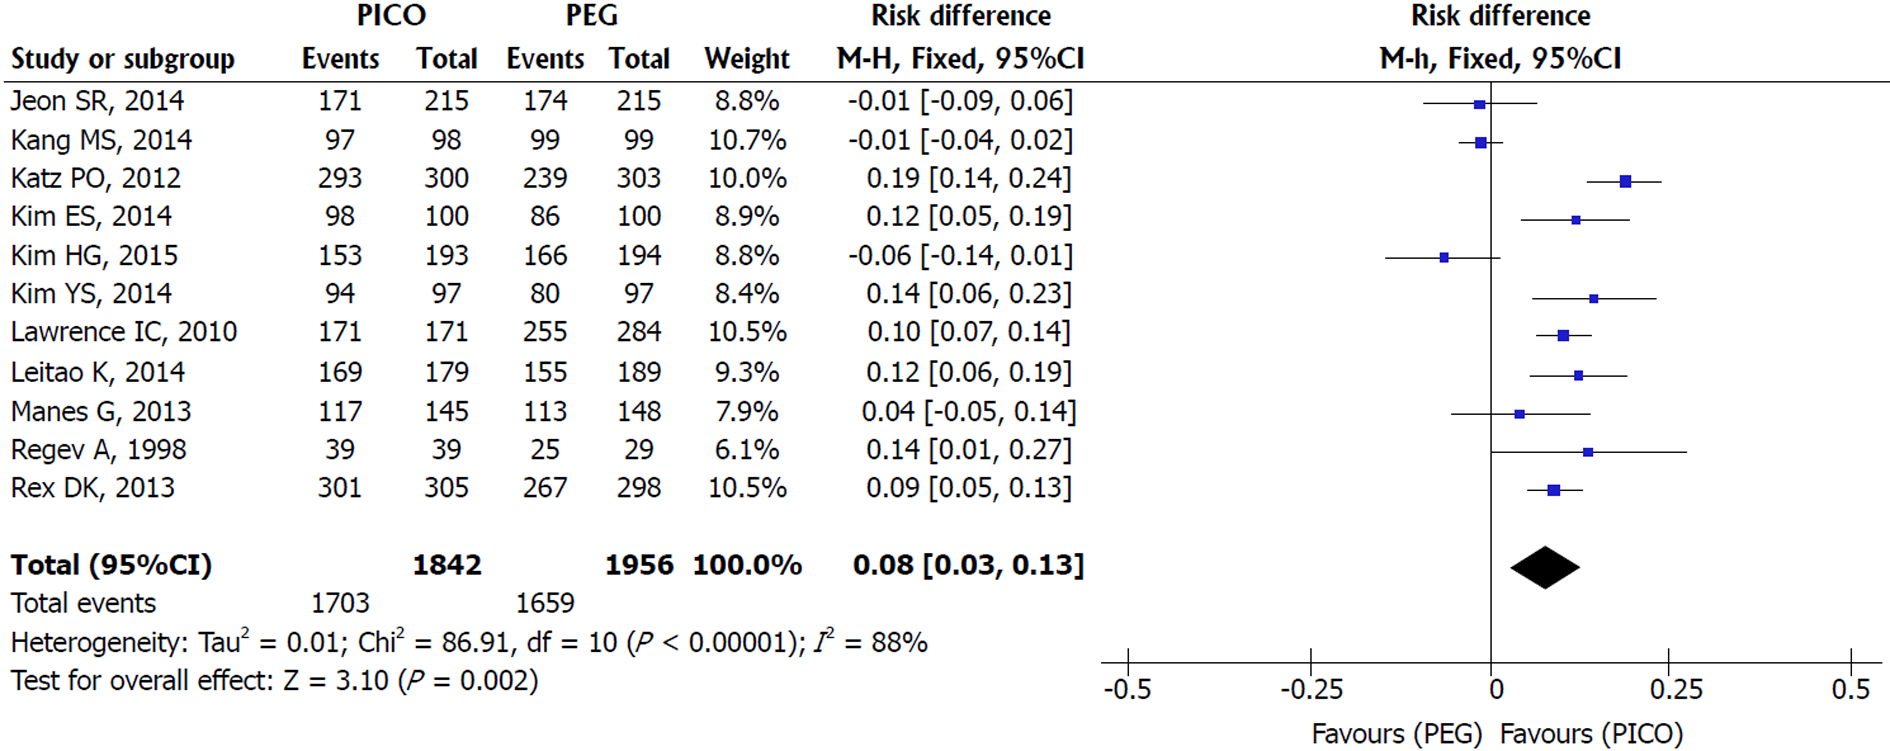
Figure 4 Metanalysis forest plot of tolerability.
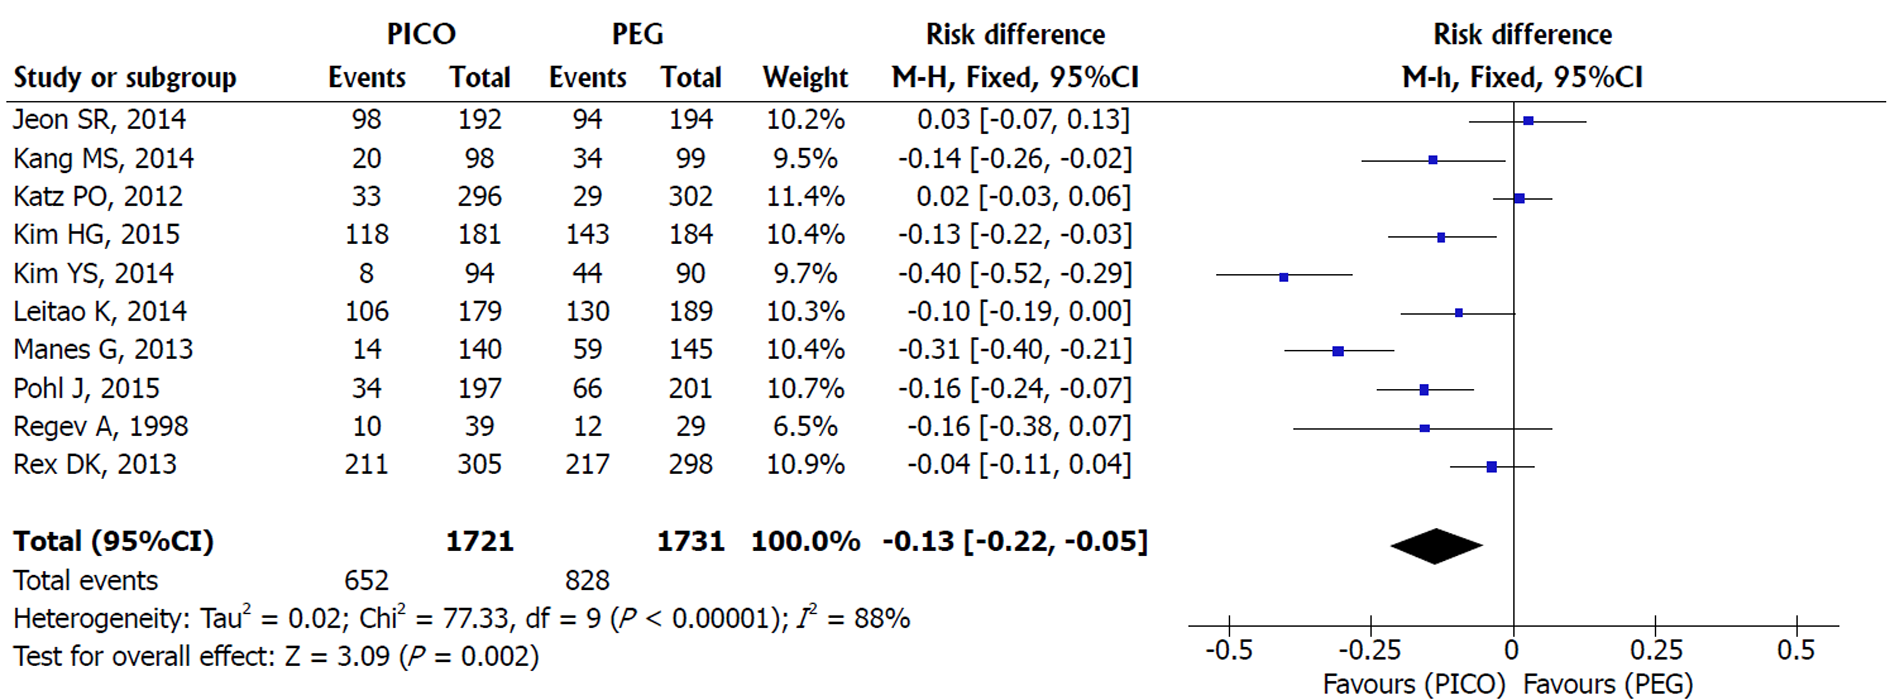
Figure 5 Metanalysis forest plot of adverse events.
Figure 6 Metanalysis forest plot of polyp detection rate.
Figure 7 Metanalysis forest plot of adenoma detection rate.
- Citation: Rocha RSP, Ribeiro IB, de Moura DTH, Bernardo WM, Minata MK, Morita FHA, Aquino JCM, Baba ER, Miyajima NT, de Moura EGH. Sodium picosulphate or polyethylene glycol before elective colonoscopy in outpatients? A systematic review and meta-analysis. World J Gastrointest Endosc 2018; 10(12): 422-441
- URL: https://www.wjgnet.com/1948-5190/full/v10/i12/422.htm
- DOI: https://dx.doi.org/10.4253/wjge.v10.i12.422


