Published online May 27, 2022. doi: 10.4254/wjh.v14.i5.923
Peer-review started: April 18, 2021
First decision: July 27, 2021
Revised: August 7, 2021
Accepted: April 9, 2022
Article in press: April 9, 2022
Published online: May 27, 2022
Processing time: 401 Days and 0.1 Hours
Liver lesions are common findings in radiologists’ daily routine. They are a complex category of pathology that range from solitary benign lesions to primary liver cancer and liver metastases. Benign focal liver lesions can arise from different liver cell types: Epithelial (hepatocytes and biliary cells) and none
Core Tip: Liver magnetic resonance imaging (MRI) is a fundamental radiological technique in patients with focal liver lesions as it allows, with its multiparametric approach, optimal non-invasive tissue characterization. Liver MRI can be highly effective in distinguishing pseudotumor from tumors, as well as benign from malignant lesions and can also be used for differential diagnosis. Although histopathological assessment sometimes has an important role in definitive diagnosis, MRI is a key imaging modality in the diagnosis of liver lesions with a great impact on patient management.
- Citation: Gatti M, Maino C, Tore D, Carisio A, Darvizeh F, Tricarico E, Inchingolo R, Ippolito D, Faletti R. Benign focal liver lesions: The role of magnetic resonance imaging. World J Hepatol 2022; 14(5): 923-943
- URL: https://www.wjgnet.com/1948-5182/full/v14/i5/923.htm
- DOI: https://dx.doi.org/10.4254/wjh.v14.i5.923
Liver lesions are common findings in radiologists’ daily routine. They are a complex category of pathology that ranges from solitary benign lesions to primary liver cancer and liver metastases[1-4]. Benign focal liver lesions can arise from different liver cell types: Epithelial (hepatocytes and biliary cells) and nonepithelial (mesenchymal cells)[5]. The diagnosis is often straightforward, although sometimes distinguishing between malignant primary and secondary lesions may represent a diagnostic challenge due to atypical tumor appearance and features.
To avoid misdiagnosis, radiologists must cope with the key characteristics of the lesion and decide which imaging procedure [i.e., ultrasound (US), computed tomography (CT) and/or magnetic resonance imaging (MRI)] will most likely provide the diagnosis[3,4,6-8].
The use of advanced liver MRI techniques such as diffusion-weighted imaging (DWI), multiarterial phase technique, hepatobiliary contrast agents and artificial intelligence have improved the detection and differentiation of different focal liver lesions[2-4,8-11]. Furthermore, liver MRI is often the last imaging technique used in the diagnostic algorithm before liver biopsy.
Therefore, it is important to know the characteristics of different focal liver lesions on MRI and how to differentiate between benign and malignant lesions in order to make the correct diagnosis, recommend the best follow-up when necessary, cut the costs of unnecessary diagnostic tests and, last but not least, reduce patient anxiety.
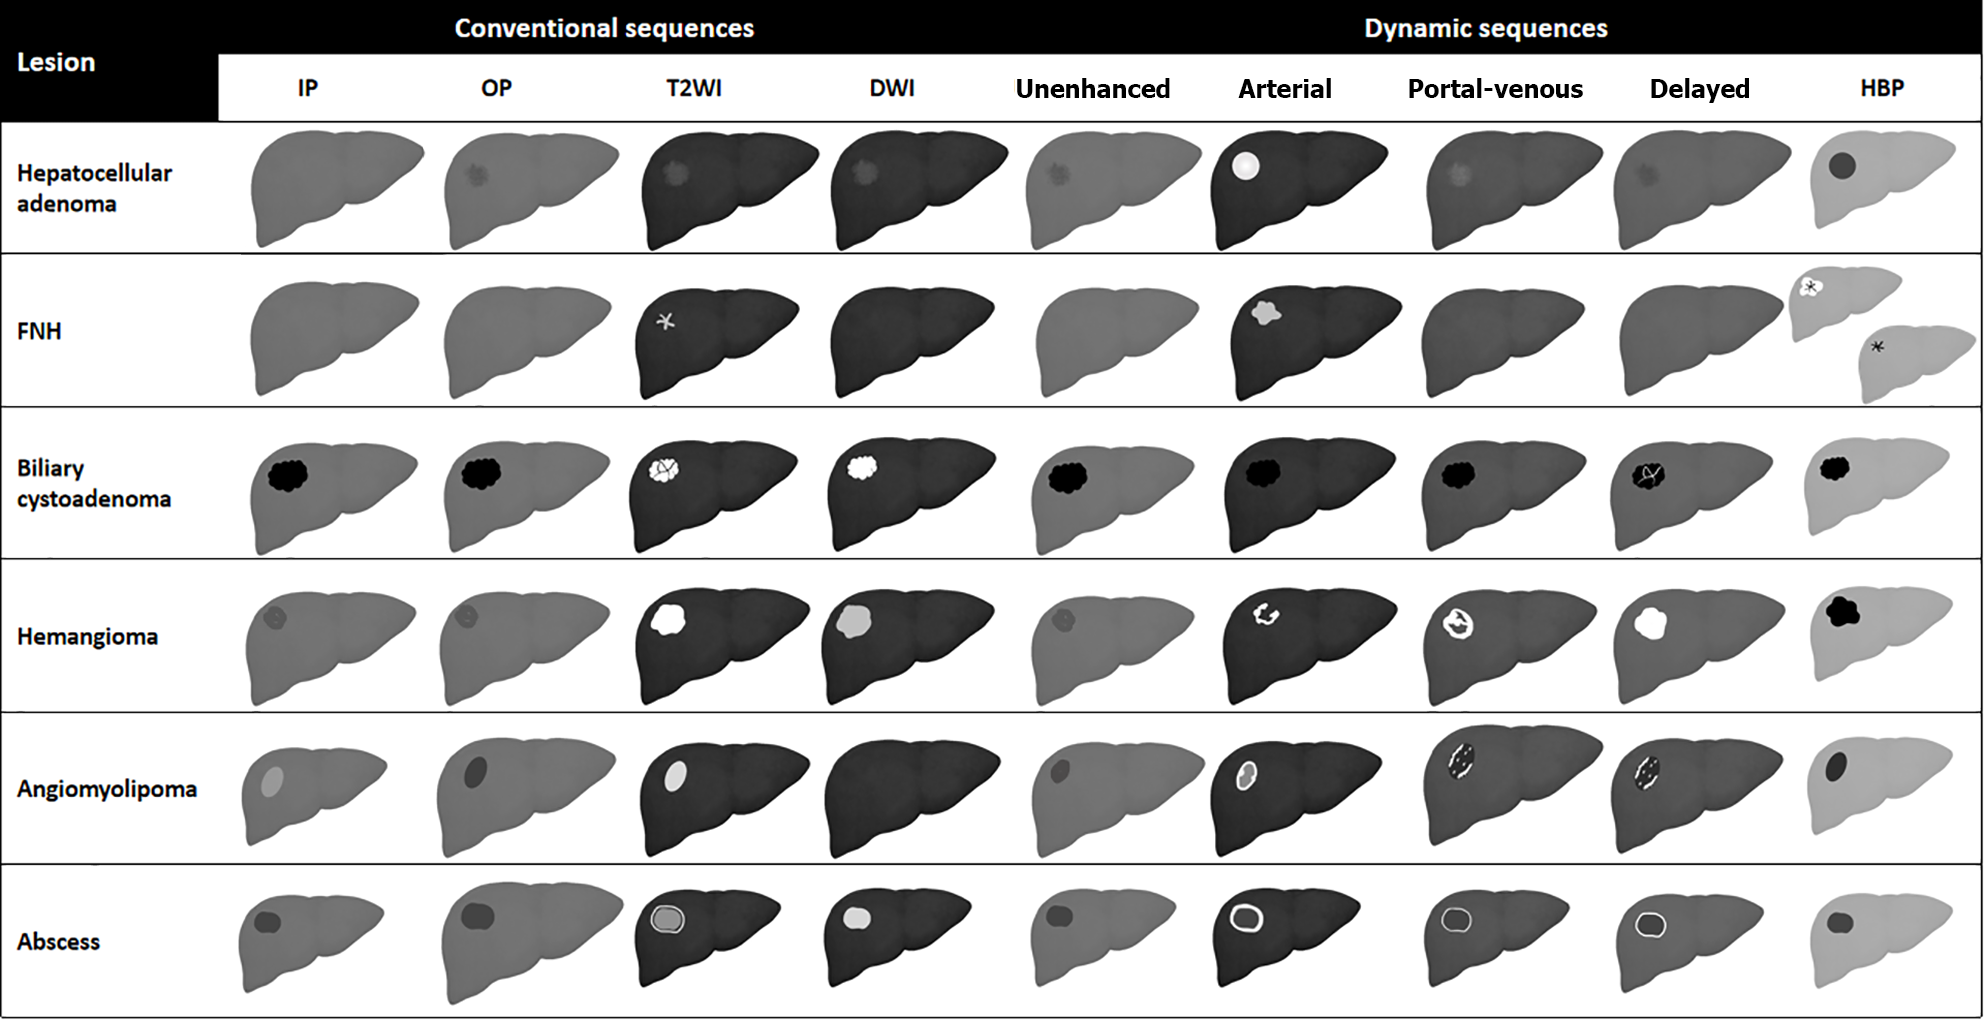
This aim of this article is to provide a comprehensive overview of benign liver lesions on MRI. A schematic representation showing MRI features of benign liver lesions is presented in Figure 1. Table 1 shows the histological classification that was used in this review. Table 2 provides an overview of the MRI contrast agents currently used in clinical practice.
| Epithelial tumors (hepatocellular and biliary) | Mesenchymal tumors | Pseudotumor |
| Hepatocellular adenoma | Hemangioma | Focal fatty infiltration |
| Focal nodular hyperplasia | Lymphangioma | Infection (liver abscess, Echinococcus granulosus) |
| Biliary cystadenoma | Solitary fibrous tumor | Inflammatory disorder of the liver (pseudotumor, sarcoidosis) |
| Biliary hamartoma (von Meyenburg Complex) | Mesenchymal hamartoma |
| Category | Molecule | Structure | Ioniity | Relaxivity | Recommended dose (mmol/kg) | Excretion |
| ECAs | Gadoterate meglumine (Dotarem) | Macrocyclic | Ionic | Standard | 0.1 | Renal |
| ECAs | Gadobutrol (Gadavist) | Macrocyclic | Non-ionic | Standard | 0.1 | Renal |
| ECAs | Gadoteridol (Prohance) | Macrocyclic | Non-ionic | Standard | 0.1 | Renal |
| ECAs | Gadopentetate dimeglumine (Magnevist) | Linear | Ionic | Standard | 0.1 | Renal |
| ECAs | Gadoversetamide (OptiMark) | Linear | Non-ionic | Standard | 0.1 | Renal |
| ECAs | Gadodiamide (Omniscan) | Linear | Non-ionic | Standard | 0.1 | Renal |
| HBA | Gd-EOB-DTPA (Eovist/Primovist) | Linear | Ionic | High | 0.025 | 50% renal, 50% biliary |
| HBA | Gd-BOPTA (MultiHance) | Linear | Ionic | High | 0.1 | 5% biliary, 95% renal |
| BPA | Gadofosveset trisodium (Ablavar) | Linear | Ionic | High | 0.03 | Renal |
Hepatocellular adenoma (HCA) is a rare benign monoclonal neoplasm of the liver, composed of hepatocytes arranged in sheets or in a cord-like fashion with a lack of portal venules and biliary ductules[12-14]. Hepatocyte sheets are separated by dilated sinusoids. They are perfused solely by high-pressure peripheral arterial feeding vessels, resulting in a remarkable hypervascular nature. Hepatocytes might contain a variable amount of intracellular fat or glycogen.
HCA has an annual incidence of about 1-1.3 million cases per year in North America and Europe; 85% of cases occur in women of childbearing age (15-45 years old)[15]. An increased incidence of HCAs has been reported since the 1960s following the introduction of oral contraceptive pills (OCPs)[14,16]: Long-term users of OCPs have a 25-fold increased risk of developing HCA compared to the general population[14]. Some studies suggested that OCP discontinuation might lead to tumor regression, but this remains controversial[17]. Similarly, long-term use of anabolic androgen steroids (AAS) has been associated with a high risk of developing HCA. Glycogen storage disorders (GSDs), in particular type 1 and type 3, have been linked to an increased incidence of HCAs[14].
Hepatic adenomatosis, first described in 1985, is a condition in which 10 or more adenomas are present in an otherwise normal liver[18]. These cases are at higher risk of complications: 63% risk of hemorrhage and 10% risk of malignant transformation[19]. Other risk factors for HCA are diabetes (both type 1 and 2), metabolic syndrome, obesity, Fanconi’s anemia, familial adenomatosis polyposis, beta thalassemia and tyrosinemia[14].
HCAs may be complicated by the presence of intralesional fat, hemorrhage, or malignant transformation with a subsequent wide range of imaging appearances resulting in a challenging diagnostic process. In 2006, four subtypes of HCA were identified based on genotype-phenotype analyses according to the genetic and histopathological features of the lesion: (1) Type 1: Hepatocyte nuclear factor (HNF)-1α HCA; (2) Type 2: Inflammatory HCA (I-HCA); (3) Type 3: β-catenin activated HCA; and (4) Type 4: Unclassified HCAs[12].
Several hypervascular benign and malignant hepatic lesions may mimic HCA: Focal nodular hyperplasia (FNH), hepatocellular carcinoma (HCC), hemangioma (HA), angiomyolipoma and metastases. The use of hepatocyte-specific contrast agent allows differential diagnosis between HCA and FNH with very high sensitivity and specificity (respectively 91% to 100% and 87% to 100%)[20]. On the hepatobiliary phase (HBP), most HCAs present a low signal compared to surrounding parenchyma, while FNHs have an iso- or hyperintense signal. Some HCAs, however, generally I-HCAs, may have an iso- or hyperintense signal on the HBP.
HNF-1α HCA is the second most common subtype of HCA, representing 30% to 35% of lesions; it is almost exclusively found in women, the majority of whom (> 90%) with a history of OCP use in anamnesis[20]. This type of HCA may be associated with maturity-onset diabetes of the young and familial adenomatosis. HNF-1α HCA generally has an indolent biological behavior and among all types of HCA it has the lowest risk of malignant degeneration. HNF-1α HCA may be associated with mutations of the transcription factor 1 gene on chromosome 12q24.43, an anti-oncogene involved in hepatocyte differentiation, whose inactivation can promote proliferation of such cell lines[14].
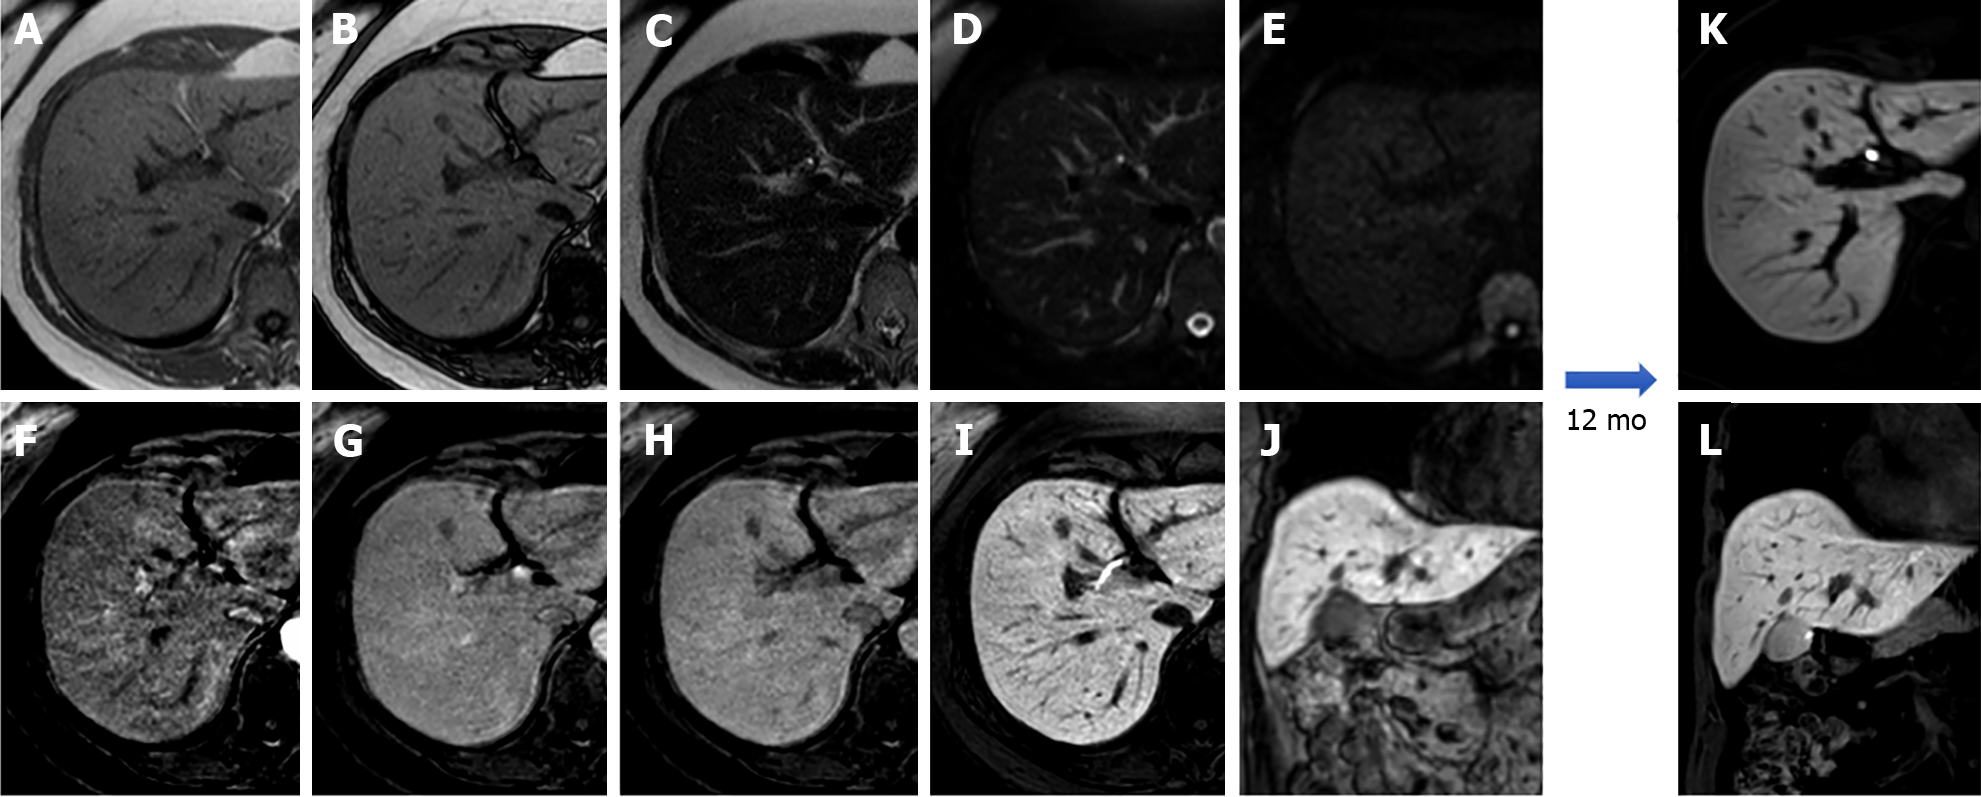
Due to its intracellular fat content, HNF-1α HCA typically exhibits diffuse intratumoral signal loss on chemical-shift T1-weighted imaging (i.e., signal loss on opposed-phased images compared to in-phase images); this finding alone demonstrates 86.7% sensitivity and 100% specificity for this subtype. HNF-1α HCA is often hyper- or isointense on T1-weighted images and iso- or hyperintense on T2-weighted images, with no apparent signal restriction on diffusion imaging. HNF-1α HCAs often show hyper-enhancement in the arterial phase after contrast injection; however, this does not persist in the portal venous phase[14,21] (Figure 2).
This is the most frequent subtype, accounting for 40% to 50% of all HCAs; it is linked to mutations in the interleukin 6 signal transducer gene, which is located on chromosome 5q11 and codes for glycoprotein 130. This mutation causes the Janus kinase (JAK) signal transducer to be activated indefinitely, resulting in aberrant hepatocyte proliferation. Type 2 HCA is most common in young women on OCP medication, as well as in those with metabolic syndrome or obesity.
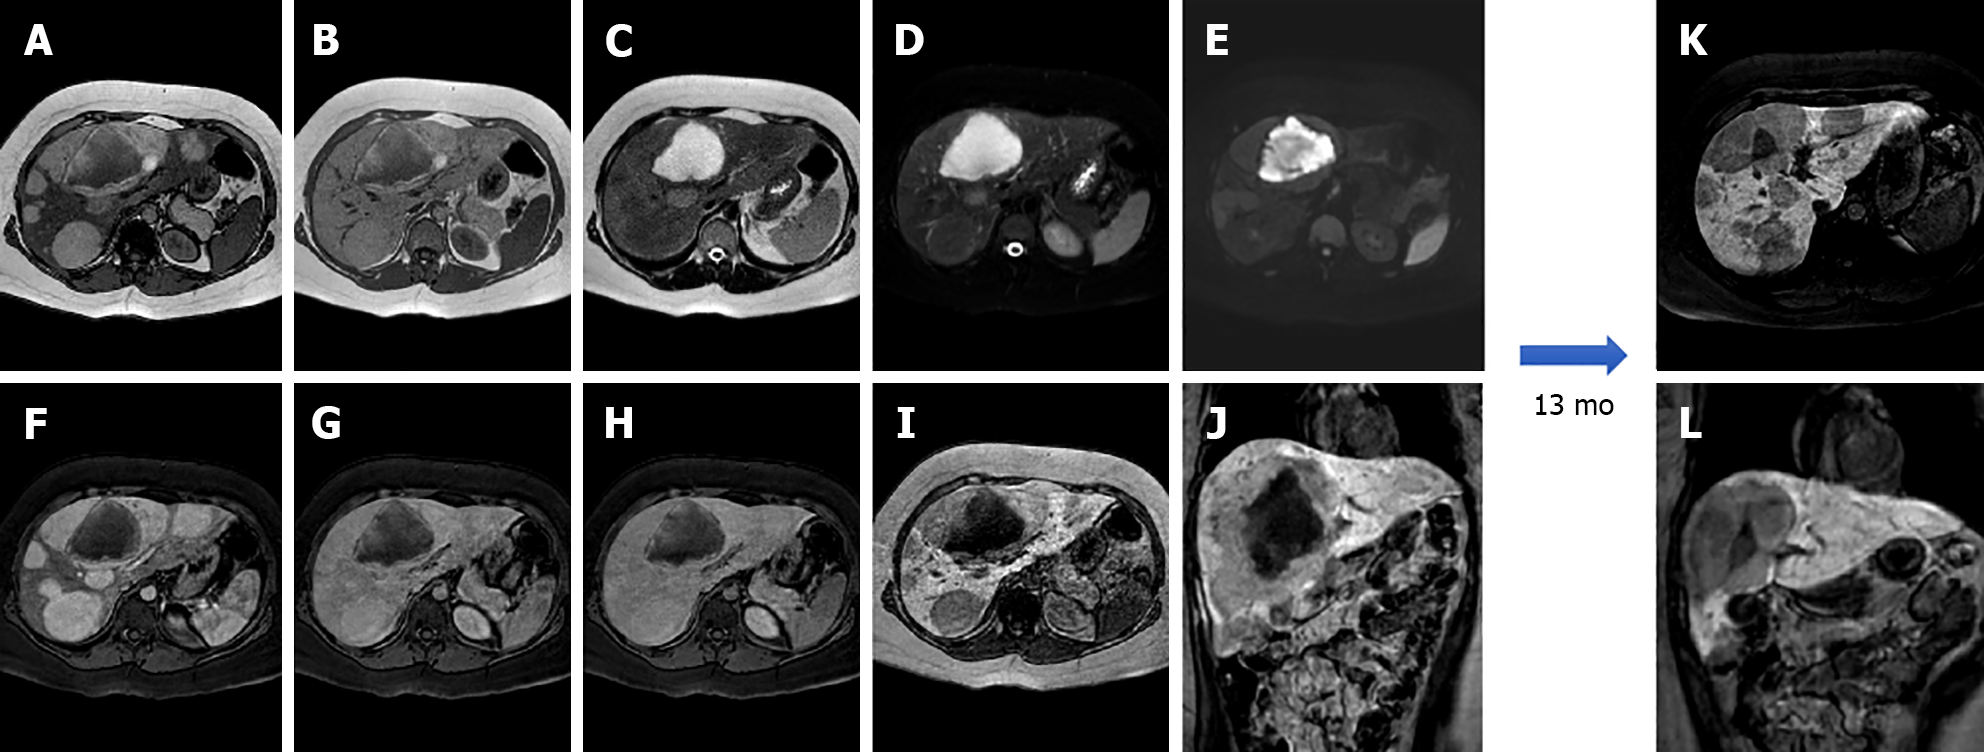
I-HCA is the HCA type with the highest risk of bleeding, occurring in up to 30% of cases. Malignant transformation of HCAs into HCC occurs in 5% to 10% of cases. On MRI, I-HCA generally shows a heterogeneous high signal on T2-weighted sequences, more intense in the peripheral part of the lesion (“atoll” sign) and arterial enhancement that persists in the portal venous and delayed phases. Such features are due to the presence of dilated sinusoids. Intralesional steatosis is rare, more frequently focal or with a patchy and heterogeneous pattern. Intratumoral hemorrhage, reported in up to 30% of cases, results in increased lesion heterogeneity (Figure 3). Acute hemorrhage presents a high signal on T1-weighted sequences due to the presence of methemoglobin; chronic hemorrhage has a low signal on T1 and T2-weighted sequences due to hemosiderin content[14,21].
β-catenin activated HCAs account for 10% to 15% of all HCAs. Mutations in the β-catenin gene (CTNNB1) on chromosome 3p21 cause continuous activation of the β-catenin protein, resulting in uncontrolled hepatocyte growth. It is more common in men and is linked to GSDs, AAS, and familial adenomatosis polyposis. β-catenin mutation is strongly associated with malignant degeneration[14].
β-catenin-activated HCAs do not have typical MRI features. Such lesions generally do not contain intratumoral fat. Malignant transformation may be suspected in the case of growth, local invasion, or contrast medium washout on portal-venous or delayed phases. β-catenin-activated HCAs present arterial enhancement and washout on the portal-venous and delayed phase, making differential diagnosis with HCC challenging[14,21,22].
This category includes approximately 10% of all HCAs with an adenoma-like appearance but no distinguishing genetic and/or clinical characteristics. There is a scarcity of information about these lesions. Such tumors have no pathognomonic characteristics on MRI[14,23].
After HA, FNH is the second most common benign hepatic tumor (representing around 8%-9% of all primary liver tumors) and is frequently an incidental finding on imaging as most individuals are asymptomatic. FNHs are more common in females than in males (8:1), in the third to fifth decades, and, unlike HCAs, a relationship with OCPs is uncommon. Severe FNH syndrome is defined as the presence of multiple FNH lesions (up to 20%) and HAs. To ensure adequate treatment, it is crucial to distinguish FNH from other hypervascular liver lesions such as HCA, HCC, and hypervascular metastases[24].
FNH should be regarded as a regenerative lesion rather than a neoplasm: It may be caused by the presence of a vascular abnormality (either of the arterial or portal vascular supply) that, when combined with hormonal stimulation, results in mass growth. Histologically, these lesions are known as hamartomatous malformations[25]. From an anatomopathological point of view FNH is a nodule with polycyclic contours, composed of organized hepatocytes, completely or incompletely surrounded by circular or short fibrous septa originating from a central scar that contains a hypertrophic arterial vessel, originating from the hepatic artery.
The surrounding septa connective tissue also contains numerous capillaries and ductules. The rich network of capillaries, that arise from the central artery, provide arterial blood to the hepatocytes and sinusoids, in accordance with the highly hypervascular nature of most FNH lesions on imaging[26]. The sinusoids, the malformed arteries and the vein of FNH drain into the hepatic vein. FNH does not have a portal venous supply. Normal liver tissue surrounds the FNH and there is no fibrous capsule at the interface of the lesion and the liver[27].
Due to its vascular physiopathology, FNH is commonly associated (20%-30%) with other hepatic lesions or conditions such as hepatic HA, arteriovenous malformations, anomalous venous drainage, HCA (possible but not proven), congenital absence of portal vein/portal vein atresia and portal shunts[28]. Because it contains hepatocytes, FNH shows an isointense signal on both T1- and T2-weighted sequences with occasional slight hypointensity and hyperintensity on T1 and T2, respectively.
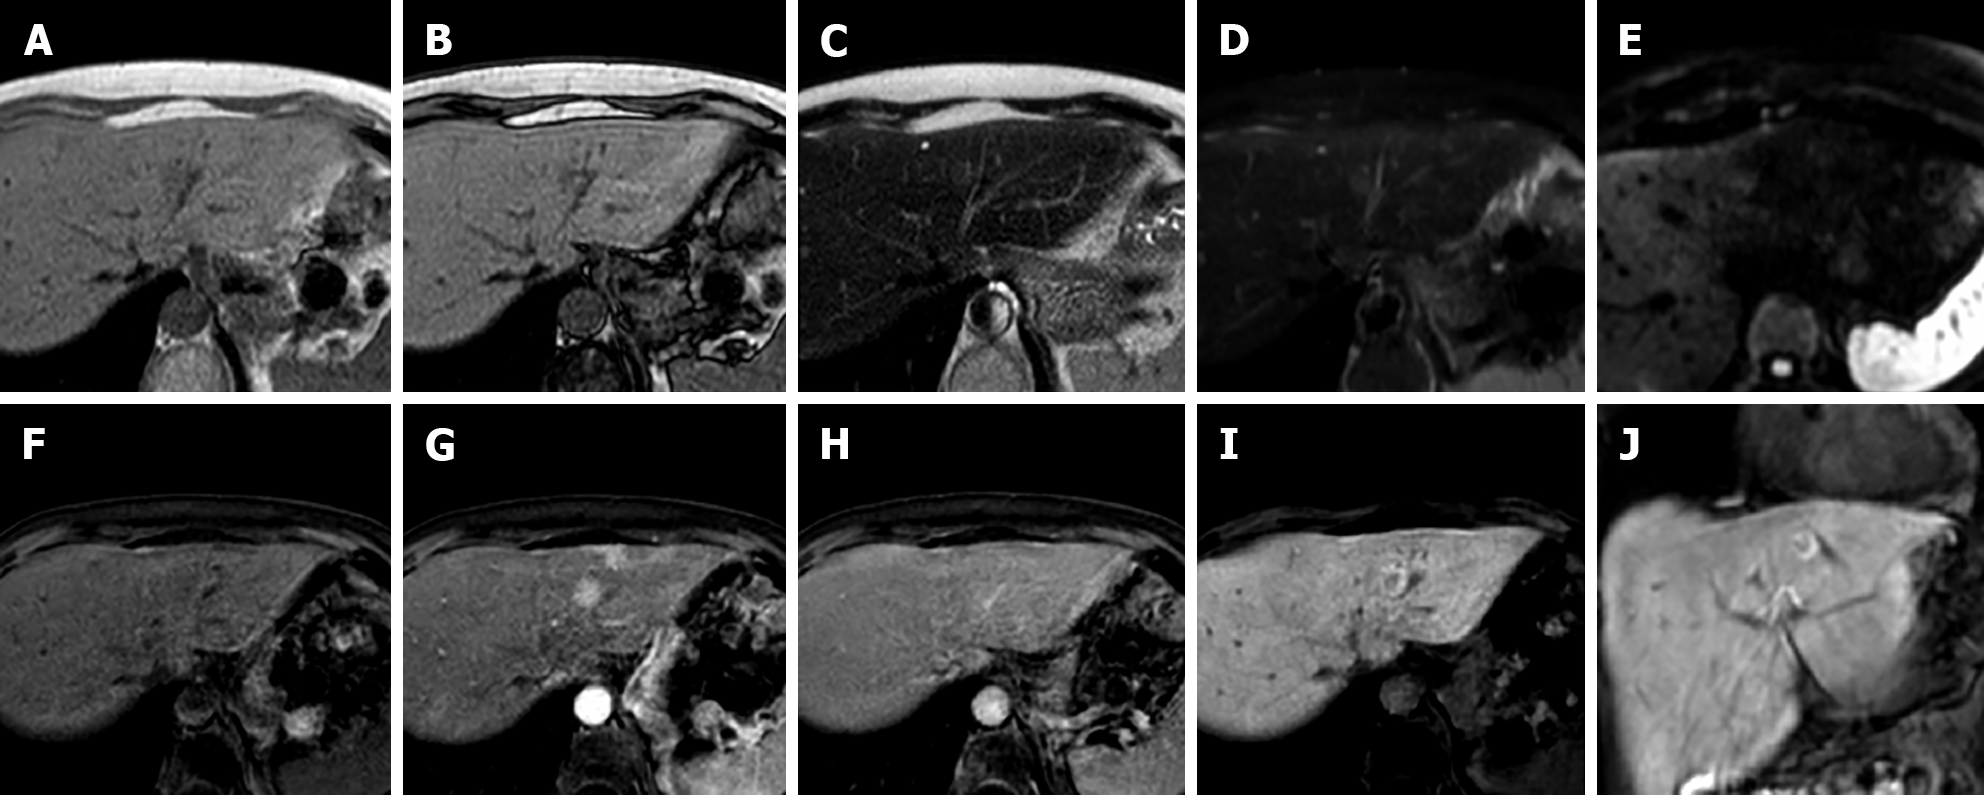
MRI imaging has higher sensitivity (70%) and specificity (98%) for FNH than US and CT. Both on CT and MRI, after contrast medium administration, FNH shows homogenous and strong contrast enhancement in the arterial phase with the exception of the central scar[26]. During portal-venous and delayed phases, it becomes isointense to the liver parenchyma while the central scar remains relatively hypointense. On HBP FNH appears isointense to hyperintense compared to adjacent liver parenchyma without or with the presence of a central scar[21], which is hypointense (Figure 4).
On diffusion weighted imaging the average numerical value of the apparent diffusion coefficient (ADC) in benign hepatic lesions (FNH, HA, HCA) is about 1.88 (1.326-2.48) × 103 mm2/s, while the ADC of malignant liver lesions [HCC, cholangiocarcinoma (CCC), colorectal cancer liver metastasis (CRCLM)] are significantly lower, around 1.15 (1.024-1.343) × 10-3 mm2/s[29]. FNH and HCA have ADC values lower than normal liver but FNH has an ADC higher than HCA[30].
The central scar is more often detected with MRI than with CT (78% and 60%, respectively)[31]. The central scar appears slightly hyperintense on T2-weighted images and this is an important difference compared with the central scar of HCC that is generally hypointense in all sequences and is rarely hyperintense, mimicking that of FNH[32].
On MRI with non-hepatobiliary specific agents (and consequently also on CT imaging) the central scar shows enhancement in the delayed phase due to the presence of abundant myxomatous stroma. With different hepatobiliary specific agents the central scar manifests variously[32]: (1) With gadobenate dimeglumine (Gd-BOPTA - MultiHance®; Bracco, Milan, Italy) the central scar will enhance in the late phase (hepato-biliary excretion after 1-3 h); and (2) With gadoxetic acid (Gd-EOB-DTPA - Primovist®; Bayer-Schering, Berlin, Germany) the central scar will never enhance because the late venous phase overlaps the HBP (that comes on average after 10-100 min) making everything that is not of hepatocellular origin hypointense, including the connective central scar.
Currently, FNH is divided into two types: Classic and non-classic. Classic FNH is characterized microscopically by the presence of: (1) Abnormal nodular architecture; (2) Malformed vessels; and (3) Cholangiolar proliferation and on imaging appears with all the characteristics mentioned above. Non-classic FNH lesions lack one of the classic features but always show bile ductular proliferation[24]. Non-classic FNH may demonstrate “atypical appearance” at imaging that may lead to the following 5 subtypes: (1) No central scar FNH; (2) Large central scar; (3) Intralesional fat; (4) Presence of a pseudocapsule; and (5) Sinusoidal distension (Figure 5).
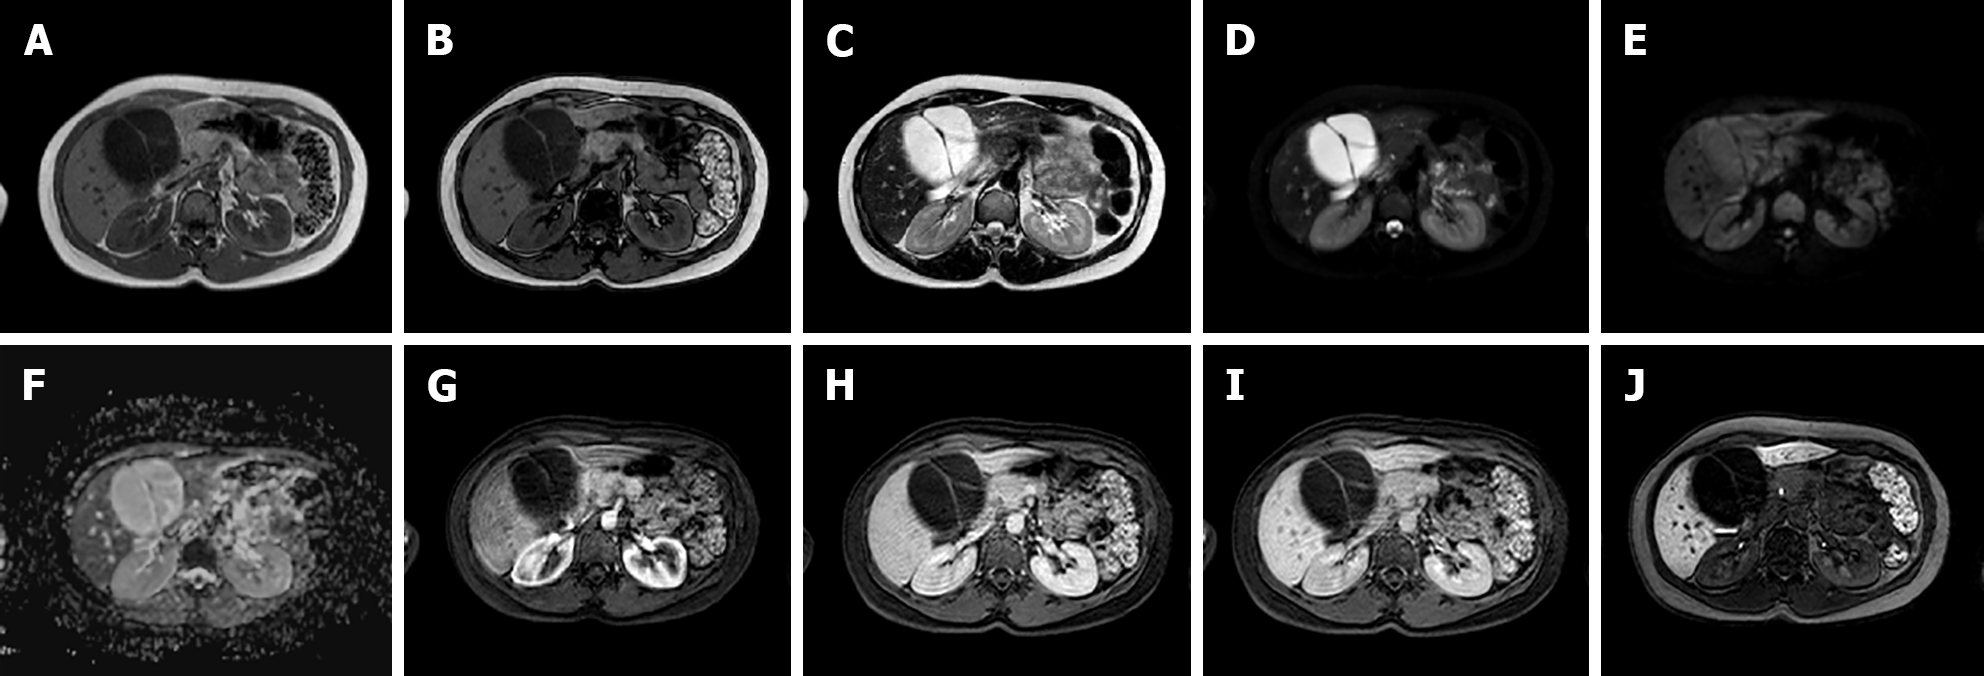
Biliary cystadenoma (BCA) is an uncommon (less than 5% of cystic liver lesions) benign hepatic tumor that arises from intrahepatic biliary channels, most commonly in the right lobe (55%), and rarely from extrahepatic biliary ducts or the gallbladder[33]. Due to its high prevalence in middle-aged women (> 85%)[33] it is considered a congenital disorder with potential hormonal influence. Due to its high risk of recurrence (if non-completely removed) and its potential risk for malignant degeneration into biliary cystadenocarcinoma (BCAC), the differential diagnosis with other cystic lesions of the liver is mandatory[21].
US imaging reveals a massive, lobulated, well-defined hypoechoic or anechoic mass with hyperechoic interior septa or calcifications and solid papillary projections; contrast-enhanced ultrasonography (CEUS) may indicate enhancement of the walls and septa. These features may aid in identifying BCA from other liver cystic lesions[33].
CT confirms US appearance and CEUS behavior: A single multiloculated cystic lesion with a well-defined thick fibrotic capsule, mural nodules, and rarely calcifications of the capsule[33]. On MRI, BCA appears as a fluid-containing multilocular lesion that is significantly hypointense on T1-weighted sequences and hyperintense on T2-weighted images with septal hypointensity. On both T1- and T2-weighted images, the signal intensity may fluctuate due to the presence of proteinaceous material or blood products[21] (Figure 6). If thinner septa and a regular wall are seen in cystadenoma, polypoid excrescences, hemorrhage and evident vascularized septa are more suspicious for BCAC, but the differential diagnosis between such lesions may be challenging[21].
Multiple biliary hamartomas, also known as von Meyenburg Complex, are rare bile duct malformations, with a very low incidence ranging between 0.4% and 5.5%. There is a higher prevalence in females (F/M = 7/4) with a mean age of 48 years (range 33-68 years). They belong to the spectrum of “fibropolycystic liver disease” and are defined as small duct dilatations within thick bile. The cause is unknown, however it can be present in both non-cirrhotic and cirrhotic livers, as well as in children and adults. However, its prevalence rises dramatically with chronic liver illness, implying an acquired etiology[34].
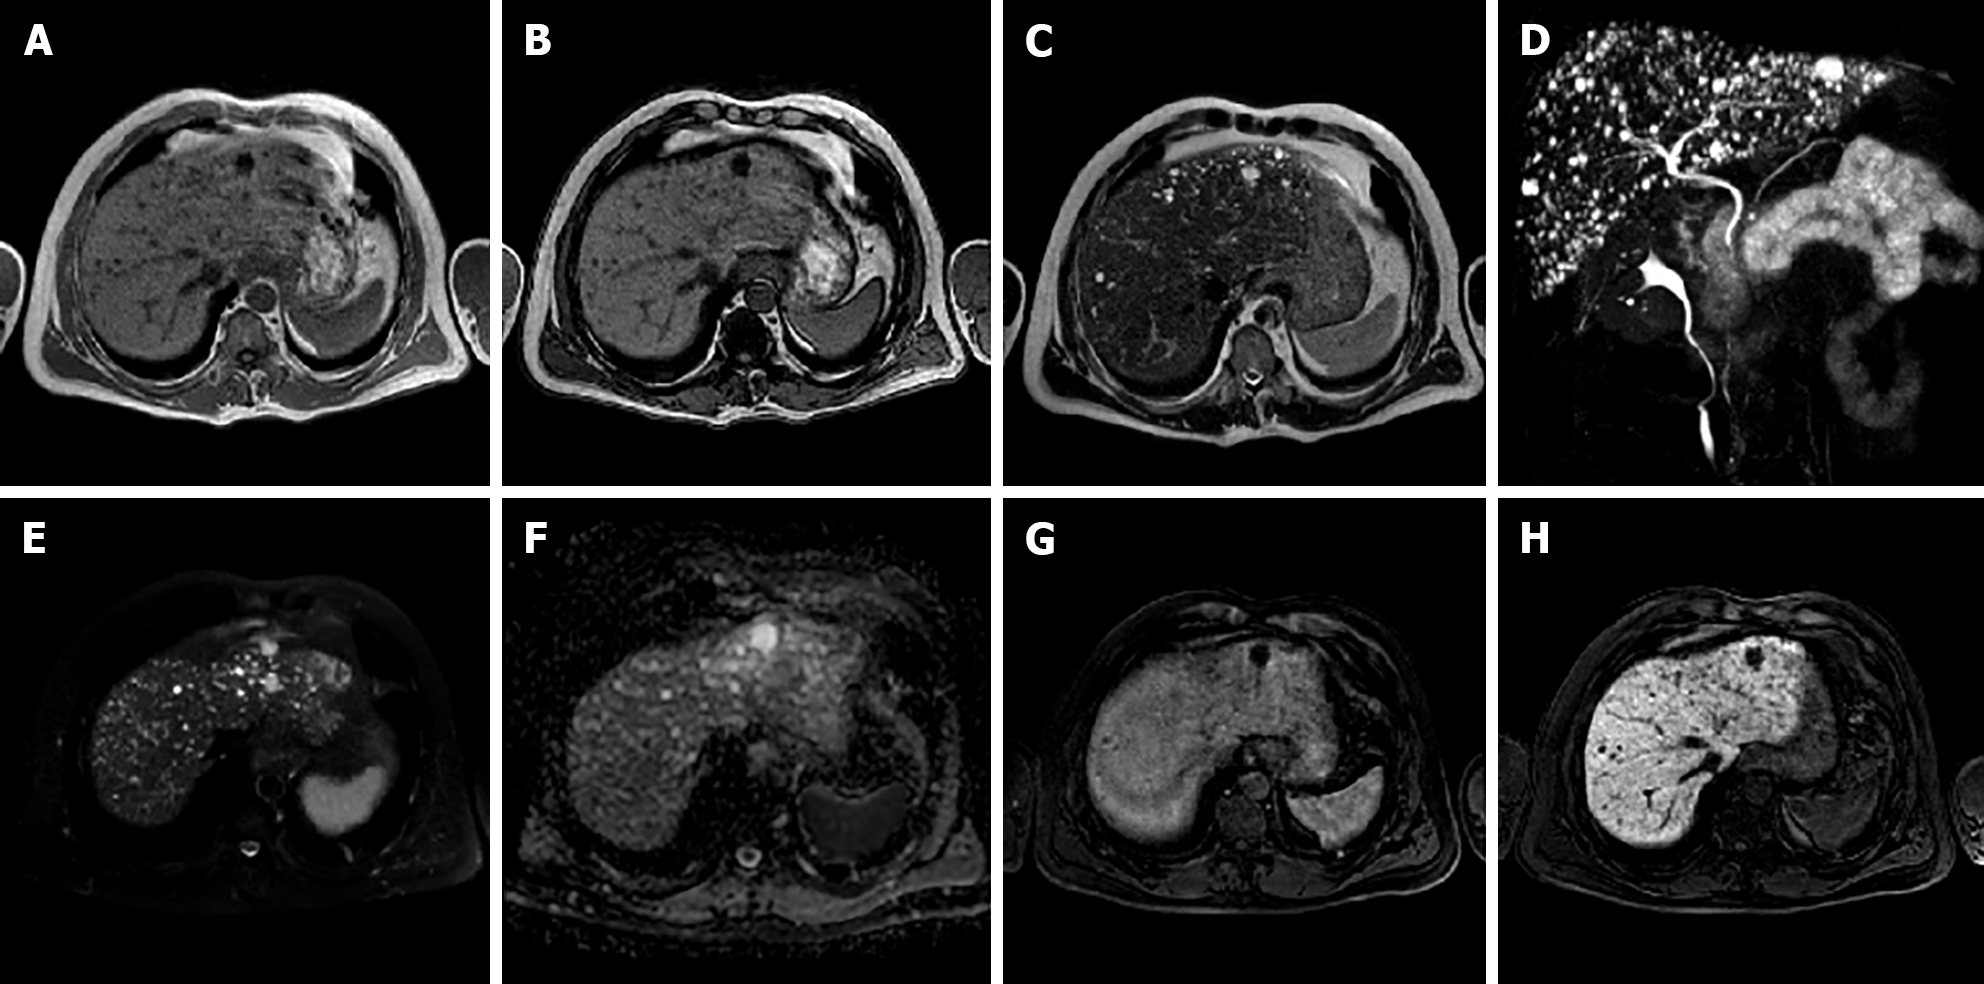
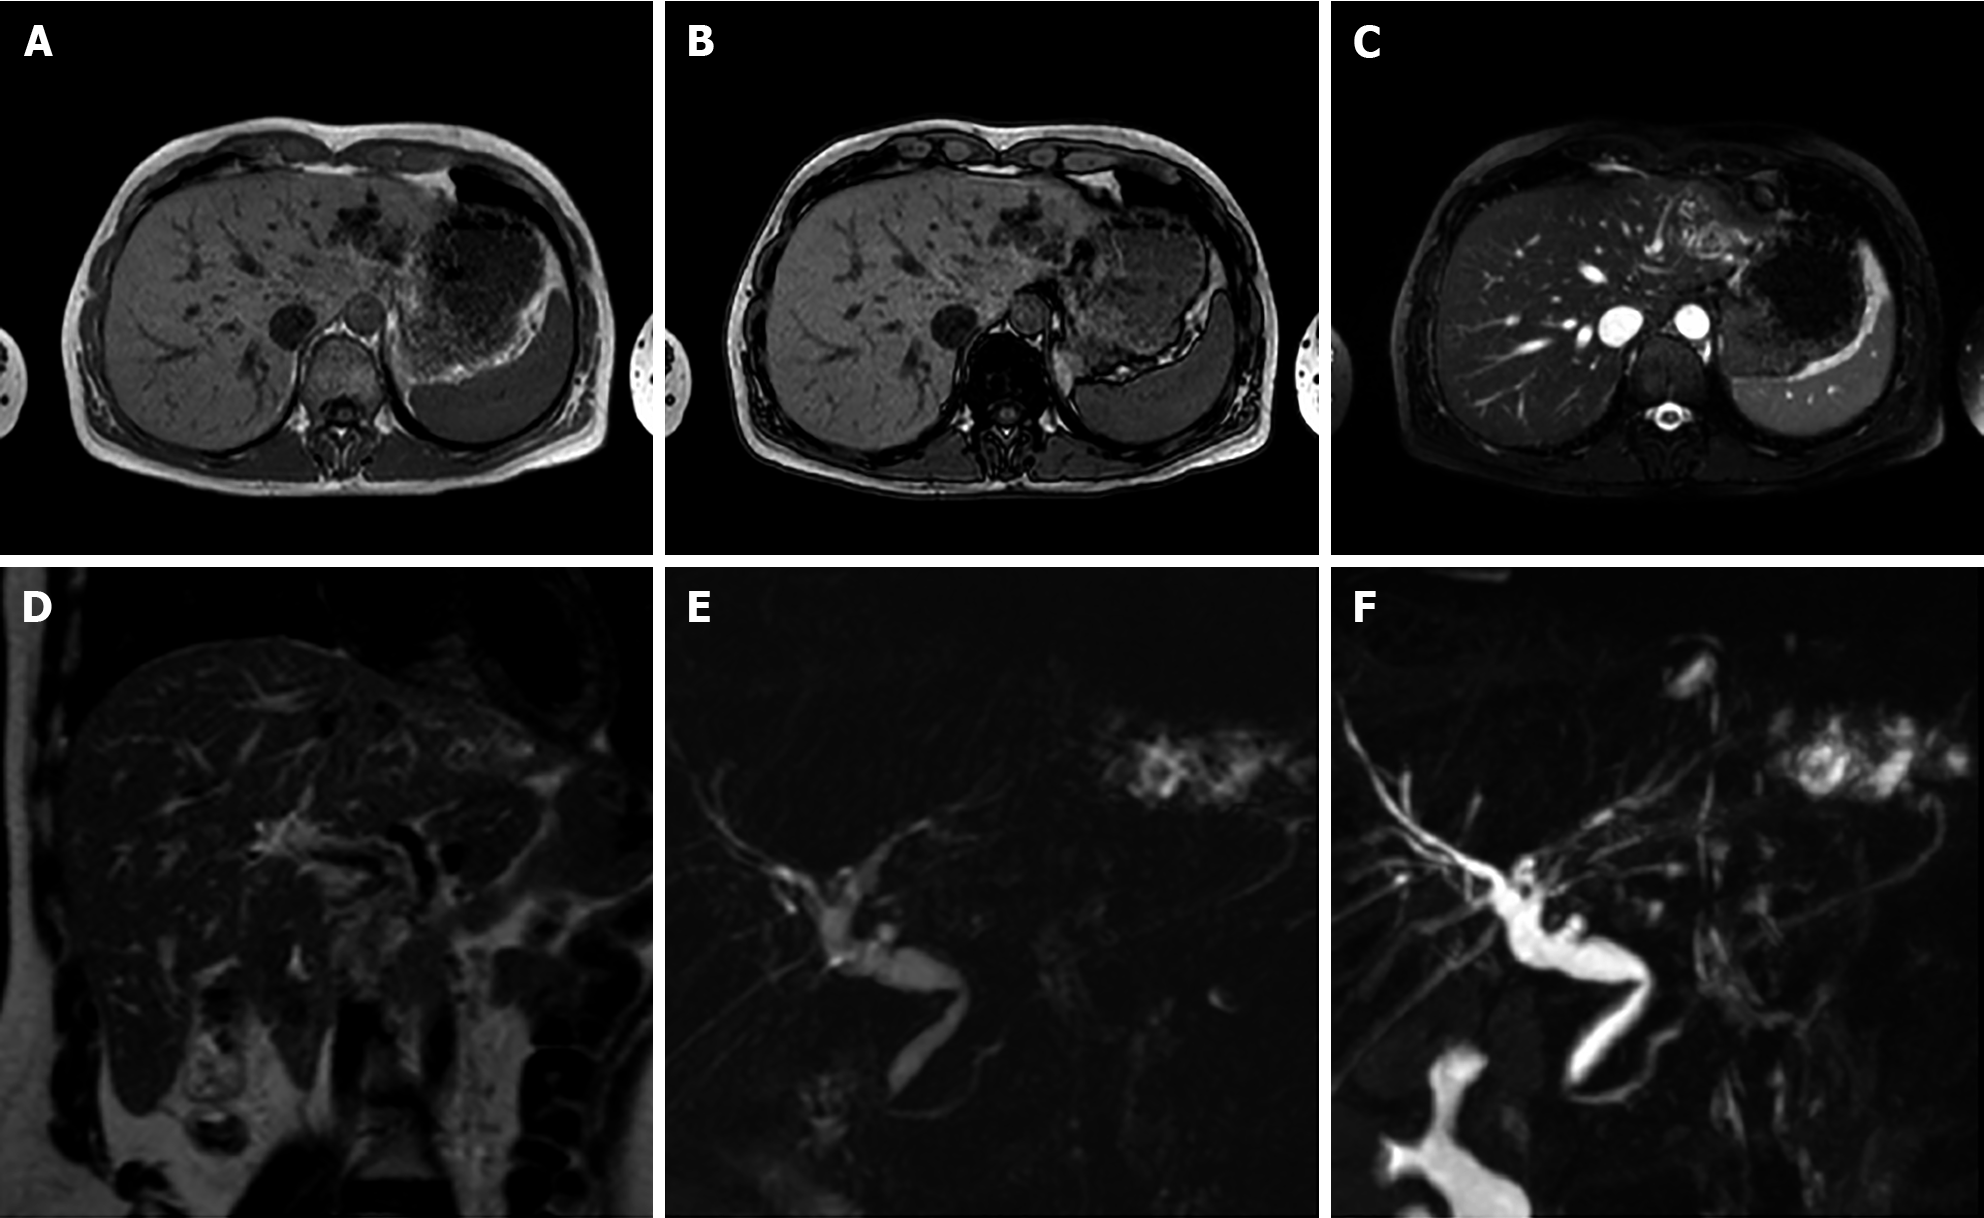
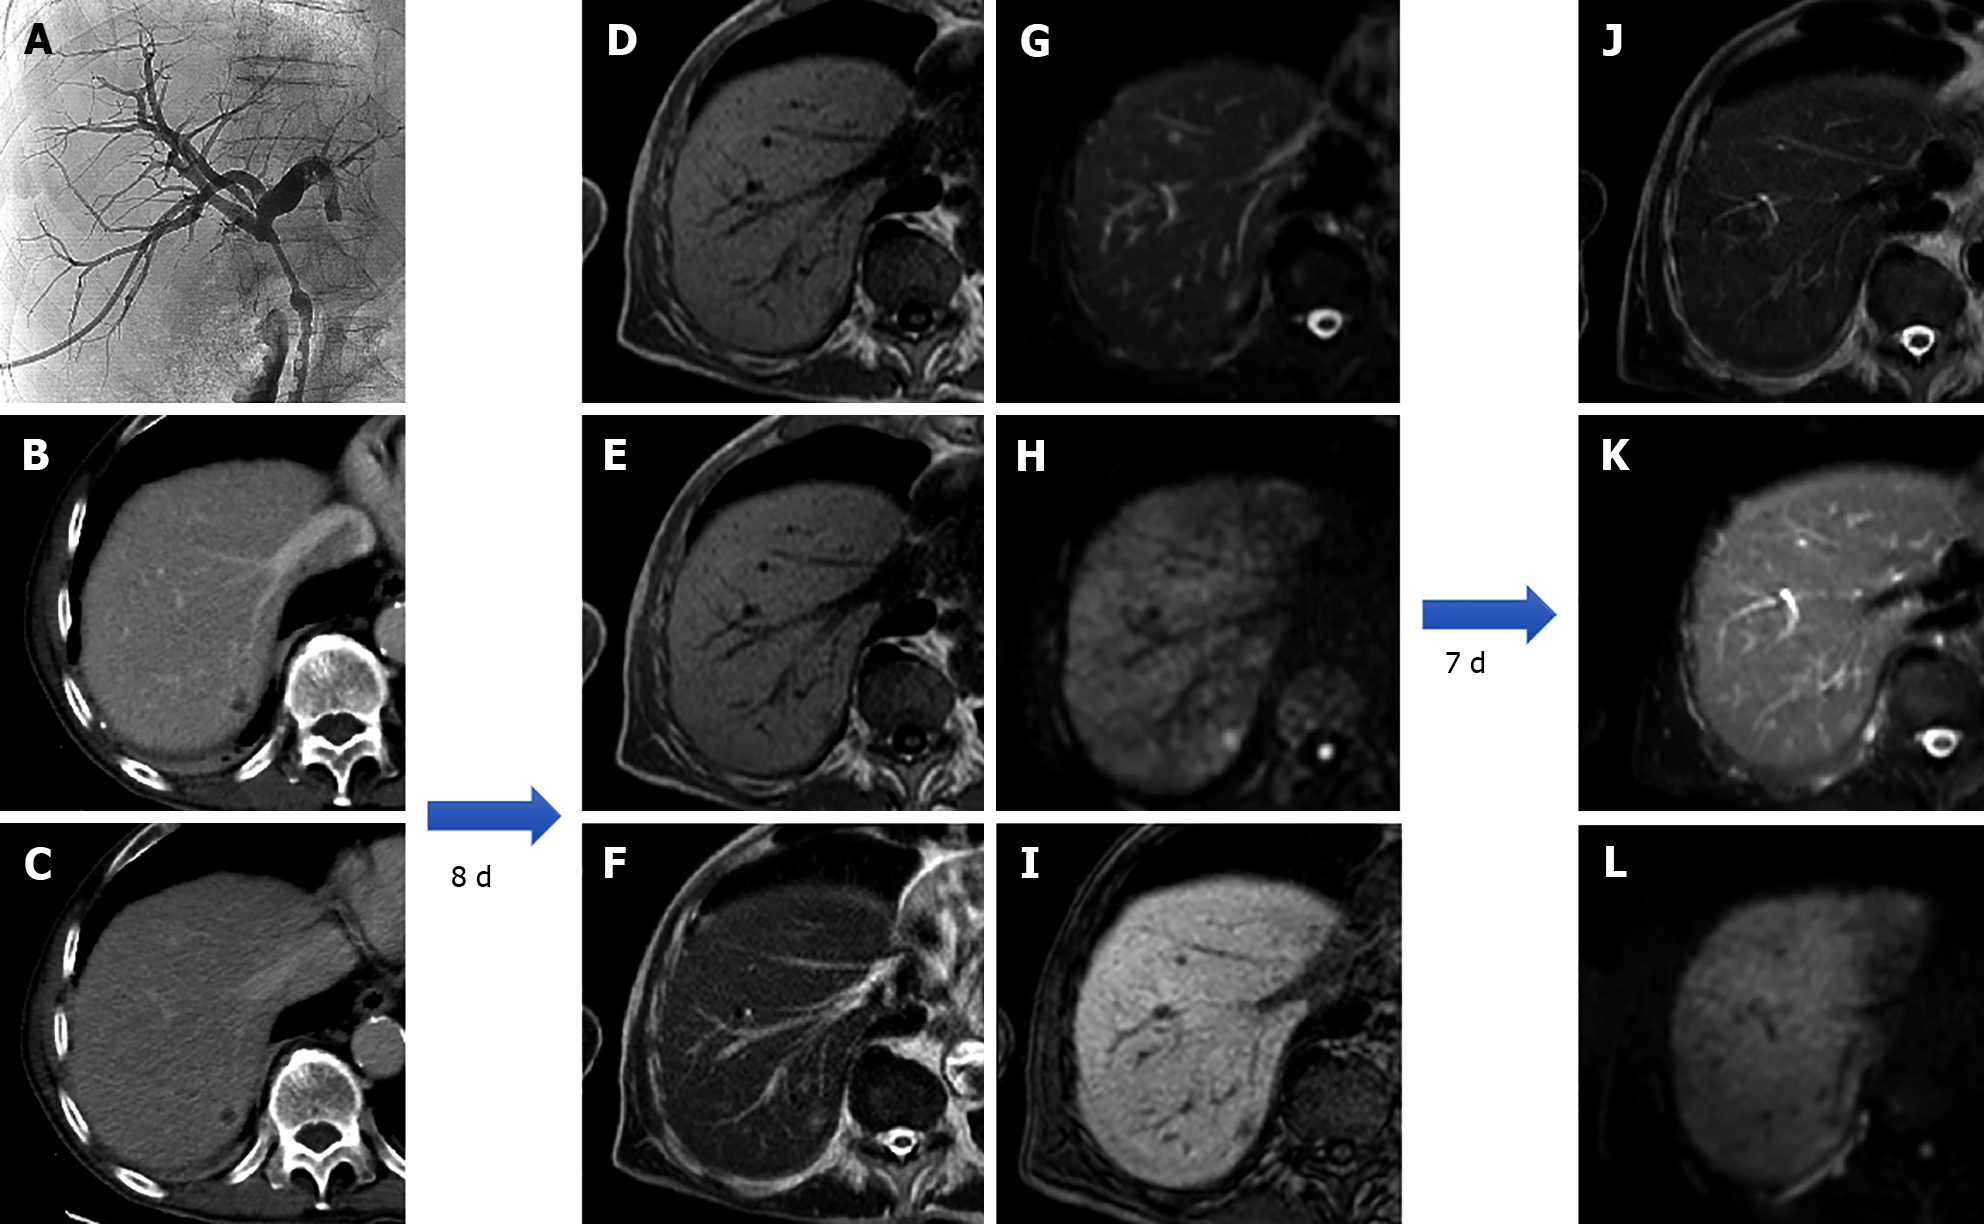
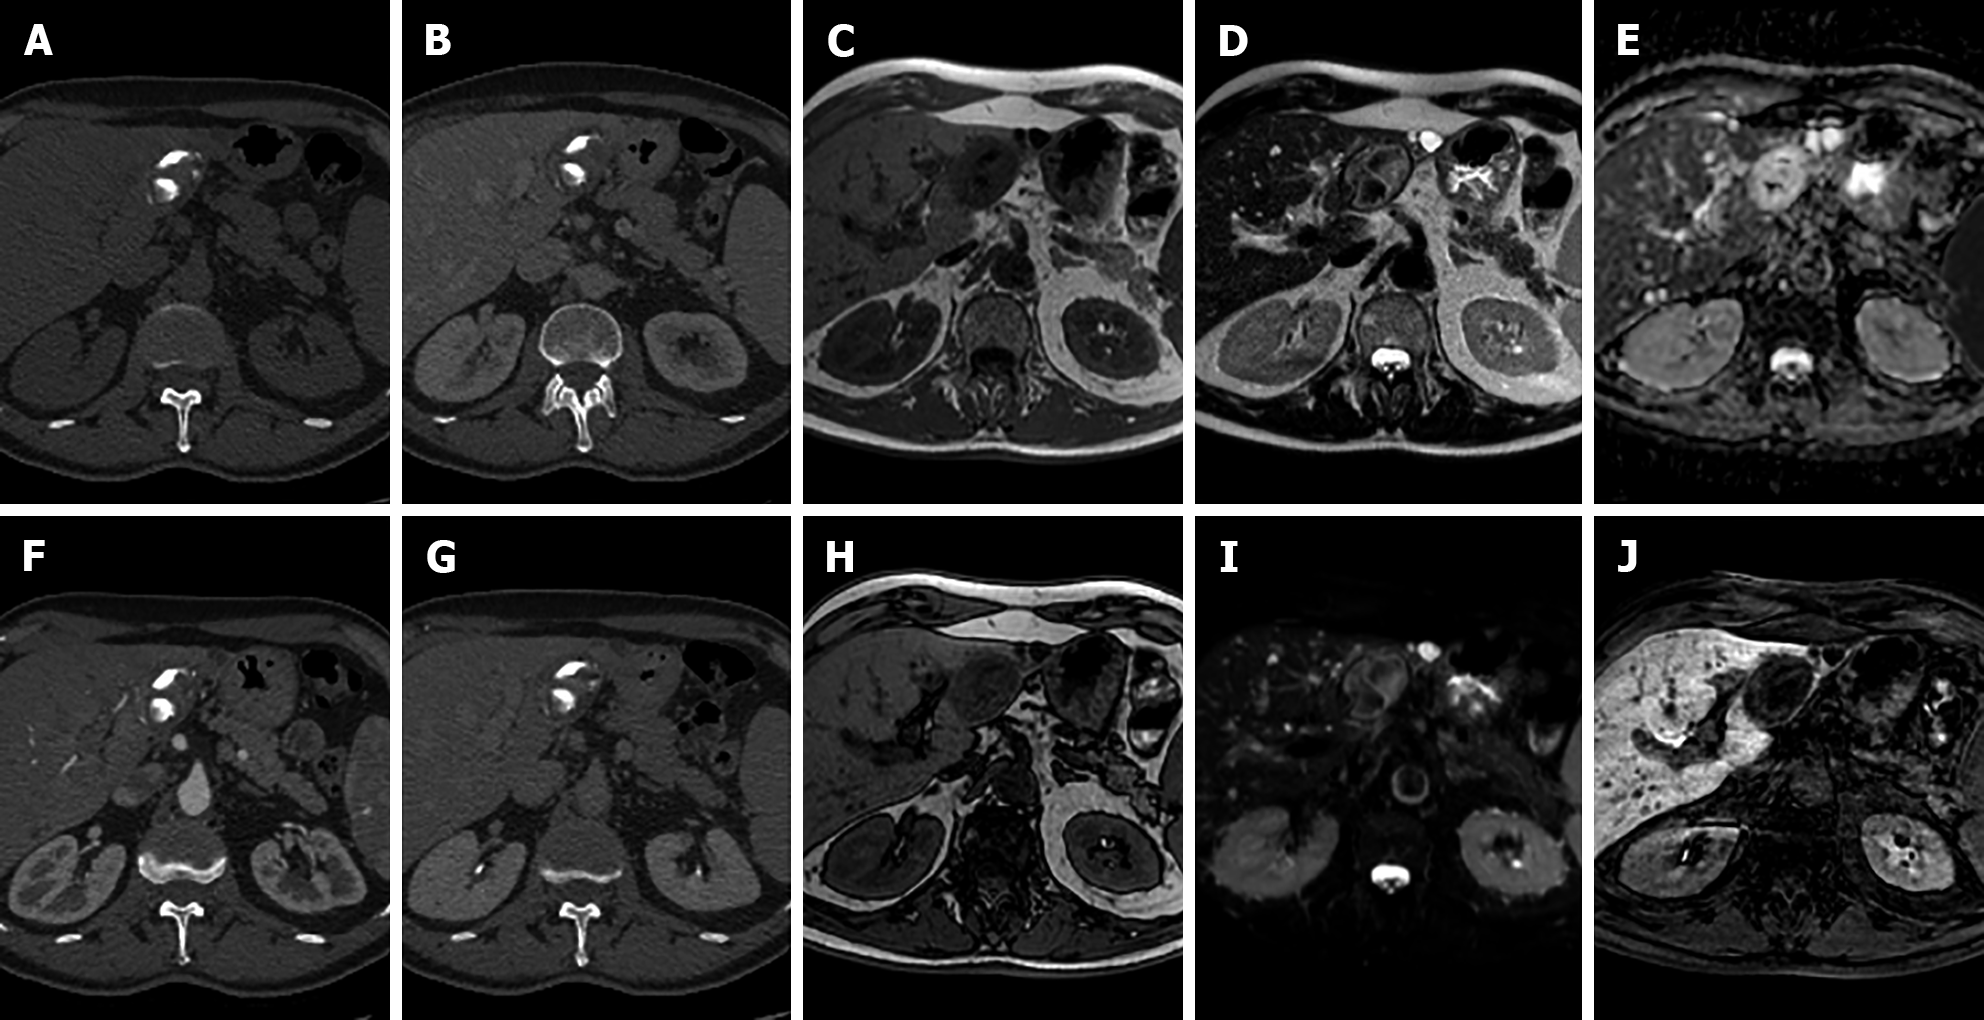
Histologically, bile duct hamartomas are generally small, less than 1 cm, often subcapsular, and composed of small dilated biliary ducts surrounded by biliary epithelium[35]. On T1-weighted images they typically appear as small hypointense lesions, with a strongly increased signal on T2WI due to its intrinsic cystic component especially on heavily weighted T2 sequences. These lesions can show the presence of small mural nodules (1-2 mm) with an isointense signal on T1-weighted and an intermediate signal on T2-weighted images. On dynamic sequences, the mural nodules can show enhancement during the portal-venous phase in about 90% of cases with no core enhancement. On cholangiography sequences, both intra- and extra-hepatic bile ducts are normally represented[36,37], while multiple hyperintense cystic lesions on T2-weighted images are uniformly distributed in the liver with no communication with the bile ducts, appearing as a ‘‘starry sky’’ configuration[38] (Figure 7). Biliary hamartomas should be carefully recognized in order to distinguish it from metastases, microabscess, simple liver cysts, and Caroli disease (Figure 8).
Hepatic HAs are the most prevalent benign mesenchymal liver lesions, with an estimated frequency of around 20% in the general population, and are up to five times more common in females than males[39]. HAs are frequently an incidental finding in asymptomatic patients during routine radiological examinations; however, because of their high prevalence, the differential diagnosis can become complex in patients affected by primary liver cancer or liver metastases. HAs are categorized by size: Small HAs are 1-2 cm, typical HAs are 2-10 cm and giant HAs have a diameter of more than 10 cm. Recent retrospective cohort studies demonstrated that up to 40% of HAs may grow during follow-up, with a slow growth rate (2 mm/year in diameter and 17.4%/year in volume)[39].
Microscopically, HAs appear as cavernous vascular spaces lined by endothelium and containing a fibrous stroma. Larger HAs may contain a fibrous nodule or a collagen scar. HAs are usually fed by vessels from the hepatic artery circulation, with a slow blood flow within the vascular spaces. HAs have been histologically categorized in 3 different subtypes, with some overlap among them: Cavernous, capillary and sclerosed.
This is the most common subtype, generally smaller than 3 cm with few internal connective components and with a prevalence of large vascular spaces[21]. The high water content of HAs causes homogeneous hyperintensity on T2-weighted sequences and poor signal intensity on T1-weighted images during MRI[40]. Giant HAs may present a central T2-weighted hypointense component in the case of hyalinized or thrombosed areas. If calcifications are present, they show very low signal intensity on all sequences.
On diffusion weighted imaging, HAs show hyperintensity on b0 s/mm2 images, with a progressive decrease in signal intensity at higher b values; the signal on the ADC map is greater than that of the nearby liver parenchyma. Some HAs have residual hyperintensity on high b value images (500-750 s/mm2) because of the “T2 shine through effect” making them more difficult to characterize; however, quantitative assessment with the ADC map make differential diagnosis easy as their signal is always higher than that of surrounding liver[41]. Following contrast injection, typical cavernous HAs exhibit peripheral nodular enhancement on the arterial phase, with centripetal progression and progressive filling on the portal venous and delayed phases; due to a lack of hepatocytes, they display a hypointense signal on the HBP[21] (Figure 9).
This accounts for almost 16% of all HAs, being smaller than 1 cm in about 40% of cases[42,43]. Microscopically it consists of small vascular spaces with abundant connective components. It presents high signal intensity on T2-weighted images and low signal intensity on T1-weighted sequences. In the case of hepatic steatosis, it shows a hyperintense signal on T1-weighted “chemical shift” images due to peritumoral sparing of fatty infiltration.
After contrast injection it is characterized by a “flash-filling” kinetic of contrast enhancement with early homogeneous enhancement, similar to that of the aorta in all phases[21]. Due to the presence of arterioportal shunts, fugacious perilesional parenchymal enhancement may be observed in extremely tiny lesions (less than 1 cm). Relative hyperintensity on delayed phases allows differential diagnosis with hypervascular metastases that are hypointense in the portal venous and delayed phases.
Sometimes HAs deteriorate, resulting in the development of severe fibrosis, which usually begins at the core of the lesion, obliterating vascular gaps and causing changes in MRI signal intensity. Sclerosed HAs may only present slight hyperintensity on T2-weighted images, generally localized at the periphery of the lesion. Owing to histologic lesion heterogeneity, the contrast enhancement pattern may be unusual. In most cases no early enhancement is present and there is a slow and inhomogeneous contrast progression. Late centripetal filling of the central scar might be present. Due to its rarity and heterogeneous radiological presentation, that can mimic hepatic malignancies such as CCC or metastases, the final diagnosis of sclerosed HA is often histological[8,21,42,44] (Figure 10).
Hepatic angiomyolipomas (HAMLs) are mesenchymal benign tumors composed of arteries, fat, and smooth muscle cells that are categorized into four subtypes based on their composition: Mixed (the most frequent form), lipomatous (containing 70% fat), myomatous (containing 10% fat), and angiomatous.
The fat components of a lesion might range from 10% to > 90% of the total lesion volume. Patients with tuberous sclerosis complex are more likely to have these tumors (5%-10% of the time)[45]. HAML is classified as a “Perivascular Epithelioid Cell Tumor” and is immunohistochemically positive for beta-hydroxy-beta-methylbutyrate-45, a monoclonal antibody for melanoma: This positivity is a clear diagnostic criterion, while other hepatic tumors are negative for this marker.
The radiological appearance of HAML is completely dependent on the proportions of these three components. Lipomatous HAML appear hyperechogenic on US, hypodense on non-contrast enhanced CT, hyperintense on in-phase T1-weighted sequences, and hypointense on out-of-phase T1-weighted sequences, indicating intralesional fat components[46] (Figure 11).
Lesions with minimal fat content (angiomatous or myomatous types) are more difficult to characterize and are frequently classified as HCC because of their appearance on morphologic sequences and after contrast injection: They show moderate to high signal intensity on T2-weighted sequences, hypointensity on T1-weighted sequences, and early dishomogeneous contrast enhancement during contrast-enhanced dynamic studies with CEUS, CT, and MRI, with longer duration[47].
Recent studies have established the utility of DWI-MRI with ADC values in the differential diagnosis of HAMLs and HCCs with fat components as HAMLs have higher values than HCCs with fat. Since HAML does not contain hepatocytes, it appears hypointense in the HBP[47].
Hepatic lymphangioma (HL), a malformation of the lymphatic system is a rare benign liver neoplasm. Most lymphangiomas are located outside the abdominal cavity, being less then 5% intra-abdominal, affecting primarily the small bowel mesentery, followed by the omentum, mesocolon, and retroperitoneum. Liver location is usually seen when lymphangiomas affect multiple organs, as in lymphangiomatosis. Solitary HL is rarely seen and could lead to clinical misdiagnosis[48,49].
HLs are histologically classified into capillary lymphangioma, cystic lymphangioma, and cavernous lymphangioma. They may occur at any age, with an average age of 30 years and a slightly higher incidence in females[48,50]. HL may be asymptomatic and incidentally found on cross-sectional imaging. The symptoms, if present, usually depend on compression of adjacent organs by the neoplasm[51].
Imaging appearances of HLs are various. On US they may be non-echoic, low-echoic, and mixed-echoic masses containing cystic and solid components within unicystic chamber or multichambers. On CT scanning a unilocular cystic mass shows low density and no enhancement. In some cases, it may present like a low-density mass with enhancement. For a multilocular mass with mixed components, enhancement is observed in the septum and solid parts but not in the cystic components. However, some cases described in the literature show atypical appearance, for example with wash-in and wash-out in the solid component mimicking malignancy[48,51].
MRI of HL shows a low signal on T1-weighted imaging, high signal on T2-weighted imaging, and occasionally mixed signals, related to intralesional bleeding that may occur. In the case of microcystic lymphangioma mistaken for a solid mass depending on its enhancement after intravenous injection of contrast, MRI with T2-weighted imaging may be very useful in the detection of multiple microcysts. The presentation of enhancement is similar to that of enhanced CT[48,52].
Diagnosis of lymphangioma is difficult due to a lack of typical symptoms and signs and differential diagnosis from simple cyst, BCA, BCAC, hydatid cyst, sclerosing HA, or HCC is very difficult[52]. Definitive diagnosis relied on pathological examination, that can be necessary in a cirrhotic liver with a lesion diameter less than 2 cm and if the cystic appearance is not predominant on imaging[48].
Macroscopically, the cysts resemble unilocular cysts or multilocular cysts of varying diameters with a septum, some of which have solid material or are filled with clear serous fluid, chylous fluid, and blood clots. Solid components have the microscopic appearance of fibrous hyperplasia, whilst liquid components are made up of a high number of cystic-dilated lymphatic lumens lined by simple squamous endothelium and filled with lymph. If morphology is insufficient to make a diagnosis, lymphatic markers and D2-40 (podoplanin) may be used to confirm the condition. Furthermore, endothelial markers such as von Willebrand factor, CD31, CD34, and two lymphatic markers (LYVE-1 and Prox-1) are utilized to identify lymphatic vessels from blood vessels immunohistochemically[53].
Solitary fibrous tumor (SFT) is a rare soft tissue neoplasm that originates from mesenchymal tissue. It was first reported in 1931 as an intra-thoracic mass arising from the pleura. Even if cases of SFT have been reported to originate in organs external to the thorax, hepatic location is extremely rare, accounting for less than 100 cases in the literature[54,55].
Liver SFT appears as a large, well-defined and heterogeneous single lesion that usually involves the right hepatic lobe, with a median tumor size of 17 cm[54,56]. It may occur at any age, with a prevalence in middle-aged women[56]. SFT is asymptomatic in 80% of patients. Symptoms depend on tumor effects, including pain, weight loss and nausea, and less frequently weakness, fever and hypoglycemia. Laboratory parameters are usually non-specific[57]. SFT does not reveal specific findings on imaging examination.
Ultrasonography often shows a heterogeneous mass that may be low-echoic, hyperechoic or both, with or without calcifications. On CT scan it shows early arterial enhancement with delayed venous wash-out. MRI may reveal a heterogeneous lesion, slightly hyperintense on T2-weighted sequences and hypointense on T1-weighted sequences, with a high signal on DWI[55]. In some cases reported in the literature, the imaging appearance of SFT with gadoxetic acid shows heterogeneous enhancement on arterial and portal phase images and homogeneous hypointensity on HBP[54,58].
As these findings are non-specific and mimic those of HCC or leiomyomas, the diagnosis of SFT is challenging, as these tumors have no typical symptoms and signs[55]. A definitive diagnosis relied on histopathological and immunohistochemical studies[55]. On histology, SFT is characterized by fibroblast-like spindle cells within thick collagen bundles, with patternless architecture in which hypo and hypercellular areas coexist; collagenous stroma contains hemangiopericytic vessels. Immunohistochemical reactions are usually positive for CD34 in most of cases, but the specific immunohistochemical marker of SFT is STAT6[55,59].
The biological behavior of SFT is controversial, in fact it may show malignant potential, as described in some reported cases of metastasis or recurrence[54,57,59]. England et al[60] in 1989 reported malignancy criteria: the presence of intratumoral necrosis or hemorrhage, mitotic changes, pleomorphism of cellular nuclei, metastasis, large dimensions (more than 10 cm) and cellular atypia[59].
Mesenchymal hamartoma (MH) of the liver is a rare benign tumor that originates from an anomalous development of primitive portal mesenchymal tissue, comprising predominantly of a mesenchymal stromal component and an aberrant malformed biliary structure with a small amount of hepatic lobules[61].
This neoplasm usually affects children mainly in the first 2 years with a slightly male predominance and it accounts for 8% of liver tumors in children[61-63]. Liver MH appears as a large benign multicystic/solid cystic liver mass, sometimes pedunculated, arising in the right lobe of the liver in 75% of cases[64].
MH has non-specific clinical manifestations, usually depending on the size of the tumor, which can reach up to 30 cm. Patients may present with hepatomegaly, a non-tender abdominal mass causing occlusion of the inferior vena cava or dyspnea and sometimes with fever, weight loss or vomiting. Alpha-fetoprotein is usually normal[61]. Imaging appearance depends on the cystic, solid/cystic or solid predominance of the tumor[61,64].
US often shows a complex cystic mass with internal septation[65]. On CT scan it shows a heterogeneous appearance with enhancing stromal elements and cystic components with water attenuation[64]. The stromal component may be predominant in some cases, although cystic components are more frequent and may vary in size; if the lesion is predominantly cystic it may range from a “swiss cheese appearance” if cysts are small, into a multilocular cystic lesion with septa, if the cystic components are large[61,64]. MRI appearance depends on the cystic vs stromal composition of the neoplasm and on the protein content of the fluid. The solid component may be hypointense to adjacent liver both on T1-weighted and T2-weighted sequences due to fibrosis. Cystic components usually show signal intensity similar to water on T2-weighted images and may have variable signal intensity on T1-weighted sequences owing to the protein content of cystic areas. After injection of gadolinium only stromal components and septa were enhanced[64].
On histology, a fibromyxoid connective background with bland spindle cells characterizes MH with branching bile ducts, thick walled vascular channels and scattered island of hepatocytes in the periphery of the lesion[66]. The biological behavior of MH is benign, although cases of malignant degeneration in undifferentiated embryonal sarcoma are described in the literature[65].
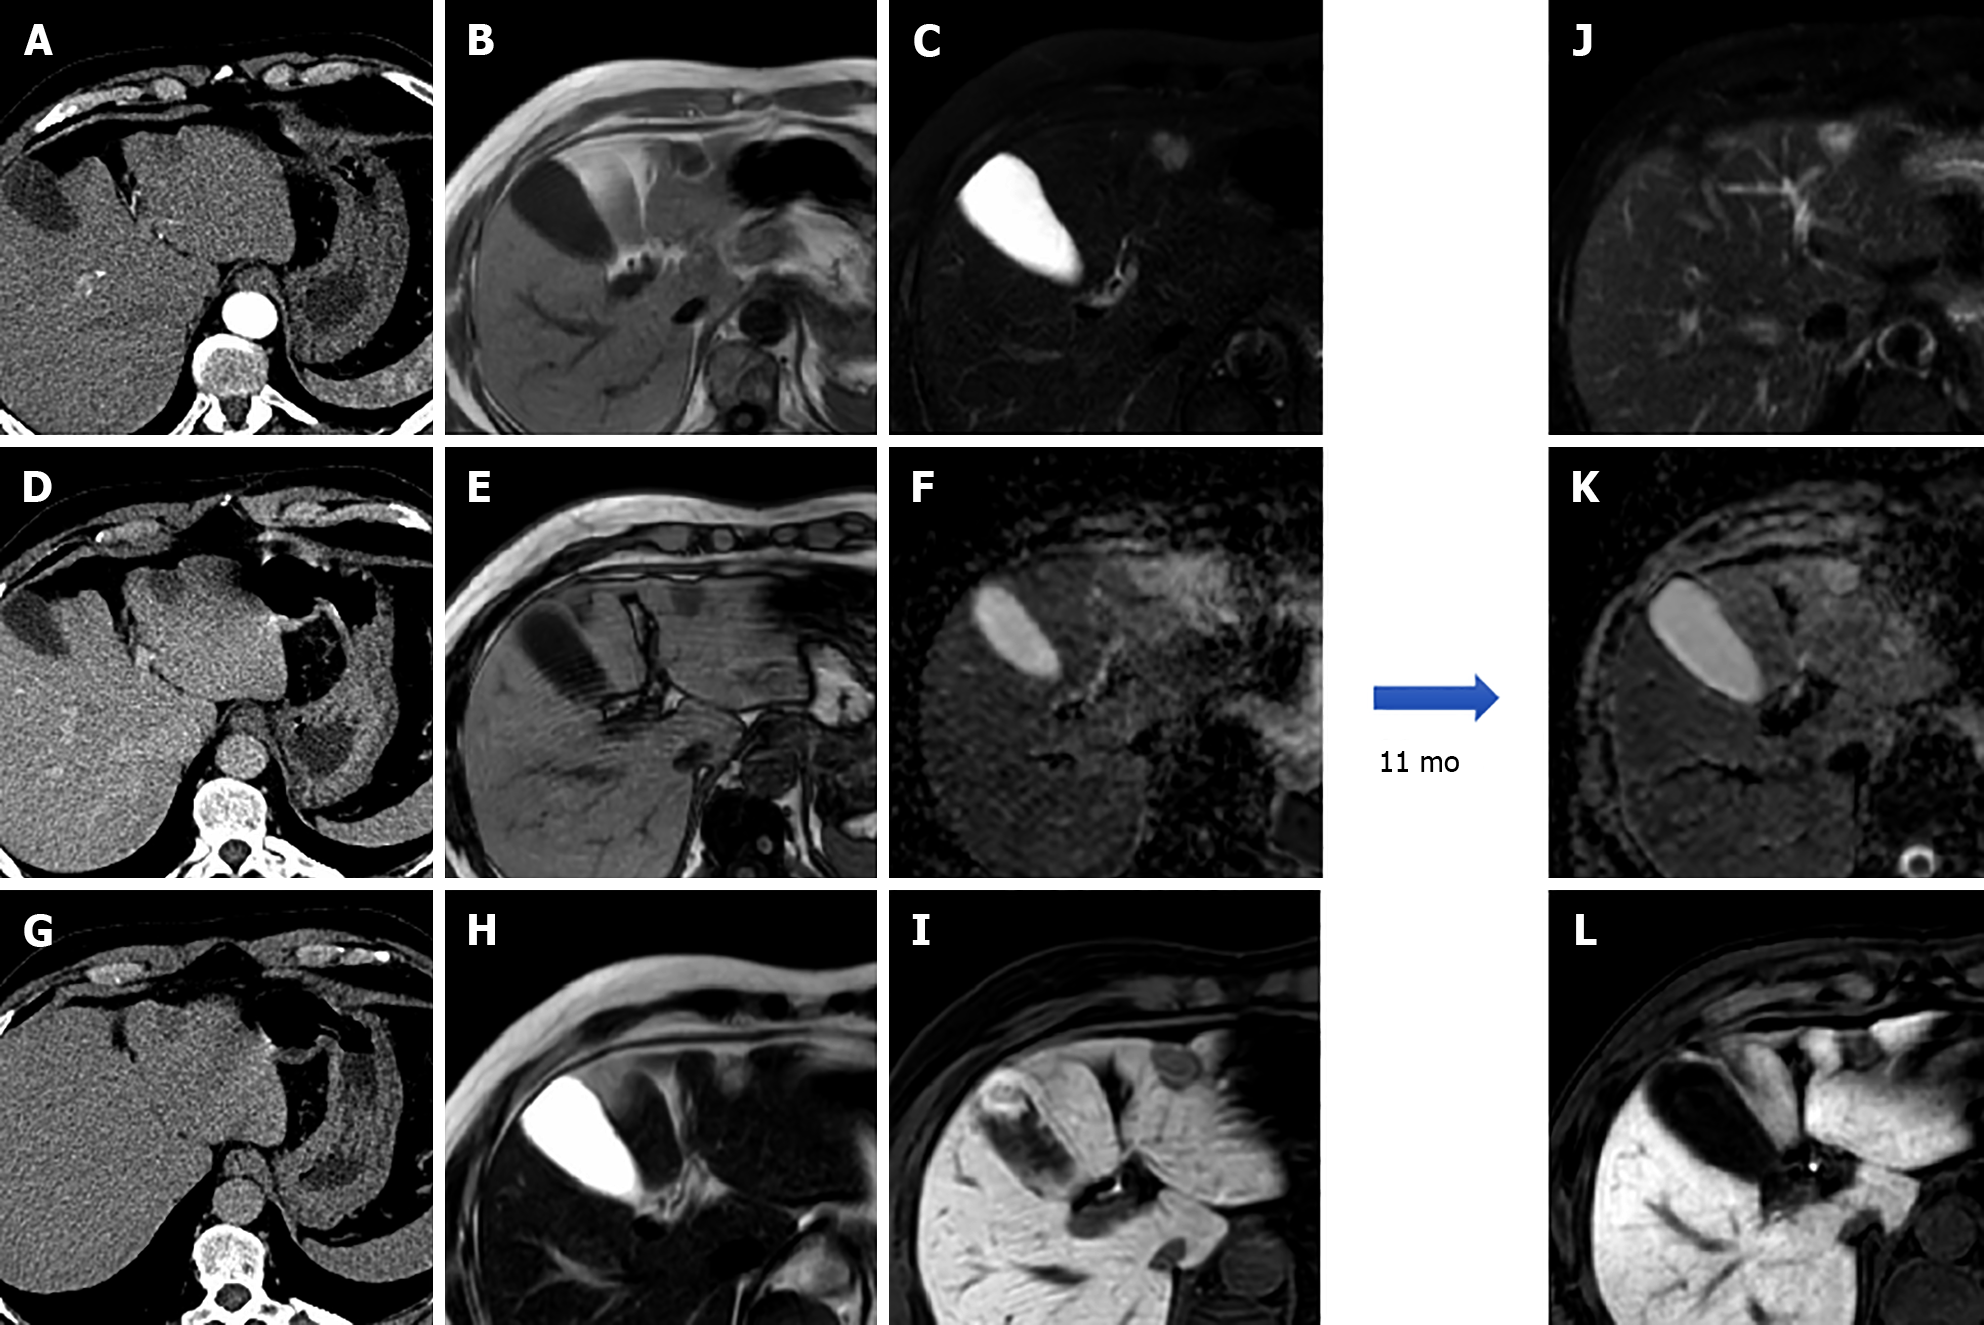
Focal fatty hepatic infiltration can be easily recognized using the standard liver MRI examination, based on T1-weighted in-phase/out-of-phase and T2-weighted images, which in the latter shows a slight hypointense signal. However, in some cases, these focal areas can be misdiagnosed as focal liver lesions and they have to be assessed using dynamic contrast enhancement and HBP imaging. Considering the physiological GD-BOPTA and Gd-EOB-DTPA uptake by normal hepatocytes, the focal fatty infiltration or hypersteatosis areas have decreased contrast enhancement due to a reduced number of functioning hepatocytes or atypical vascularization. Moreover, in the case of nodular-shaped focal fatty infiltration, its differential diagnosis with a fat-containing liver lesion can be challenging. In this setting, a wedge or pyramidal shape and the lack of mass effect are useful features to distinguish a focal fatty lesion from a focal liver lesion[67] (Figure 12).
Yeom et al[68], by evaluating 27 focal fat deposition areas, reported a homogeneous or heterogeneous enhancement during the dynamic study, both in the arterial and portal venous phase, with hypointense signal during HBP. On the other hand, fat spared areas do not show any signal drop-off during in-phase/out-of-phase imaging and may induce increased signal intensity on HBP due to preserved or increased focal liver function[69].
The liver abscess, defined as a localized collection of inflammatory products caused by bacterial, fungal or parasitic agents, can be easily diagnosed with all imaging techniques, but is best with US and CT. MRI can help to distinguish between uni- and multi-focal necrotic lesions disseminated through the liver parenchyma. In this setting, the typical appearance of liver abscess during the standard MRI protocol can support the final diagnosis, based on the iso- to hyperintense appearance on T1-weighted images due to the presence of proteins, hemorrhagic foci, or inflammatory degradation products, without a significant drop-off in signal during in-phase/out-of-phase imaging. T2-weighted imaging is useful for determining not only the amount of free water inside the lesion but also to identify the slight peripheral hyperintense area due to edema or peripheral inflammation. Usually, on DWI an abscess presents a high restricted diffusion with very low values of ADC because of the high viscosity of inflammatory debris and cellularity[21] in the necrotic cavity, while no diffusion restriction is seen peripherally. Furthermore, as reported by Park et al[70], DWI is helpful in differentiating hepatic abscess from malignant mimickers considering the higher peripheral restriction in the case of malignancy with 98% diagnostic accuracy.
During the dynamic study, liver abscess typically shows a peripheral rim enhancement, in particular on the portal-venous and delayed or transitional phase, due to the presence of a pseudocapsule and inflammatory cells. During the HBP, the core typically does not change in appearance, while the peripheral area can show an ipo- to isointense signal, due to edema or the normal function of hepatocytes, respectively (Figure 13).
Although size, shape, number, and signal intensity can help to establish a differential diagnosis, the only pathognomonic signs are the presence of air bubbles within the lesion or an air-fluid level[71], seen as a single or multiple flow-void foci. The most important differential diagnosis of liver abscess is metastasis. As mentioned above, liver metastasis can be recognized due to the different signal intensity on T2-weighted images and DWI with a slight and clear hyperintense appearance, respectively, as well as during the dynamic study, in particular with a poor peripheral ring enhancement due to the presence of pathological cells. On the portal-venous and transitional phase, solid liver metastases present an isointense signal while abscess shows a hypointense signal.
To date, only one study has evaluated the importance of Gd-EOB-DTPA in distinguishing between hepatic microabscesses and metastasis: Choi et al[72], by enrolling 72 patients, demonstrated that perilesional edema and arterial rim enhancement were maintained during the following dynamic sequences. Also the size discrepancy between T1-weighted and T2-weighted images and between T1-weighted and HBP images, allow a high diagnostic accuracy for microabscess (90.9%).
Different tapeworms belonging to the Echinococcus genus can infect humans, both as the intermediate or definitive host. The two most important types of disease are cystic echinococcosis and alveolar echinococcosis, caused by Echinococcus granulosus (E. granulosus) and E. multilocularis, respectively.
This subsection will focus on E. granulosus considering its higher incidence and global distribution in all countries except Antarctica[73]. Sheep and pigs are definitive hosts of E. granulosus and typically excrete hundreds of eggs within their feces. Intermediate hosts, such as dogs, cats, or humans, can eat these eggs directly or indirectly via contaminated water, food, or soil[74]. The tapeworm, following the blood vessels typically stops in the liver more frequently in the right lobe, where it starts growing as a cystic lesion, with a growth rate ranging from 1-2 mm to 10 mm per year. Cysts are composed of two layers of membrane: A germinal and an outer layer. The immune system responds to the cyst by forming a capsule that during years will be completely calcified[74].
When performing MRI, it should be taken into account that cystic echinococcosis can show different imaging features according to the parasitic stage in the infected liver. In the first stage of infection, a rounded, thin-walled cyst is recognizable, showing an inhomogeneous signal in T1-weighted images, hyperintense in T2-weighted images, with only peripheral enhancement best seen on the portal-venous or delayed phases. During cystic growth, it is possible to observe the typical echinococcosis cyst features, appreciable in approximately 75% of cases: The daughter cysts within the main cyst may produce a honeycomb-like structure with a typical thin peripheral capsule, hypointense both in T1-weighted and T2-weighted images. When the daughter cysts grow, the pressure inside the whole cyst can lead to their collapse or rupture into the biliary tree or peritoneal seeding: Under this circumstance, the internal appearance may vary according to the amount of cystic debris, especially on T2-weighted images (Figure 14). Finally, the dead cyst is composed of a solid matrix, due to the immune response manifesting with the peripheral calcified layer, from partial to complete, that can be seen in about 50% of cases[75].
Hepatic inflammatory pseudotumor, even if rare, has an unknown etiology and can manifest itself as a consequence of different immune responses, such as infective agents, including viruses (such as Epstein-Barr virus), bacteria and fungi (nocardia and actinomycosis), primary and secondary liver tumors including hepatic lymphoma[76], and as the hepatic manifestation of immunologic disease, such as IgG4-related disease[77], inflammatory bowel disease[78], and, finally, a response to a foreign body[79].
Hepatic pseudotumor can present as single or multiple lesions with a wide range of distribution, including liver parenchyma, peri-portal spaces, and peri-biliary ducts. On unenhanced MRI it can show a hypointensity signal on T1-weighted images, without any signal drop-off during in-phase/out-of-phase imaging, with variable signal intensity on T2-weighted images strictly linked to the presence of acute edema or, if chronic, fibrosis can be present. In line with the T2 signal, the pseudotumor can show areas of signal restriction on DWI, typically peripheral, due to the high cellularity of inflammatory cells.
Considering the mixed content within the lesion, during dynamic sequences the enhancement can be different. It can mimic a CCC with peripheral enhancement during the arterial phase with a delayed central-filling, in the case of diffuse fibrotic components; heterogeneous enhancement can be easily identified in the case of acute or subacute findings, while chronic lesion variable enhancement can be present. Sometimes it can also show internal septa with delayed enhancement. On HBP imaging, pseudotumor typically manifests as a hypointense lesion due to the small number of functioning hepatocytes, surrounded by fibro-inflammatory components. The abovementioned features were confirmed by a recent study published by Ichikawa et al[80], in which the typical appearance of pseudotumor was demonstrated, a central hypointense signal with a relatively peripheral hyperintensity on HBP, helping the differential diagnosis with colorectal liver metastasis.
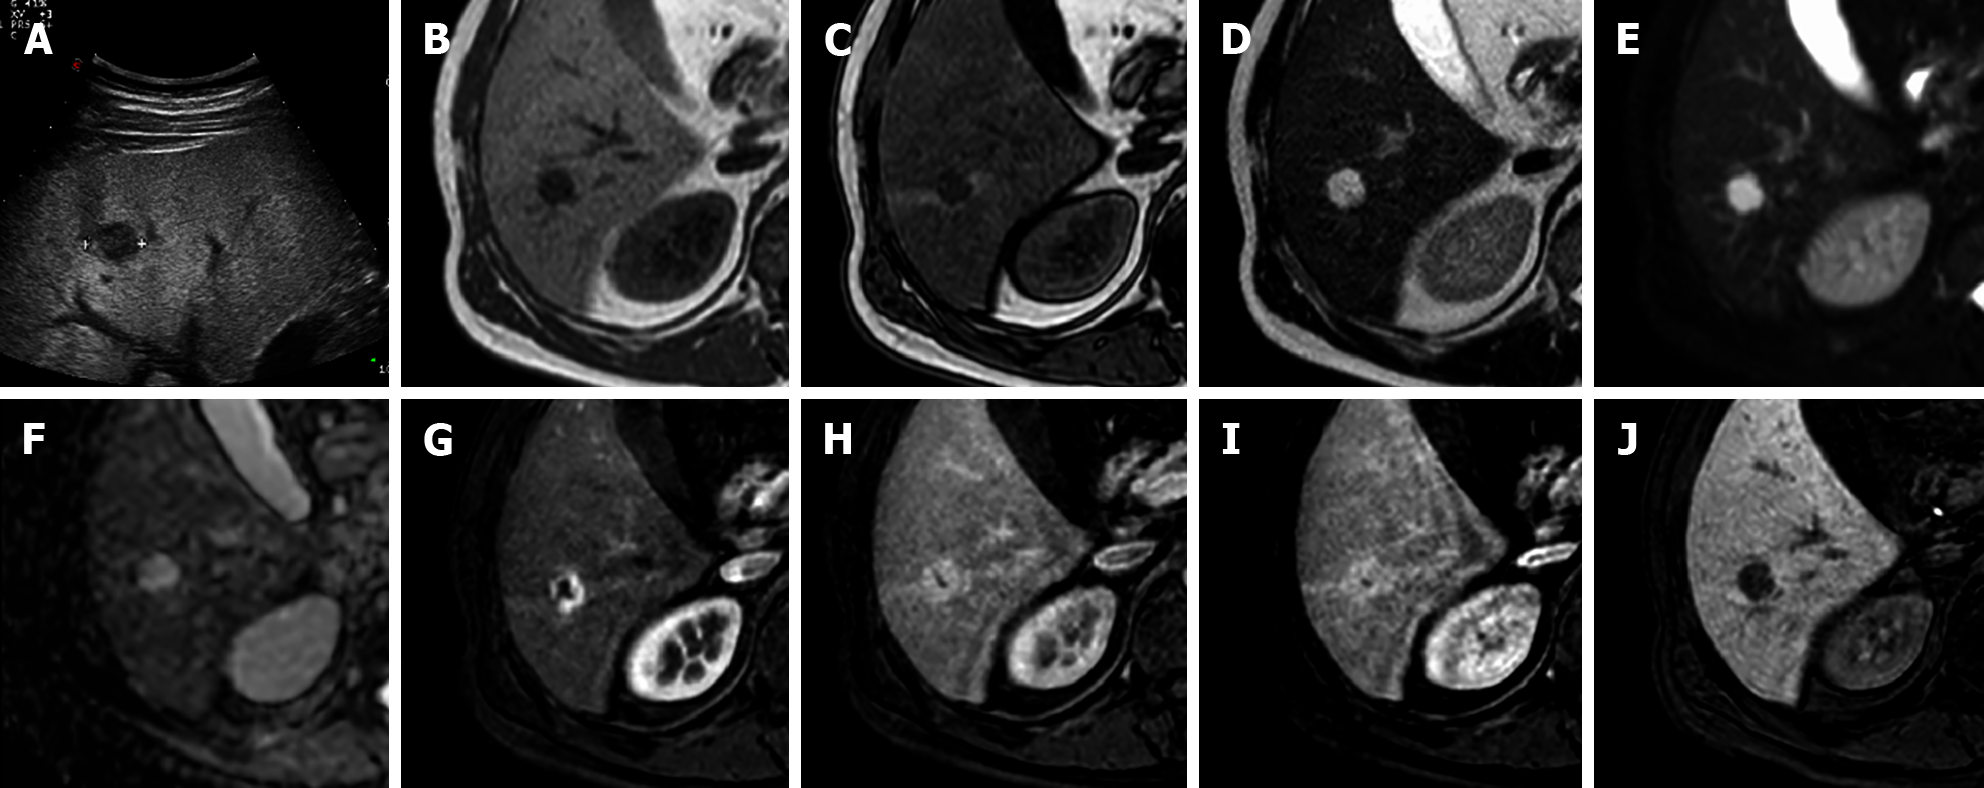
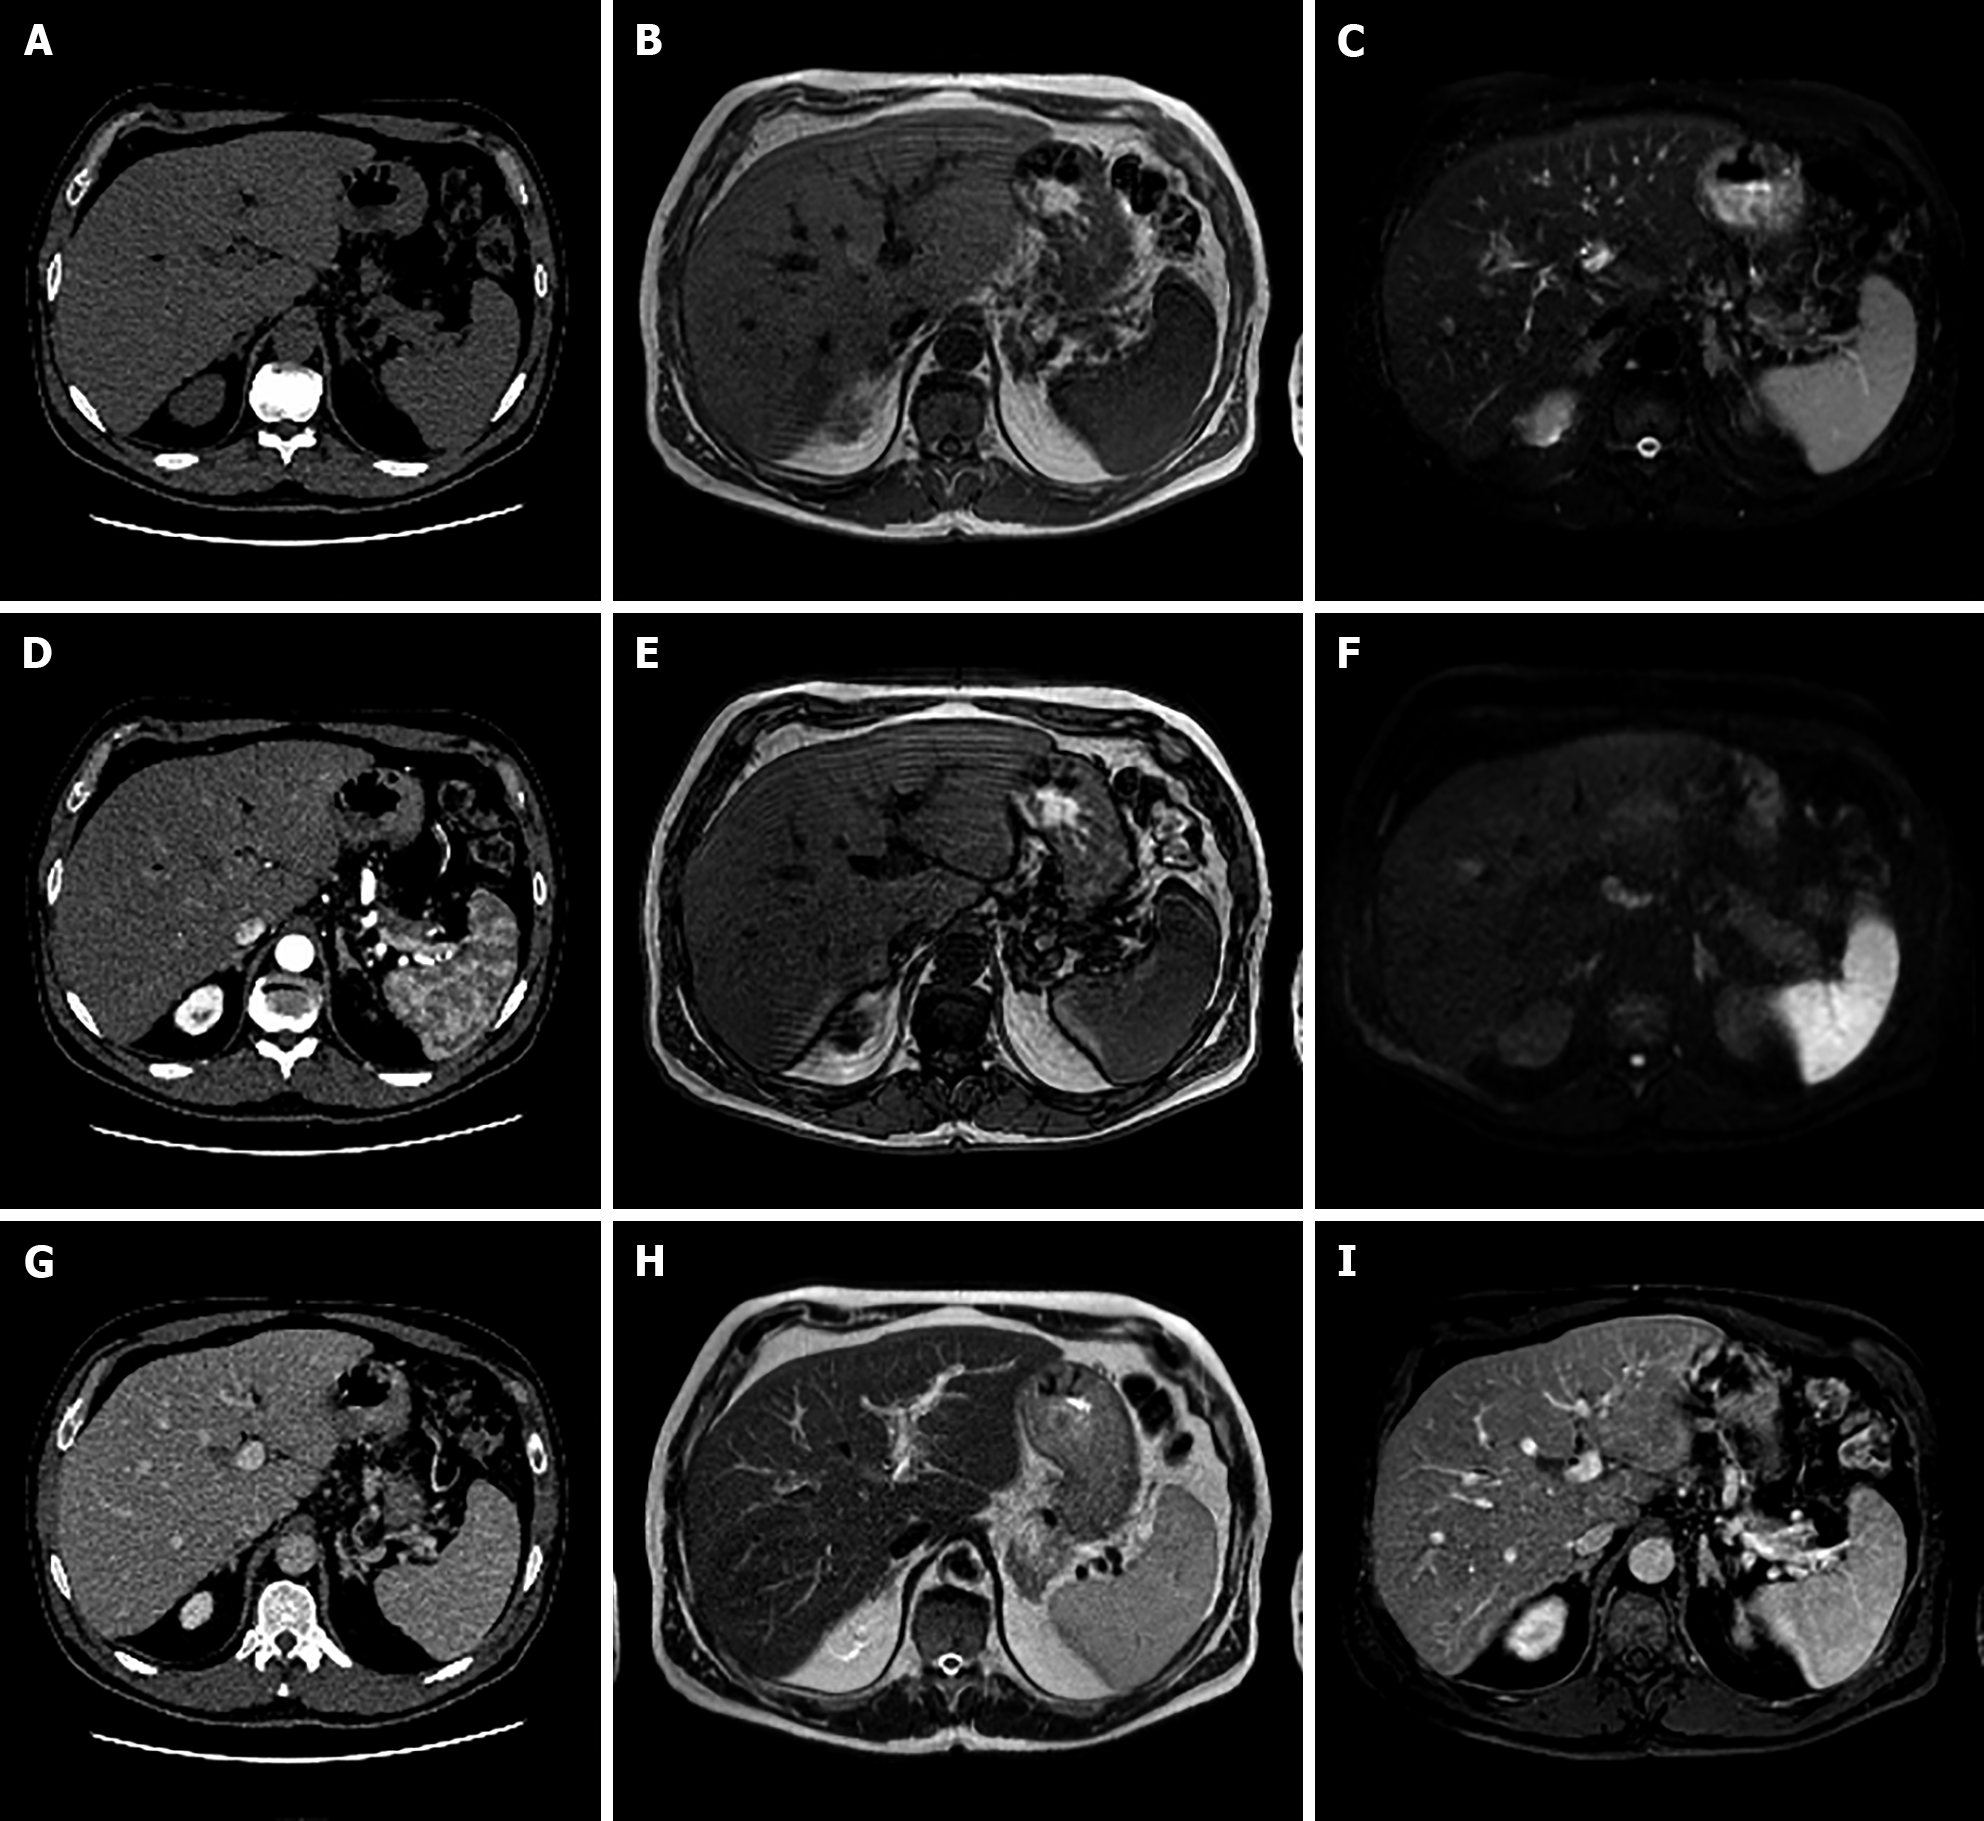
Even if typically considered a thoracic disease, sarcoidosis can involve all human organs, with an estimated 50% of patients with extra-thoracic manifestations[81]. Based on the underlying pathophysiology, it can manifest as hepatomegaly with possible jaundice and with manifestations of portal hypertension, even if not commonly reported. Thus, liver MRI should be performed to exclude the presence of focal liver lesions. In patients with sarcoidosis the typical changes due to liver fibrosis were the most common findings, underlining that only 25% of patients showed normal liver morphology with no radiological signs of portal hypertension. In this setting, focal hepatic and splenic nodules were seen in about 25% of subjects at presentation, demonstrating coalescing granulomas sometimes confluent and mimicking malignancy[82]. The sarcoidosis nodules are usually hypointense on T1-weighted images, without any changes on in-phase/out-of-phase imaging, while a variable signal on T2-weighted images can be seen, ranging from hypo to hyperintensity, strictly linked to the amount of edema both intra- and peri-lesional. During enhanced sequences, these lesions may show a slight and peripheral enhancement on the arterial phase while during the next sequences, including the HPB, the lesions show hypointense signals (Figure 15). Sometimes the sarcoidosis can manifest exclusively with chronic liver failure.
Liver lesions are common findings in radiologists’ daily routine. They are a complex category of pathology that ranges from solitary benign lesions to primary liver cancer and liver metastases. Liver MRI is a fundamental radiological method in these patients as it allows with its multiparametric approach an optimal non-invasive tissue characterization. Liver MRI can be used to differentiate between pseudotumors and tumors, as well as benign and malignant lesions, and it can also be utilized for differential diagnosis. Although histological examination can be useful in making a definitive diagnosis, liver MRI is an important modality in the diagnosis of liver lesions with a significant impact on patient care.
Provenance and peer review: Invited article; Externally peer reviewed
Peer-review model: Single blind
Specialty type: Gastroenterology and hepatology
Country/Territory of origin: Italy
Peer-review report’s scientific quality classification
Grade A (Excellent): 0
Grade B (Very good): B
Grade C (Good): 0
Grade D (Fair): 0
Grade E (Poor): 0
P-Reviewer: Gamarra LF, Brazil S-Editor: Wang JJ L-Editor: Webster JR P-Editor: Cai YX
| 1. | Li J, Wang J, Lei L, Yuan G, He S. The diagnostic performance of gadoxetic acid disodium-enhanced magnetic resonance imaging and contrast-enhanced multi-detector computed tomography in detecting hepatocellular carcinoma: a meta-analysis of eight prospective studies. Eur Radiol. 2019;29:6519-6528. [RCA] [PubMed] [DOI] [Full Text] [Cited by in Crossref: 49] [Cited by in RCA: 50] [Article Influence: 8.3] [Reference Citation Analysis (2)] |
| 2. | Wang J, Ye X, Li J, He S. The diagnostic performance of gadoxetic acid disodium-enhanced magnetic resonance imaging and contrast-enhanced ultrasound in detecting hepatocellular carcinoma: A meta-analysis. Medicine (Baltimore). 2021;100:e24602. [RCA] [PubMed] [DOI] [Full Text] [Full Text (PDF)] [Cited by in Crossref: 4] [Cited by in RCA: 3] [Article Influence: 0.8] [Reference Citation Analysis (0)] |
| 3. | Ippolito D, Inchingolo R, Grazioli L, Drago SG, Nardella M, Gatti M, Faletti R. Recent advances in non-invasive magnetic resonance imaging assessment of hepatocellular carcinoma. World J Gastroenterol. 2018;24:2413-2426. [RCA] [PubMed] [DOI] [Full Text] [Full Text (PDF)] [Cited by in CrossRef: 22] [Cited by in RCA: 20] [Article Influence: 2.9] [Reference Citation Analysis (2)] |
| 4. | Inchingolo R, Faletti R, Grazioli L, Tricarico E, Gatti M, Pecorelli A, Ippolito D. MR with Gd-EOB-DTPA in assessment of liver nodules in cirrhotic patients. World J Hepatol. 2018;10:462-473. [RCA] [PubMed] [DOI] [Full Text] [Full Text (PDF)] [Cited by in Crossref: 24] [Cited by in RCA: 18] [Article Influence: 2.6] [Reference Citation Analysis (2)] |
| 5. | Oldhafer KJ, Habbel V, Horling K, Makridis G, Wagner KC. Benign Liver Tumors. Visc Med. 2020;36:292-303. [RCA] [PubMed] [DOI] [Full Text] [Cited by in Crossref: 15] [Cited by in RCA: 29] [Article Influence: 5.8] [Reference Citation Analysis (0)] |
| 6. | Tsili AC, Alexiou G, Naka C, Argyropoulou MI. Imaging of colorectal cancer liver metastases using contrast-enhanced US, multidetector CT, MRI, and FDG PET/CT: a meta-analysis. Acta Radiol. 2021;62:302-312. [RCA] [PubMed] [DOI] [Full Text] [Cited by in Crossref: 13] [Cited by in RCA: 39] [Article Influence: 9.8] [Reference Citation Analysis (0)] |
| 7. | Sporea I, Săndulescu DL, Şirli R, Popescu A, Danilă M, Spârchez Z, Mihai C, Ioanițescu S, Moga T, Timar B, Brisc C, Nedelcu D, Săftoiu A, Enăchescu V, Badea R. Contrast-Enhanced Ultrasound for the Characterization of Malignant versus Benign Focal Liver Lesions in a Prospective Multicenter Experience - The SRUMB Study. J Gastrointestin Liver Dis. 2019;28:191-196. [RCA] [PubMed] [DOI] [Full Text] [Cited by in Crossref: 19] [Cited by in RCA: 15] [Article Influence: 2.5] [Reference Citation Analysis (0)] |
| 8. | Inchingolo R, Maino C, Gatti M, Tricarico E, Nardella M, Grazioli L, Sironi S, Ippolito D, Faletti R. Gadoxetic acid magnetic-enhanced resonance imaging in the diagnosis of cholangiocarcinoma. World J Gastroenterol. 2020;26:4261-4271. [RCA] [PubMed] [DOI] [Full Text] [Full Text (PDF)] [Cited by in CrossRef: 10] [Cited by in RCA: 9] [Article Influence: 1.8] [Reference Citation Analysis (0)] |
| 9. | Grazioli L, Faletti R, Frittoli B, Battisti G, Ambrosini R, Romanini L, Gatti M, Fonio P. Evaluation of incidence of acute transient dyspnea and related artifacts after administration of gadoxetate disodium: a prospective observational study. Radiol Med. 2018;123:910-917. [RCA] [PubMed] [DOI] [Full Text] [Cited by in Crossref: 12] [Cited by in RCA: 14] [Article Influence: 2.0] [Reference Citation Analysis (0)] |
| 10. | Zhang L, Yu X, Huo L, Lu L, Pan X, Jia N, Fan X, Morana G, Grazioli L, Schneider G. Detection of liver metastases on gadobenate dimeglumine-enhanced MRI: systematic review, meta-analysis, and similarities with gadoxetate-enhanced MRI. Eur Radiol. 2019;29:5205-5216. [RCA] [PubMed] [DOI] [Full Text] [Cited by in Crossref: 8] [Cited by in RCA: 12] [Article Influence: 2.0] [Reference Citation Analysis (0)] |
| 11. | Castaldo A, De Lucia DR, Pontillo G, Gatti M, Cocozza S, Ugga L, Cuocolo R. State of the Art in Artificial Intelligence and Radiomics in Hepatocellular Carcinoma. Diagnostics (Basel). 2021;11. [RCA] [PubMed] [DOI] [Full Text] [Full Text (PDF)] [Cited by in Crossref: 13] [Cited by in RCA: 10] [Article Influence: 2.5] [Reference Citation Analysis (0)] |
| 12. | Laumonier H, Bioulac-Sage P, Laurent C, Zucman-Rossi J, Balabaud C, Trillaud H. Hepatocellular adenomas: magnetic resonance imaging features as a function of molecular pathological classification. Hepatology. 2008;48:808-818. [RCA] [PubMed] [DOI] [Full Text] [Cited by in Crossref: 244] [Cited by in RCA: 208] [Article Influence: 12.2] [Reference Citation Analysis (0)] |
| 13. | Shanbhogue AK, Prasad SR, Takahashi N, Vikram R, Sahani DV. Recent advances in cytogenetics and molecular biology of adult hepatocellular tumors: implications for imaging and management. Radiology. 2011;258:673-693. [RCA] [PubMed] [DOI] [Full Text] [Cited by in Crossref: 54] [Cited by in RCA: 55] [Article Influence: 3.9] [Reference Citation Analysis (0)] |
| 14. | Dharmana H, Saravana-Bawan S, Girgis S, Low G. Hepatocellular adenoma: imaging review of the various molecular subtypes. Clin Radiol. 2017;72:276-285. [RCA] [PubMed] [DOI] [Full Text] [Cited by in Crossref: 20] [Cited by in RCA: 19] [Article Influence: 2.4] [Reference Citation Analysis (0)] |
| 15. | Lin H, van den Esschert J, Liu C, van Gulik TM. Systematic review of hepatocellular adenoma in China and other regions. J Gastroenterol Hepatol. 2011;26:28-35. [RCA] [PubMed] [DOI] [Full Text] [Cited by in Crossref: 71] [Cited by in RCA: 69] [Article Influence: 4.9] [Reference Citation Analysis (0)] |
| 16. | Baum JK, Bookstein JJ, Holtz F, Klein EW. Possible association between benign hepatomas and oral contraceptives. Lancet. 1973;2:926-929. [RCA] [PubMed] [DOI] [Full Text] [Cited by in Crossref: 434] [Cited by in RCA: 356] [Article Influence: 6.8] [Reference Citation Analysis (0)] |
| 17. | Edmondson HA, Reynolds TB, Henderson B, Benton B. Regression of liver cell adenomas associated with oral contraceptives. Ann Intern Med. 1977;86:180-182. [RCA] [PubMed] [DOI] [Full Text] [Cited by in Crossref: 176] [Cited by in RCA: 145] [Article Influence: 3.0] [Reference Citation Analysis (0)] |
| 18. | Flejou JF, Barge J, Menu Y, Degott C, Bismuth H, Potet F, Benhamou JP. Liver adenomatosis. An entity distinct from liver adenoma? Gastroenterology. 1985;89:1132-1138. [PubMed] |
| 19. | Donato M, Hamidian Jahromi A, Andrade AI, Kim R, Chaudhery SI, Sangster G. Hepatic adenomatosis: a rare but important liver disease with severe clinical implications. Int Surg. 2015;100:903-907. [RCA] [PubMed] [DOI] [Full Text] [Cited by in Crossref: 10] [Cited by in RCA: 8] [Article Influence: 0.8] [Reference Citation Analysis (0)] |
| 20. | Ronot M, Bahrami S, Calderaro J, Valla DC, Bedossa P, Belghiti J, Vilgrain V, Paradis V. Hepatocellular adenomas: accuracy of magnetic resonance imaging and liver biopsy in subtype classification. Hepatology. 2011;53:1182-1191. [RCA] [PubMed] [DOI] [Full Text] [Cited by in Crossref: 167] [Cited by in RCA: 150] [Article Influence: 10.7] [Reference Citation Analysis (0)] |
| 21. | Grazioli L, Ambrosini R, Frittoli B, Grazioli M, Morone M. Primary benign liver lesions. Eur J Radiol. 2017;95:378-398. [RCA] [PubMed] [DOI] [Full Text] [Cited by in Crossref: 20] [Cited by in RCA: 29] [Article Influence: 3.6] [Reference Citation Analysis (0)] |
| 22. | Bioulac-Sage P, Laumonier H, Couchy G, Le Bail B, Sa Cunha A, Rullier A, Laurent C, Blanc JF, Cubel G, Trillaud H, Zucman-Rossi J, Balabaud C, Saric J. Hepatocellular adenoma management and phenotypic classification: the Bordeaux experience. Hepatology. 2009;50:481-489. [RCA] [PubMed] [DOI] [Full Text] [Cited by in Crossref: 349] [Cited by in RCA: 296] [Article Influence: 18.5] [Reference Citation Analysis (0)] |
| 23. | Dhingra S, Fiel MI. Update on the new classification of hepatic adenomas: clinical, molecular, and pathologic characteristics. Arch Pathol Lab Med. 2014;138:1090-1097. [RCA] [PubMed] [DOI] [Full Text] [Cited by in Crossref: 82] [Cited by in RCA: 68] [Article Influence: 6.2] [Reference Citation Analysis (0)] |
| 24. | Nguyen BN, Fléjou JF, Terris B, Belghiti J, Degott C. Focal nodular hyperplasia of the liver: a comprehensive pathologic study of 305 lesions and recognition of new histologic forms. Am J Surg Pathol. 1999;23:1441-1454. [RCA] [PubMed] [DOI] [Full Text] [Cited by in Crossref: 353] [Cited by in RCA: 271] [Article Influence: 10.4] [Reference Citation Analysis (0)] |
| 25. | Cogley JR, Miller FH. MR imaging of benign focal liver lesions. Radiol Clin North Am. 2014;52:657-682. [RCA] [PubMed] [DOI] [Full Text] [Cited by in Crossref: 35] [Cited by in RCA: 34] [Article Influence: 3.1] [Reference Citation Analysis (0)] |
| 26. | Gatti M, Calandri M, Bergamasco L, Darvizeh F, Grazioli L, Inchingolo R, Ippolito D, Rousset S, Veltri A, Fonio P, Faletti R. Characterization of the arterial enhancement pattern of focal liver lesions by multiple arterial phase magnetic resonance imaging: comparison between hepatocellular carcinoma and focal nodular hyperplasia. Radiol Med. 2020;125:348-355. [RCA] [PubMed] [DOI] [Full Text] [Cited by in Crossref: 26] [Cited by in RCA: 25] [Article Influence: 5.0] [Reference Citation Analysis (0)] |
| 27. | Hussain SM, Terkivatan T, Zondervan PE, Lanjouw E, de Rave S, Ijzermans JN, de Man RA. Focal nodular hyperplasia: findings at state-of-the-art MR imaging, US, CT, and pathologic analysis. Radiographics. 2004;24:3-17; discussion 18. [RCA] [PubMed] [DOI] [Full Text] [Cited by in Crossref: 242] [Cited by in RCA: 200] [Article Influence: 9.5] [Reference Citation Analysis (0)] |
| 28. | Ferlicot S, Kobeiter H, Tran Van Nhieu J, Cherqui D, Dhumeaux D, Mathieu D, Zafrani ES. MRI of atypical focal nodular hyperplasia of the liver: radiology-pathology correlation. AJR Am J Roentgenol. 2004;182:1227-1231. [RCA] [PubMed] [DOI] [Full Text] [Cited by in Crossref: 49] [Cited by in RCA: 49] [Article Influence: 2.3] [Reference Citation Analysis (0)] |
| 29. | Jahic E, Sofic A, Selimovic AH. DWI/ADC in Differentiation of Benign from Malignant Focal Liver Lesion. Acta Inform Med. 2016;24:244-247. [RCA] [PubMed] [DOI] [Full Text] [Full Text (PDF)] [Cited by in Crossref: 7] [Cited by in RCA: 7] [Article Influence: 0.8] [Reference Citation Analysis (0)] |
| 30. | Agnello F, Ronot M, Valla DC, Sinkus R, Van Beers BE, Vilgrain V. High-b-value diffusion-weighted MR imaging of benign hepatocellular lesions: quantitative and qualitative analysis. Radiology. 2012;262:511-519. [RCA] [PubMed] [DOI] [Full Text] [Cited by in Crossref: 67] [Cited by in RCA: 59] [Article Influence: 4.2] [Reference Citation Analysis (0)] |
| 31. | Mortelé KJ, Praet M, Van Vlierberghe H, Kunnen M, Ros PR. CT and MR imaging findings in focal nodular hyperplasia of the liver: radiologic-pathologic correlation. AJR Am J Roentgenol. 2000;175:687-692. [RCA] [PubMed] [DOI] [Full Text] [Cited by in Crossref: 162] [Cited by in RCA: 117] [Article Influence: 4.7] [Reference Citation Analysis (0)] |
| 32. | Goodwin MD, Dobson JE, Sirlin CB, Lim BG, Stella DL. Diagnostic challenges and pitfalls in MR imaging with hepatocyte-specific contrast agents. Radiographics. 2011;31:1547-1568. [RCA] [PubMed] [DOI] [Full Text] [Cited by in Crossref: 100] [Cited by in RCA: 108] [Article Influence: 7.7] [Reference Citation Analysis (0)] |
| 33. | Del Poggio P, Buonocore M. Cystic tumors of the liver: a practical approach. World J Gastroenterol. 2008;14:3616-3620. [RCA] [PubMed] [DOI] [Full Text] [Full Text (PDF)] [Cited by in CrossRef: 92] [Cited by in RCA: 76] [Article Influence: 4.5] [Reference Citation Analysis (0)] |
| 34. | Guo Y, Jain D, Weinreb J. Von Meyenburg Complex: Current Concepts and Imaging Misconceptions. J Comput Assist Tomogr. 2019;43:846-851. [RCA] [PubMed] [DOI] [Full Text] [Cited by in Crossref: 6] [Cited by in RCA: 6] [Article Influence: 1.0] [Reference Citation Analysis (0)] |
| 35. | Torbenson MS. Hamartomas and malformations of the liver. Semin Diagn Pathol. 2019;36:39-47. [RCA] [PubMed] [DOI] [Full Text] [Cited by in Crossref: 15] [Cited by in RCA: 16] [Article Influence: 2.7] [Reference Citation Analysis (0)] |
| 36. | Zheng RQ, Zhang B, Kudo M, Onda H, Inoue T. Imaging findings of biliary hamartomas. World J Gastroenterol. 2005;11:6354-6359. [RCA] [PubMed] [DOI] [Full Text] [Full Text (PDF)] [Cited by in CrossRef: 84] [Cited by in RCA: 71] [Article Influence: 3.6] [Reference Citation Analysis (0)] |
| 37. | Semelka RC, Hussain SM, Marcos HB, Woosley JT. Biliary hamartomas: solitary and multiple lesions shown on current MR techniques including gadolinium enhancement. J Magn Reson Imaging. 1999;10:196-201. [RCA] [PubMed] [DOI] [Full Text] [Cited by in RCA: 3] [Reference Citation Analysis (0)] |
| 38. | Giambelluca D, Caruana G, Cannella R, Lo Re G, Midiri M. The starry sky liver: multiple biliary hamartomas on MR cholangiopancreatography. Abdom Radiol (NY). 2018;43:2529-2530. [RCA] [PubMed] [DOI] [Full Text] [Cited by in Crossref: 5] [Cited by in RCA: 3] [Article Influence: 0.4] [Reference Citation Analysis (0)] |
| 39. | Evans J, Willyard CE, Sabih DE. Cavernous Hepatic Hemangiomas. 2021 Nov 5. In: StatPearls [Internet]. Treasure Island (FL): StatPearls Publishing; 2022 Jan-. [PubMed] |
| 40. | Chan YL, Lee SF, Yu SC, Lai P, Ching AS. Hepatic malignant tumour versus cavernous haemangioma: differentiation on multiple breath-hold turbo spin-echo MRI sequences with different T2-weighting and T2-relaxation time measurements on a single slice multi-echo sequence. Clin Radiol. 2002;57:250-257. [RCA] [PubMed] [DOI] [Full Text] [Cited by in Crossref: 14] [Cited by in RCA: 14] [Article Influence: 0.6] [Reference Citation Analysis (0)] |
| 41. | Parikh T, Drew SJ, Lee VS, Wong S, Hecht EM, Babb JS, Taouli B. Focal liver lesion detection and characterization with diffusion-weighted MR imaging: comparison with standard breath-hold T2-weighted imaging. Radiology. 2008;246:812-822. [RCA] [PubMed] [DOI] [Full Text] [Cited by in Crossref: 427] [Cited by in RCA: 415] [Article Influence: 24.4] [Reference Citation Analysis (0)] |
| 42. | Vilgrain V, Boulos L, Vullierme MP, Denys A, Terris B, Menu Y. Imaging of atypical hemangiomas of the liver with pathologic correlation. Radiographics. 2000;20:379-397. [RCA] [PubMed] [DOI] [Full Text] [Cited by in Crossref: 319] [Cited by in RCA: 257] [Article Influence: 10.3] [Reference Citation Analysis (0)] |
| 43. | Klotz T, Montoriol PF, Da Ines D, Petitcolin V, Joubert-Zakeyh J, Garcier JM. Hepatic haemangioma: common and uncommon imaging features. Diagn Interv Imaging. 2013;94:849-859. [RCA] [PubMed] [DOI] [Full Text] [Cited by in Crossref: 77] [Cited by in RCA: 71] [Article Influence: 5.9] [Reference Citation Analysis (1)] |
| 44. | Ridge CA, Shia J, Gerst SR, Do RK. Sclerosed hemangioma of the liver: concordance of MRI features with histologic characteristics. J Magn Reson Imaging. 2014;39:812-818. [RCA] [PubMed] [DOI] [Full Text] [Cited by in Crossref: 19] [Cited by in RCA: 20] [Article Influence: 1.7] [Reference Citation Analysis (0)] |
| 45. | Boraschi P, Donati F, Gherarducci G. Imaging findings in myomatous angiomyolipoma of the liver. Diagn Interv Radiol. 2012;18:387-390. [RCA] [PubMed] [DOI] [Full Text] [Cited by in Crossref: 2] [Cited by in RCA: 2] [Article Influence: 0.2] [Reference Citation Analysis (0)] |
| 46. | Zhu Z, Yang L, Zhao XM, Luo DQ, Zhang HT, Zhou CW. Myomatous hepatic angiomyolipoma: imaging findings in 14 cases with radiological-pathological correlation and review of the literature. Br J Radiol. 2014;87:20130712. [RCA] [PubMed] [DOI] [Full Text] [Cited by in Crossref: 3] [Cited by in RCA: 6] [Article Influence: 0.5] [Reference Citation Analysis (0)] |
| 47. | Wang SY, Kuai XP, Meng XX, Jia NY, Dong H. Comparison of MRI features for the differentiation of hepatic angiomyolipoma from fat-containing hepatocellular carcinoma. Abdom Imaging. 2014;39:323-333. [RCA] [PubMed] [DOI] [Full Text] [Cited by in Crossref: 21] [Cited by in RCA: 23] [Article Influence: 2.1] [Reference Citation Analysis (0)] |
| 48. | Long X, Zhang L, Cheng Q, Chen Q, Chen XP. Solitary hepatic lymphangioma mimicking liver malignancy: A case report and literature review. World J Clin Cases. 2020;8:4633-4643. [RCA] [PubMed] [DOI] [Full Text] [Full Text (PDF)] [Cited by in CrossRef: 4] [Cited by in RCA: 2] [Article Influence: 0.4] [Reference Citation Analysis (0)] |
| 49. | Losanoff JE, Richman BW, El-Sherif A, Rider KD, Jones JW. Mesenteric cystic lymphangioma. J Am Coll Surg. 2003;196:598-603. [RCA] [PubMed] [DOI] [Full Text] [Cited by in Crossref: 141] [Cited by in RCA: 122] [Article Influence: 5.5] [Reference Citation Analysis (0)] |
| 50. | Alqahtani A, Nguyen LT, Flageole H, Shaw K, Laberge JM. 25 years' experience with lymphangiomas in children. J Pediatr Surg. 1999;34:1164-1168. [RCA] [PubMed] [DOI] [Full Text] [Cited by in Crossref: 264] [Cited by in RCA: 233] [Article Influence: 9.0] [Reference Citation Analysis (0)] |
| 51. | Huang L, Li J, Zhou F, Yan J, Liu C, Zhou AY, Tang A, Yan Y. Giant cystic lymphangioma of the liver. Hepatol Int. 2010;4:784-787. [RCA] [PubMed] [DOI] [Full Text] [Cited by in Crossref: 12] [Cited by in RCA: 7] [Article Influence: 0.5] [Reference Citation Analysis (0)] |
| 52. | Choi WJ, Jeong WK, Kim Y, Kim J, Pyo JY, Oh YH. MR imaging of hepatic lymphangioma. Korean J Hepatol. 2012;18:101-104. [RCA] [PubMed] [DOI] [Full Text] [Full Text (PDF)] [Cited by in Crossref: 10] [Cited by in RCA: 10] [Article Influence: 0.8] [Reference Citation Analysis (0)] |
| 53. | Matsumoto T, Ojima H, Akishima-Fukasawa Y, Hiraoka N, Onaya H, Shimada K, Mizuguchi Y, Sakurai S, Ishii T, Kosuge T, Kanai Y. Solitary hepatic lymphangioma: report of a case. Surg Today. 2010;40:883-889. [RCA] [PubMed] [DOI] [Full Text] [Cited by in Crossref: 16] [Cited by in RCA: 10] [Article Influence: 0.7] [Reference Citation Analysis (0)] |
| 54. | Makino Y, Miyazaki M, Shigekawa M, Ezaki H, Sakamori R, Yakushijin T, Ohkawa K, Kato M, Akasaka T, Shinzaki S, Nishida T, Miyake Y, Hama N, Nagano H, Honma K, Morii E, Wakasa K, Hikita H, Tatsumi T, Iijima H, Hiramatsu N, Tsujii M, Takehara T. Solitary fibrous tumor of the liver from development to resection. Intern Med. 2015;54:765-770. [RCA] [PubMed] [DOI] [Full Text] [Cited by in Crossref: 9] [Cited by in RCA: 9] [Article Influence: 0.9] [Reference Citation Analysis (0)] |
| 55. | Yugawa K, Yoshizumi T, Mano Y, Kurihara T, Yoshiya S, Takeishi K, Itoh S, Harada N, Ikegami T, Soejima Y, Kohashi K, Oda Y, Mori M. Solitary fibrous tumor in the liver: case report and literature review. Surg Case Rep. 2019;5:68. [RCA] [PubMed] [DOI] [Full Text] [Full Text (PDF)] [Cited by in Crossref: 17] [Cited by in RCA: 19] [Article Influence: 3.2] [Reference Citation Analysis (0)] |
| 56. | Andaluz García I, Tavecchia M, Olveira Martín A. A solitary fibrous tumor: an entity to consider in the diagnosis of liver masses. Rev Esp Enferm Dig. 2019;111:969. [RCA] [PubMed] [DOI] [Full Text] [Cited by in Crossref: 3] [Cited by in RCA: 3] [Article Influence: 0.5] [Reference Citation Analysis (0)] |
| 57. | Shu Q, Liu X, Yang X, Guo B, Huang T, Lei H, Peng F, Su S, Li B. Malignant solitary fibrous tumor of the liver: a case report. Int J Clin Exp Pathol. 2019;12:2305-2310. [PubMed] |
| 58. | Nam HC, Sung PS, Jung ES, Yoon SK. Solitary fibrous tumor of the liver mimicking malignancy. Korean J Intern Med. 2020;35:734-735. [RCA] [PubMed] [DOI] [Full Text] [Full Text (PDF)] [Cited by in Crossref: 3] [Cited by in RCA: 4] [Article Influence: 0.8] [Reference Citation Analysis (0)] |
| 59. | Rouy M, Guilbaud T, Birnbaum DJ. Liver Solitary Fibrous Tumor: a Rare Incidentaloma. J Gastrointest Surg. 2021;25:852-853. [RCA] [PubMed] [DOI] [Full Text] [Cited by in Crossref: 3] [Cited by in RCA: 3] [Article Influence: 0.8] [Reference Citation Analysis (0)] |
| 60. | England DM, Hochholzer L, McCarthy MJ. Localized benign and malignant fibrous tumors of the pleura. A clinicopathologic review of 223 cases. Am J Surg Pathol. 1989;13:640-658. [RCA] [PubMed] [DOI] [Full Text] [Cited by in Crossref: 953] [Cited by in RCA: 848] [Article Influence: 23.6] [Reference Citation Analysis (0)] |
| 61. | Maqbool H, Mushtaq S, Hassan U, Ahmad AH, Sarwar S, Sheikh UN. Case series of Mesenchymal Hamartoma: a Rare Childhood Hepatic Neoplasm. J Gastrointest Cancer. 2020;51:1030-1033. [RCA] [PubMed] [DOI] [Full Text] [Cited by in Crossref: 1] [Cited by in RCA: 1] [Article Influence: 0.3] [Reference Citation Analysis (0)] |
| 62. | Lack EE. Mesenchymal hamartoma of the liver. A clinical and pathologic study of nine cases. Am J Pediatr Hematol Oncol. 1986;8:91-98. [PubMed] |
| 63. | Kim SH, Kim WS, Cheon JE, Yoon HK, Kang GH, Kim IO, Yeon KM. Radiological spectrum of hepatic mesenchymal hamartoma in children. Korean J Radiol. 2007;8:498-505. [RCA] [PubMed] [DOI] [Full Text] [Full Text (PDF)] [Cited by in Crossref: 30] [Cited by in RCA: 27] [Article Influence: 1.6] [Reference Citation Analysis (0)] |
| 64. | Rosado E, Cabral P, Campo M, Tavares A. Mesenchymal hamartoma of the liver--a case report and literature review. J Radiol Case Rep. 2013;7:35-43. [RCA] [PubMed] [DOI] [Full Text] [Cited by in Crossref: 3] [Cited by in RCA: 12] [Article Influence: 1.0] [Reference Citation Analysis (0)] |
| 65. | Martins-Filho SN, Putra J. Hepatic mesenchymal hamartoma and undifferentiated embryonal sarcoma of the liver: a pathologic review. Hepat Oncol. 2020;7:HEP19. [RCA] [PubMed] [DOI] [Full Text] [Full Text (PDF)] [Cited by in Crossref: 18] [Cited by in RCA: 30] [Article Influence: 6.0] [Reference Citation Analysis (0)] |
| 66. | Siddiqui MA, McKenna BJ. Hepatic mesenchymal hamartoma: a short review. Arch Pathol Lab Med. 2006;130:1567-1569. [RCA] [PubMed] [DOI] [Full Text] [Cited by in Crossref: 37] [Cited by in RCA: 40] [Article Influence: 2.1] [Reference Citation Analysis (0)] |
| 67. | Venkatesh SK, Yin M, Ehman RL. Magnetic resonance elastography of liver: technique, analysis, and clinical applications. J Magn Reson Imaging. 2013;37:544-555. [RCA] [PubMed] [DOI] [Full Text] [Cited by in Crossref: 491] [Cited by in RCA: 500] [Article Influence: 41.7] [Reference Citation Analysis (0)] |
| 68. | Yeom SK, Byun JH, Kim HJ, Park SH, Kim N, Shin YM, Kim PN. Focal fat deposition at liver MRI with gadobenate dimeglumine and gadoxetic acid: Quantitative and qualitative analysis. Magn Reson Imaging. 2013;31:911-917. [RCA] [PubMed] [DOI] [Full Text] [Cited by in Crossref: 9] [Cited by in RCA: 10] [Article Influence: 0.8] [Reference Citation Analysis (0)] |
| 69. | Ünal E, İdilman İS, Karaosmanoğlu AD, Özmen MN, Akata D, Karcaaltıncaba M. Hyperintensity at fat spared area in steatotic liver on the hepatobiliary phase MRI. Diagn Interv Radiol. 2019;25:416-420. [RCA] [PubMed] [DOI] [Full Text] [Cited by in Crossref: 3] [Cited by in RCA: 4] [Article Influence: 0.8] [Reference Citation Analysis (0)] |
| 70. | Park HJ, Kim SH, Jang KM, Lee SJ, Park MJ, Choi D. Differentiating hepatic abscess from malignant mimickers: value of diffusion-weighted imaging with an emphasis on the periphery of the lesion. J Magn Reson Imaging. 2013;38:1333-1341. [RCA] [PubMed] [DOI] [Full Text] [Cited by in Crossref: 46] [Cited by in RCA: 38] [Article Influence: 3.2] [Reference Citation Analysis (0)] |
| 71. | Lardière-Deguelte S, Ragot E, Amroun K, Piardi T, Dokmak S, Bruno O, Appere F, Sibert A, Hoeffel C, Sommacale D, Kianmanesh R. Hepatic abscess: Diagnosis and management. J Visc Surg. 2015;152:231-243. [RCA] [PubMed] [DOI] [Full Text] [Cited by in Crossref: 108] [Cited by in RCA: 169] [Article Influence: 16.9] [Reference Citation Analysis (0)] |
| 72. | Choi SY, Kim YK, Min JH, Cha DI, Jeong WK, Lee WJ. The value of gadoxetic acid-enhanced MRI for differentiation between hepatic microabscesses and metastases in patients with periampullary cancer. Eur Radiol. 2017;27:4383-4393. [RCA] [PubMed] [DOI] [Full Text] [Cited by in Crossref: 12] [Cited by in RCA: 17] [Article Influence: 2.1] [Reference Citation Analysis (0)] |
| 73. | Deplazes P, Rinaldi L, Alvarez Rojas CA, Torgerson PR, Harandi MF, Romig T, Antolova D, Schurer JM, Lahmar S, Cringoli G, Magambo J, Thompson RC, Jenkins EJ. Global Distribution of Alveolar and Cystic Echinococcosis. Adv Parasitol. 2017;95:315-493. [RCA] [PubMed] [DOI] [Full Text] [Cited by in Crossref: 432] [Cited by in RCA: 637] [Article Influence: 79.6] [Reference Citation Analysis (0)] |
| 74. | Pakala T, Molina M, Wu GY. Hepatic Echinococcal Cysts: A Review. J Clin Transl Hepatol. 2016;4:39-46. [RCA] [PubMed] [DOI] [Full Text] [Full Text (PDF)] [Cited by in Crossref: 125] [Cited by in RCA: 104] [Article Influence: 11.6] [Reference Citation Analysis (1)] |
| 75. | Doyle DJ, Hanbidge AE, O'Malley ME. Imaging of hepatic infections. Clin Radiol. 2006;61:737-748. [RCA] [PubMed] [DOI] [Full Text] [Cited by in Crossref: 46] [Cited by in RCA: 46] [Article Influence: 2.4] [Reference Citation Analysis (0)] |
| 76. | Kaneko R, Mitomi H, Nakazaki N, Yano Y, Ogawa M, Sato Y. Primary Hepatic Lymphoma Complicated by a Hepatic Inflammatory Pseudotumor and Tumor-Forming Pancreatitis. J Gastrointestin Liver Dis. 2017;26:299-304. [RCA] [PubMed] [DOI] [Full Text] [Cited by in Crossref: 3] [Cited by in RCA: 3] [Article Influence: 0.4] [Reference Citation Analysis (0)] |
| 77. | Hamano A, Yamada R, Kurata K, Tsuboi J, Inoue H, Tanaka K, Horiki N, Takei Y. Difficulty in differentiating between IgG4-related hepatic inflammatory pseudotumor and intrahepatic cholangiocarcinoma. Clin J Gastroenterol. 2021;14:263-268. [RCA] [PubMed] [DOI] [Full Text] [Full Text (PDF)] [Cited by in Crossref: 4] [Cited by in RCA: 3] [Article Influence: 0.6] [Reference Citation Analysis (0)] |
| 78. | Schafer E, Shyu I, Walker C, Smallfield G. New Presentation of Hepatic Inflammatory Pseudotumor and Crohn Disease. Inflamm Bowel Dis. 2020;26:e97-e98. [RCA] [PubMed] [DOI] [Full Text] [Cited by in Crossref: 1] [Cited by in RCA: 1] [Article Influence: 0.2] [Reference Citation Analysis (0)] |
| 79. | Zhou J, Zhan S, Zhu Q, Gong H, Wang Y, Fan D, Gong Z, Huang Y. Prediction of nodal involvement in primary rectal carcinoma without invasion to pelvic structures: accuracy of preoperative CT, MR, and DWIBS assessments relative to histopathologic findings. PLoS One. 2014;9:e92779. [RCA] [PubMed] [DOI] [Full Text] [Full Text (PDF)] [Cited by in Crossref: 15] [Cited by in RCA: 15] [Article Influence: 1.4] [Reference Citation Analysis (0)] |
| 80. | Ichikawa S, Motosugi U, Suzuki T, Shimizu T, Onishi H. Imaging features of hepatic inflammatory pseudotumor: distinction from colorectal liver metastasis using gadoxetate disodium-enhanced magnetic resonance imaging. Abdom Radiol (NY). 2020;45:2400-2408. [RCA] [PubMed] [DOI] [Full Text] [Cited by in Crossref: 7] [Cited by in RCA: 9] [Article Influence: 1.8] [Reference Citation Analysis (0)] |
| 81. | Cremers J, Drent M, Driessen A, Nieman F, Wijnen P, Baughman R, Koek G. Liver-test abnormalities in sarcoidosis. Eur J Gastroenterol Hepatol. 2012;24:17-24. [RCA] [PubMed] [DOI] [Full Text] [Cited by in Crossref: 66] [Cited by in RCA: 59] [Article Influence: 4.5] [Reference Citation Analysis (0)] |
| 82. | Jung G, Brill N, Poll LW, Koch JA, Wettstein M. MRI of hepatic sarcoidosis: large confluent lesions mimicking malignancy. AJR Am J Roentgenol. 2004;183:171-173. [RCA] [PubMed] [DOI] [Full Text] [Cited by in Crossref: 31] [Cited by in RCA: 31] [Article Influence: 1.5] [Reference Citation Analysis (0)] |


