Copyright
©The Author(s) 2018.
World J Hepatol. Aug 27, 2018; 10(8): 530-542
Published online Aug 27, 2018. doi: 10.4254/wjh.v10.i8.530
Published online Aug 27, 2018. doi: 10.4254/wjh.v10.i8.530
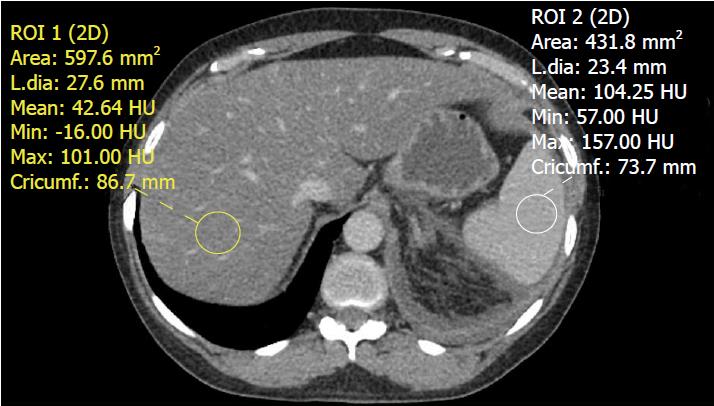
Figure 5 Contrast-enhanced computed tomography of the abdomen demonstrating a fatty liver.
The liver has an attenuation value of 42.64 Hounsfield units while the spleen has an attenuation value of 104.25 Hounsfield units. An attenuation difference of 62 HU is highly suggestive of fatty liver disease.
- Citation: Li Q, Dhyani M, Grajo JR, Sirlin C, Samir AE. Current status of imaging in nonalcoholic fatty liver disease. World J Hepatol 2018; 10(8): 530-542
- URL: https://www.wjgnet.com/1948-5182/full/v10/i8/530.htm
- DOI: https://dx.doi.org/10.4254/wjh.v10.i8.530


