Copyright
©The Author(s) 2018.
World J Hepatol. Aug 27, 2018; 10(8): 530-542
Published online Aug 27, 2018. doi: 10.4254/wjh.v10.i8.530
Published online Aug 27, 2018. doi: 10.4254/wjh.v10.i8.530
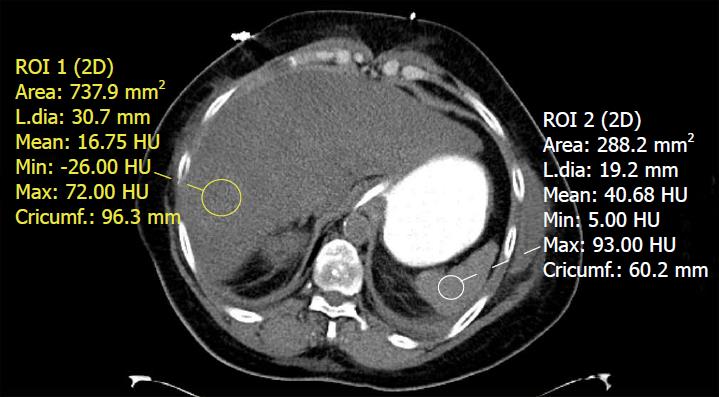
Figure 4 Unenhanced computed tomography of the abdomen in a patient with fatty liver disease.
Regions of interest placed within the liver and spleen demonstrate a hepatic attenuation of 16.75 Hounsfield units (less than 40) and a splenic attenuation of 40.68 Hounsfield units. This meets the definition of fatty liver on CT by absolute value, liver/spleen attenuation difference, and liver/spleen attenuation ratio criteria.
- Citation: Li Q, Dhyani M, Grajo JR, Sirlin C, Samir AE. Current status of imaging in nonalcoholic fatty liver disease. World J Hepatol 2018; 10(8): 530-542
- URL: https://www.wjgnet.com/1948-5182/full/v10/i8/530.htm
- DOI: https://dx.doi.org/10.4254/wjh.v10.i8.530


