Copyright
©The Author(s) 2017.
World J Hepatol. Mar 28, 2017; 9(9): 469-476
Published online Mar 28, 2017. doi: 10.4254/wjh.v9.i9.469
Published online Mar 28, 2017. doi: 10.4254/wjh.v9.i9.469
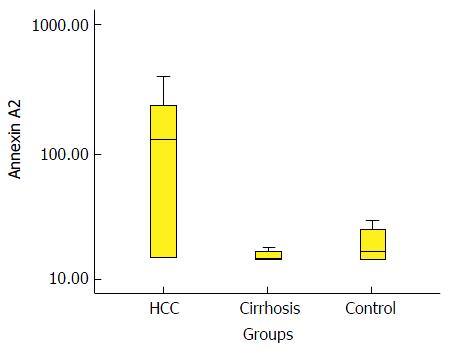
Figure 1 Box-plot diagram that shows the annexin A2 level in the three groups.
HCC: Hepatocellular carcinoma.
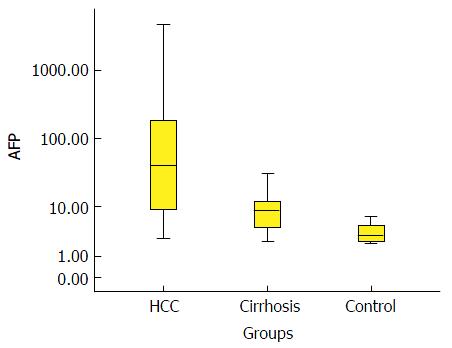
Figure 2 Box-plot diagram shows the alpha-fetoprotein level in the three groups.
AFP: Alpha-fetoprotein; HCC: Hepatocellular carcinoma.
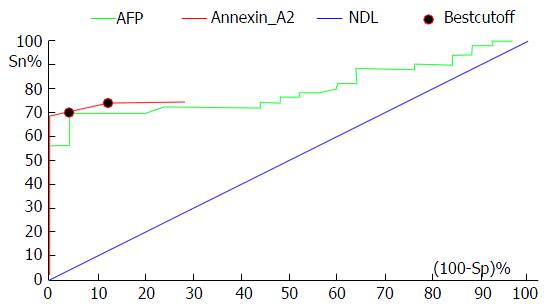
Figure 3 Receiver operating characteristic curve analysis shows the diagnostic performance of alpha-fetoprotein and annexin A2 in the discrimination of patients with hepatocellular carcinoma from those with chronic liver disease.
AFP: Alpha-fetoprotein; NDL: Non-discriminating line (Diagonal line).
- Citation: Shaker MK, Abdel Fattah HI, Sabbour GS, Montasser IF, Abdelhakam SM, El Hadidy E, Yousry R, El Dorry AK. Annexin A2 as a biomarker for hepatocellular carcinoma in Egyptian patients. World J Hepatol 2017; 9(9): 469-476
- URL: https://www.wjgnet.com/1948-5182/full/v9/i9/469.htm
- DOI: https://dx.doi.org/10.4254/wjh.v9.i9.469


