Copyright
©The Author(s) 2017.
World J Hepatol. Mar 18, 2017; 9(8): 443-454
Published online Mar 18, 2017. doi: 10.4254/wjh.v9.i8.443
Published online Mar 18, 2017. doi: 10.4254/wjh.v9.i8.443
Figure 1 A gene signature distinquishes alcoholic liver disease from non-alcoholic fatty liver disease.
A: The heatmap shows a cluster analysis of logarithmic ratios of gene expression data from ALD liver biopsies vs control (blue bar) and NAFLD liver biopsies vs control (red bar); B: The table shows the 20 most up-regulated and 20 most-down-regulated genes from the signature indicating their log2-ratios and their P- and Q-values for the comparison ALD vs NAFLD. The full list of these genes can be found in Supplementary Table 2. ALD: Alcoholic liver disease; NAFLD: Non-alcoholic fatty liver disease.
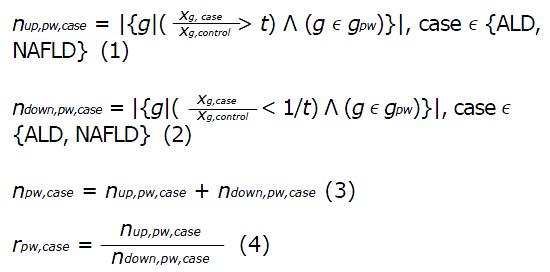
Math 1 Math(A1).
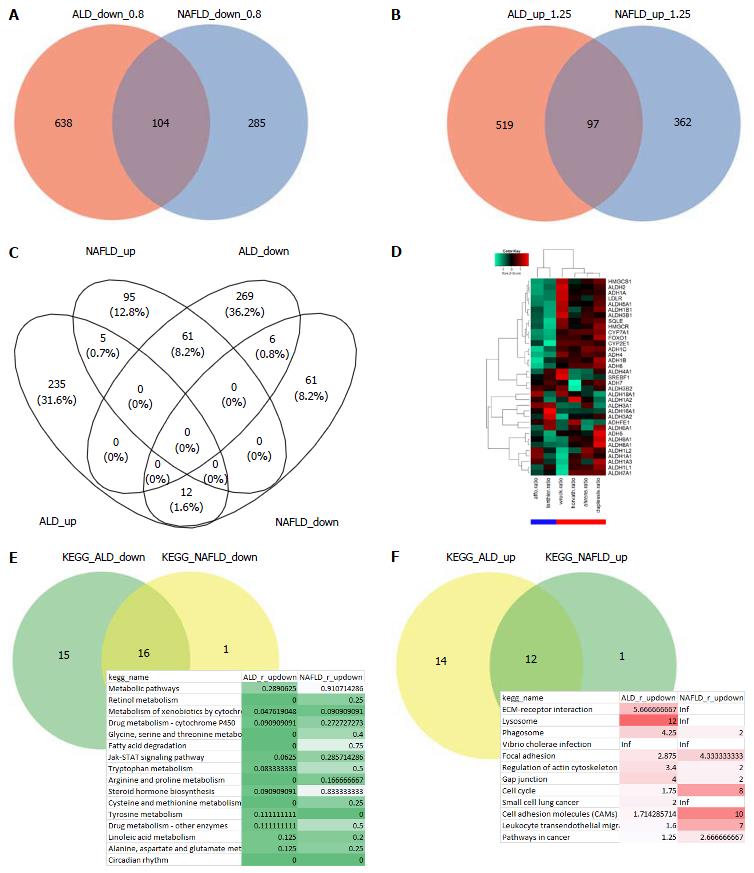
Figure 2 Most biological pathways are regulated in the same direction in alcoholic liver disease and non-alcoholic fatty liver disease but a subset of metabolism-associated genes are oppositely regulated.
A: Compares ALD and NAFLD in terms of down-regulated genes (ratio < 0.8); B: In terms of up-regulated genes (ratio > 1.25). There are more distinct than overlapping genes - in contrary to the KEGG pathways where most pathways overlap (E and F); C: Interestingly, when regulation is further restricted with a P-value < 0.05 more genes are oppositely than commonly regulated - but most are exclusively regulated. Many of the oppositely regulated genes are associated with cholesterol processes, e.g., HMGCR, SQLE and CYP7A1, and are co-expressed with alcohol (ADH) and aldehyd dehydrogeneases (ALDH) as seen in the heatmap (ALD: Blue bar, NAFLD: Red bar) (D). A pathway is considered down-regulated (E) when it contains more down- than up-regulated genes as tested by the binomial test and the ratio, analogously up-regulated pathways are determined (F). The table of common down-regulated pathways includes metabolic, retinol, cytochrome and fatty acid degradation pathways, the up-regulated include ECM-receptor, lysosome and phagosome. ALD: Alcoholic liver disease; NAFLD: Non-alcoholic fatty liver disease.
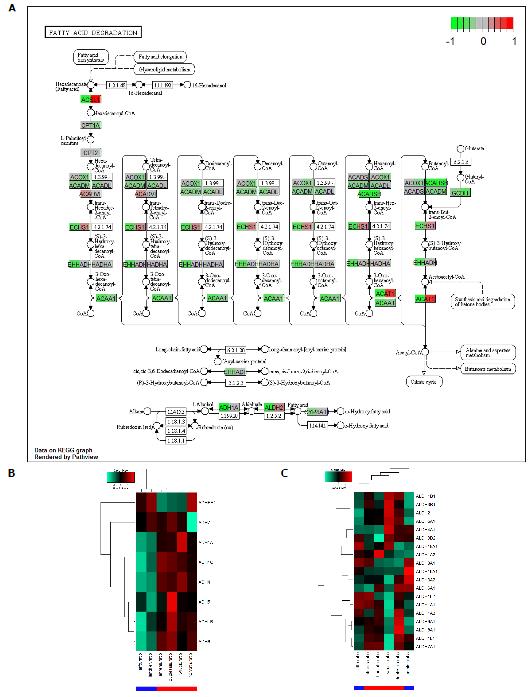
Figure 3 Fatty acid degradation is down-regulated in alcoholic liver disease and non-alcoholic fatty liver disease but more pronounced in alcoholic liver disease.
A: The KEGG graph shows down-regulation (green) in nearly all genes for ALD (left part of the gene boxes) while for NAFLD (right part of the gene boxes) there are up-regulated genes such as ACSL1 and ACAT1 but more are down-regulated. Interestingly, in alcohol metabolism at the bottom of the chart, genes are down-regulated in ALD. Alcohol metabolism at the bottom of (A) is shown in detail in the alcohol dehydrogenase (ADH) genes in the heatmap in (B) and in the aldehyde dehydrogenase genes in (C). ADHs are down-regulated in ALD while only dedicated ALDHs, e.g., ALDH2 are down-regulated in ALD. ALD: Alcoholic liver disease; NAFLD: Non-alcoholic fatty liver disease.
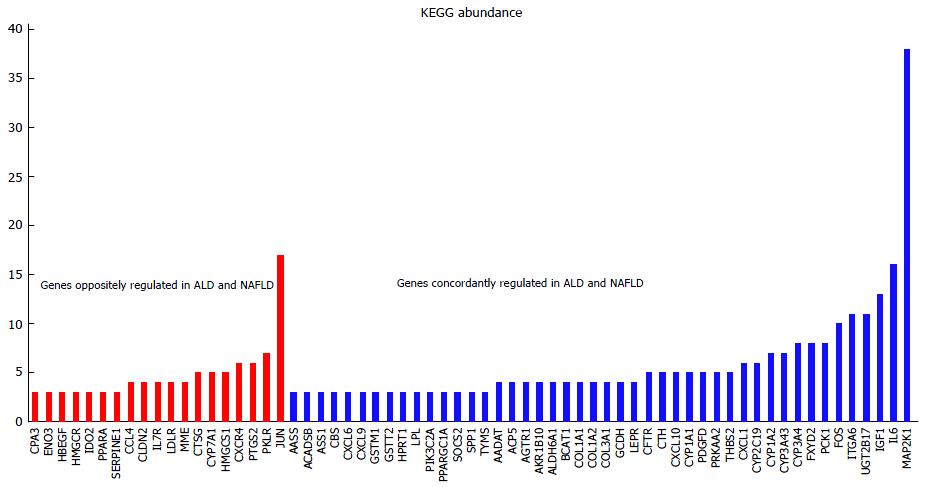
Figure 4 More genes are concordantly than oppositely regulated in alcoholic liver disease and non-alcoholic fatty liver disease.
The chart shows the abundance of concordantly and oppositely regulated genes in KEGG pathways (for abundances > 3). The most abundant MAP2K1 (MEK1) refers to the MAPK/RAS-signalling module acting in many KEGG-pathways. JUN which is appearing in 17 KEGG pathways and is down-regulated in ALD and up-regulated in NAFLD shows that there are mechanistic differences in disease pathologies. ALD: Alcoholic liver disease; NAFLD: Non-alcoholic fatty liver disease.
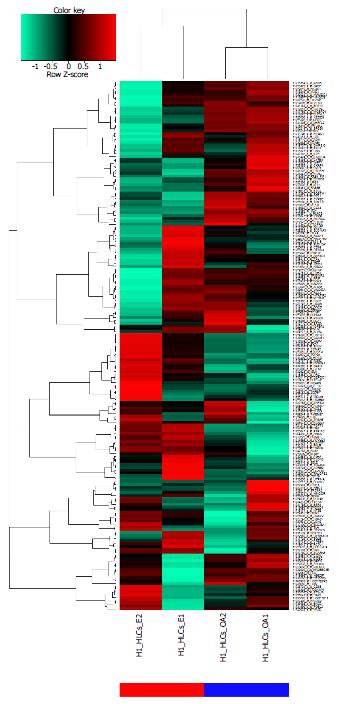
Figure 5 The pluripotent stem cell models of alcoholic liver disease and non-alcoholic fatty liver disease reflect the characteristics of the biopsy-derived gene signature.
The gene signature condensed from the meta-analysis of multiple ALD and NAFLD gene expression datasets was applied to the steatosis-model by (Graffmann et al[40]) where pluripotent-stem-cell-derived hepatocyte-like cells (HLCs) were challenged with ethanol (E) and oleic acid (OA). The cluster analysis shows a clear separation into the ethanol model (red bar) and the oleic acid model (blue bar). ALD: Alcoholic liver disease; NAFLD: Non-alcoholic fatty liver disease.
Figure 6 Rate-limiting genes of cholesterol metabolism are down-regulated in alcoholic liver disease and up-regulated in non-alcoholic fatty liver disease.
This schematic figure shows the log2-ratios of HMGCR, SQLE and CYP7A1 indicating down-regulation in ALD (green) and up-regulation in NAFLD (red). There was stronger down-regulation of CYP7A1 (log2-ratio = -0.95) than of the upstream cholesterol genes HMGCR (log2-ratio = -0.429) and SQLE (log2-ratio = -0.33) in ALD while in NAFLD, CYP7A1 (log2-ratio = 1.15) was weaker up-regulated than HMGCR (log2-ratio = 1.57) and SQLE (log2-ratio = 1.53). The size of the arrows points to a disequilibrium between cholesterol production and secretion into the bile via CYP7A1 in both diseases despite the opposite regulation in ALD and NAFLD. ALD: Alcoholic liver disease; NAFLD: Non-alcoholic fatty liver disease.
- Citation: Wruck W, Adjaye J. Meta-analysis reveals up-regulation of cholesterol processes in non-alcoholic and down-regulation in alcoholic fatty liver disease. World J Hepatol 2017; 9(8): 443-454
- URL: https://www.wjgnet.com/1948-5182/full/v9/i8/443.htm
- DOI: https://dx.doi.org/10.4254/wjh.v9.i8.443


