Copyright
©The Author(s) 2017.
World J Hepatol. Mar 18, 2017; 9(8): 418-426
Published online Mar 18, 2017. doi: 10.4254/wjh.v9.i8.418
Published online Mar 18, 2017. doi: 10.4254/wjh.v9.i8.418
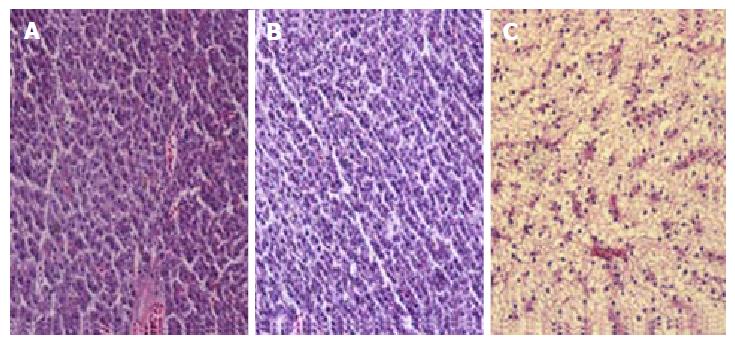
Figure 1 Hematoxylin-eosin staining of liver sections from zebrafish.
A: C group (2 wk), the hepatocytes are aligned in cords, absence of fat droplets; B: E group (2 wk), without apparent changes compared with the C group; C: E group (4 wk), enlarged hepatocytes due to fatty infiltration. Magnification: 400 ×.
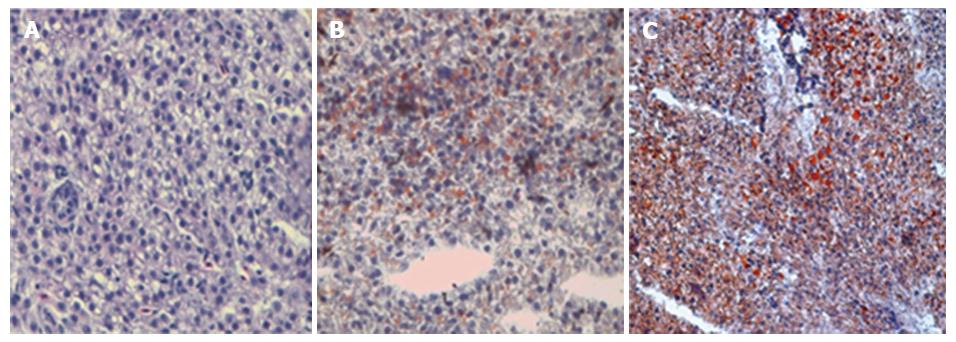
Figure 2 Oil red staining sections of zebrafish liver.
A: C group (4 wk), absence of lipid droplets; B: E group (2 wk), mild presence of lipid droplets; C: E group (4 wk), intense lipid accumulation induced by ethanol in hepatocytes. Magnification: 400 ×.
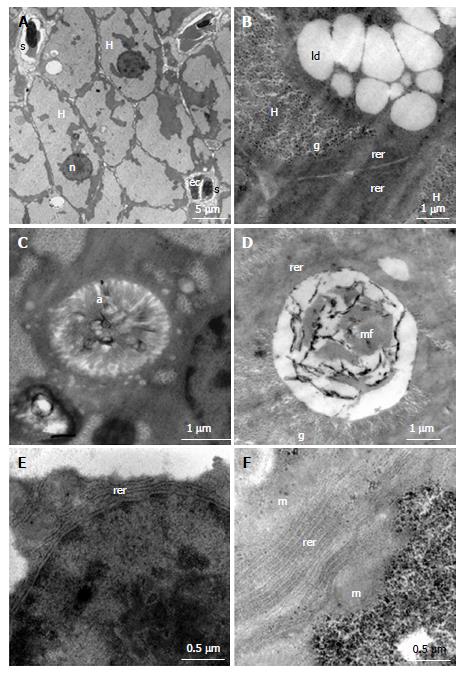
Figure 3 Electron micrographs of liver sections of control (A, C and E) and ethanol exposed groups (B, D and F).
A: Polygonal hepatocytes (H), spherical nucleus (n) sinusoid (s), endothelial cell (ec); B: Presence of large amount of glycogen (g) and lipid droplets (ld) in the hepatocytes cytoplasm; C: Intracellular canaliculus with large number of microvilli (a) within; E: It is noted the parallel arrangement of rough endoplasmic reticulum (rer) around the core; D: Myelin figure (mf) inside an intracellular canaliculus; F: Rough endoplasmic reticulum (rer) composed by 8-12 parallel cisterns; H: Hepatocytes; ec: Endothelial cell.
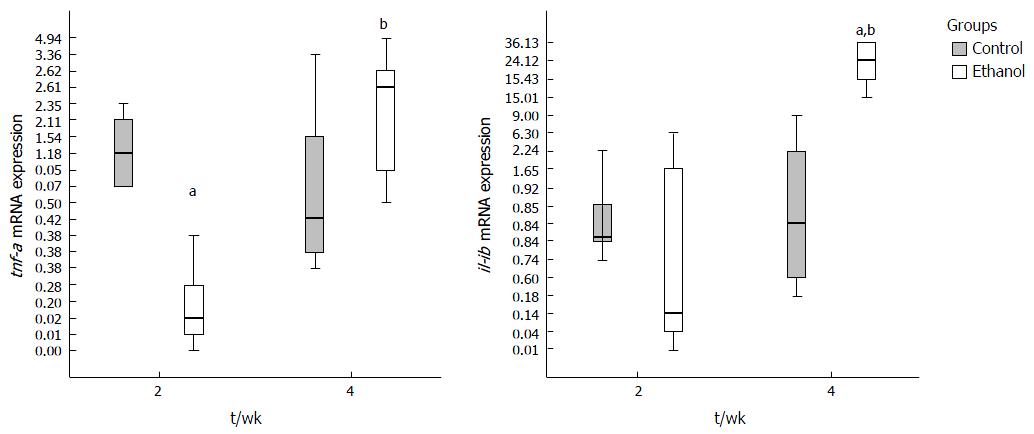
Figure 4 Effect of ethanol on mRNA liver expression of tumor necrosis factor-alpha and interleukin-1b.
tnf-a was decreased significantly in E group compared to C at 2nd week (P = 0.018) and increased along time up 4th week (P < 0.001), reaching C group levels. Il1-b expression increased between 2 and 4 wk (P = 0.001) and at 4th week there was a significant difference between C and E groups (P = 0.024). Statistical data were determined by the Kruskal-Wallis test and Dunn as post hoc test. Values significantly different where indicated: aSignificant statistical difference between 2 and 4 wk; bSignificant statistical difference between C and E groups. P < 0.05 was considered. tnf-a: Tumor necrosis factor-alpha; il: Interleukin.
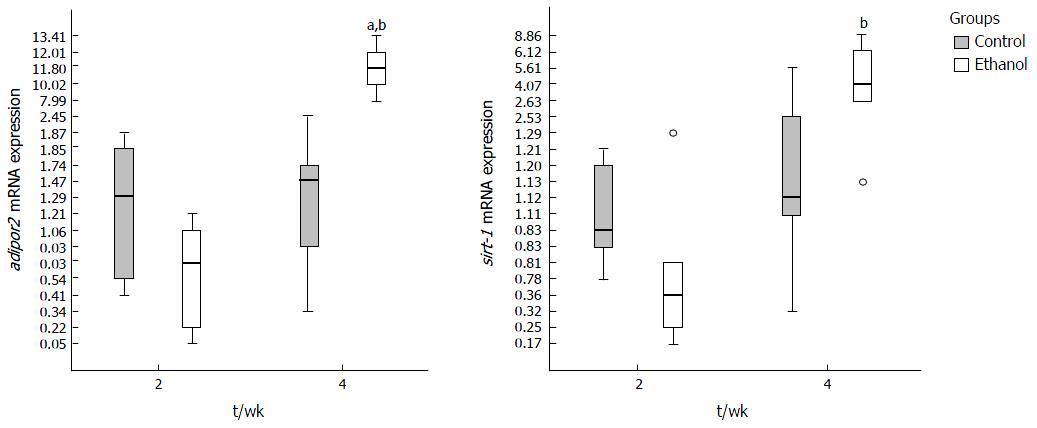
Figure 5 Effect of ethanol on mRNA liver expression of adiponectin receptor 2 and sirtuin-1 of zebrafish.
adipor2 and sirt-1 expression increased in E group between 2 and 4 wk; P < 0.0001 and P = 0.001, respectively. At 4th week adipor2 of E group was increased compared to C, P = 0.006. aSignificant statistical difference between C and E groups; bSignificant statistical difference between 2 and 4 wk. P < 0.05 was considered significant. adipor2: Adiponectin receptor 2; sirt-1: Sirtuin-1.
- Citation: Schneider ACR, Gregório C, Uribe-Cruz C, Guizzo R, Malysz T, Faccioni-Heuser MC, Longo L, da Silveira TR. Chronic exposure to ethanol causes steatosis and inflammation in zebrafish liver. World J Hepatol 2017; 9(8): 418-426
- URL: https://www.wjgnet.com/1948-5182/full/v9/i8/418.htm
- DOI: https://dx.doi.org/10.4254/wjh.v9.i8.418


