Copyright
©The Author(s) 2017.
World J Hepatol. Mar 8, 2017; 9(7): 368-384
Published online Mar 8, 2017. doi: 10.4254/wjh.v9.i7.368
Published online Mar 8, 2017. doi: 10.4254/wjh.v9.i7.368
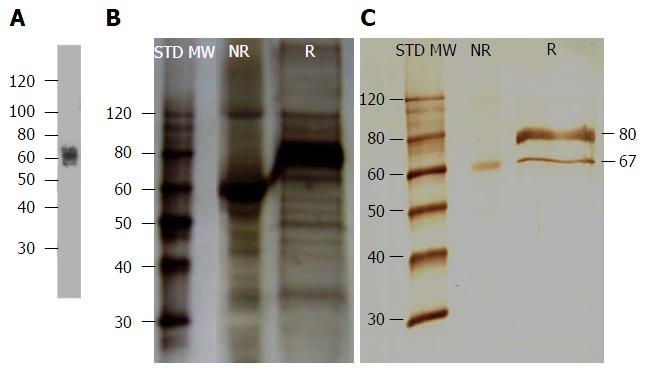
Figure 1 Liver heparan sulfate proteoglycan was detected by anti-rat glypican and mAb 1E4-1D9.
A: Liver heparan sulfate proteoglycan (HSPG) was digested with heparin lyase I, II, III and probed with anti-rat glypican[47]; B: Silver stain of liver HSPG; C: Liver HSPG was reacted with mAb 1E4-1D9 and visualized by horseradish peroxidase-conjugated rabbit anti-mouse Igs following with 3,3-diamino benzidine/H2O2 substrate.
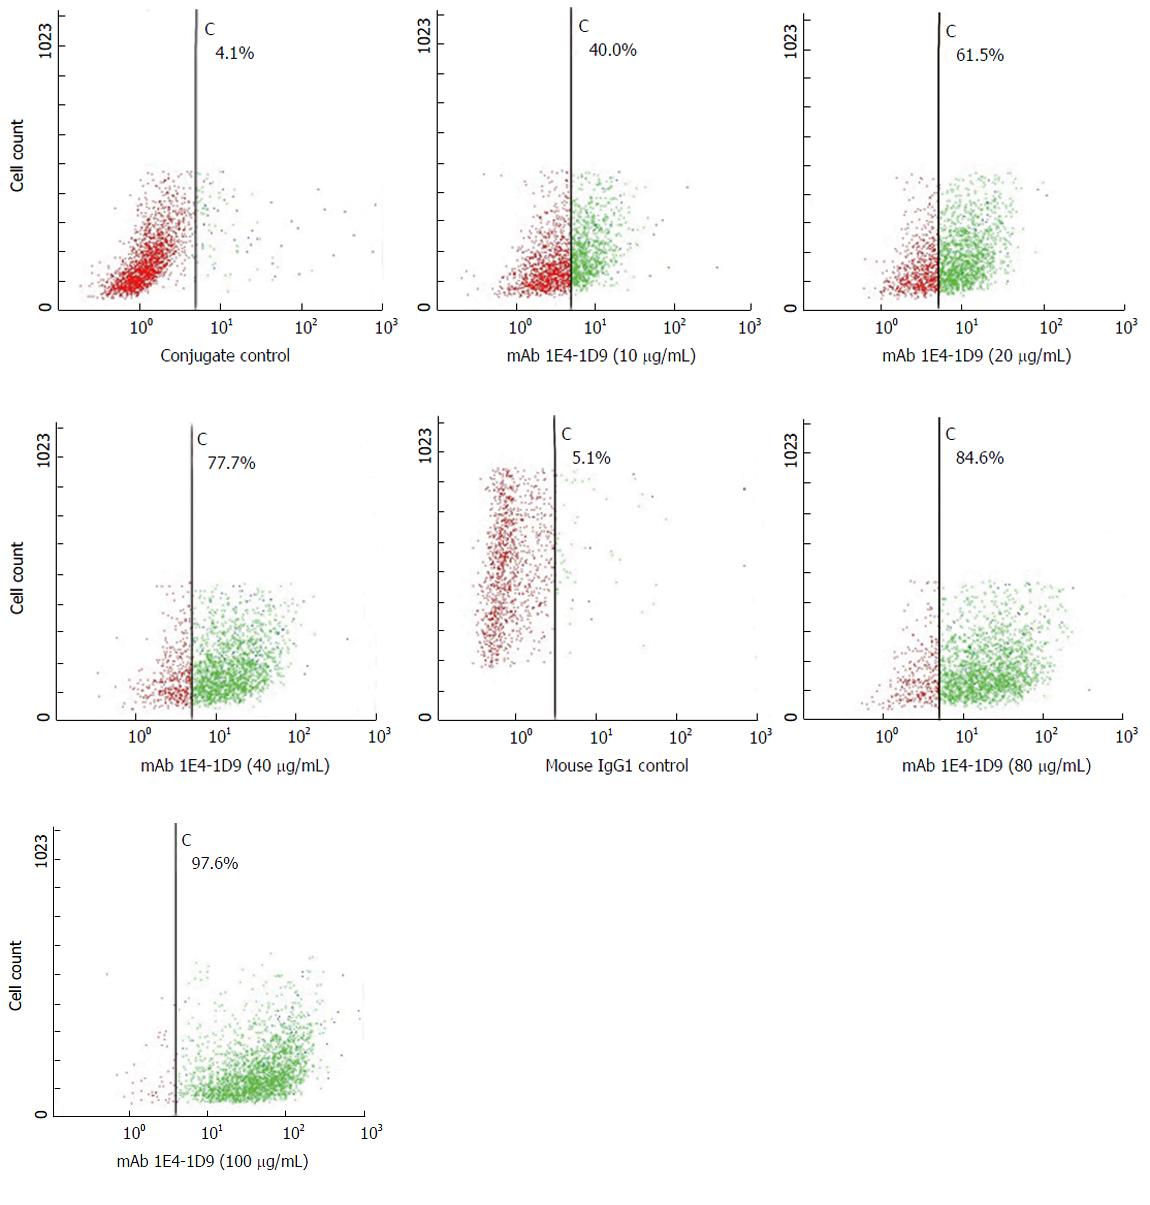
Figure 2 HepG2 cells (4 × 10⁵ cells/mL) were reacted with various final concentrations of mAb 1E4-1D9 (0-160 µg/mL) for 30 min on ice.
Mouse IgG1 was used as isotype control. After washing, cells were stained with fluorescein isothiocyanate-conjugated rabbit anti-mouse Igs (1:20) for 30 min on ice and washed. Finally, cells were suspended with 300 μL of 0.5% paraformaldehyde in phosphate buffered saline, pH 7.2 and analyzed by flow cytometry.
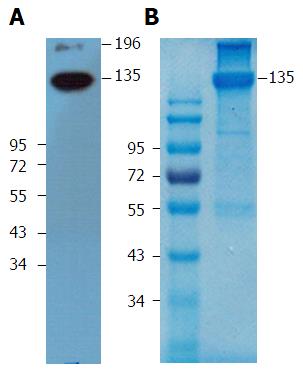
Figure 3 Specific antigen was immunoprecipitated from HepG2 cell lysate by mAb 1E4-1D9-immobilized protein G agarose beads.
Eluate was separated under non-reducing conditions in 10% sodium dodecylsulfate-polyacrylamide gel electrophoresis at 200 V for 45 min. One gel was blotted onto polyvinyl difluoride membrane and probed with mAb 1E4-1D9. A: The reaction was detected by HRP-conjugated rabbit anti-mouse Igs and signal was developed by SuperSignal™ West Pico Chemiluminescent Substrate; B: Another gel was stained with Coomasie Brilliant Blue and protein band of 135 kD was cut and sent for amino acid analysis (B).
Figure 4 Band of approximately 135 kD precipitated by mAb 1E4-1D9 was analyzed by LC-MS.
A: Prediction of glycosylation sites and transmembrane region in hypothetical protein sequence gi60219551 was predicted by TMHMMM software; B: Number of cysteine was determined from all 1378 amino acid sequence, yellow highlight are N-glycosylation sites, green letter are cysteine, blue letter are glycosylation sites; C: Sequence of gi60219551 was aligned with glypican-3 based on the reliable program on website: https://blast.ncbi.nlm.nih.gov/Blast.cgi.
Figure 5 HepG2 cells (4 × 10⁵ cells/mL) were reacted with various final concentrations of mAb 1E4-1D9 (0-160 µg/mL) for 30 min on ice.
Mouse IgG1 was used as isotype control. After washing, cells were stained with fluorescein isothiocyanate-conjugated rabbit anti-mouse Igs (1:20) for 30 min on ice and washed. PE-conjugated anti-glypican-3 (1:10) was added and reaction was incubated for another 30 min on ice. Phycoerythrin-conjugated mouse IgG2a was used as isotype control in this step. After washing, cells were suspended with 300 μL of 0.5%paraformaldehyde in phosphate buffered saline, pH 7.2 and analyzed by flow cytometry.
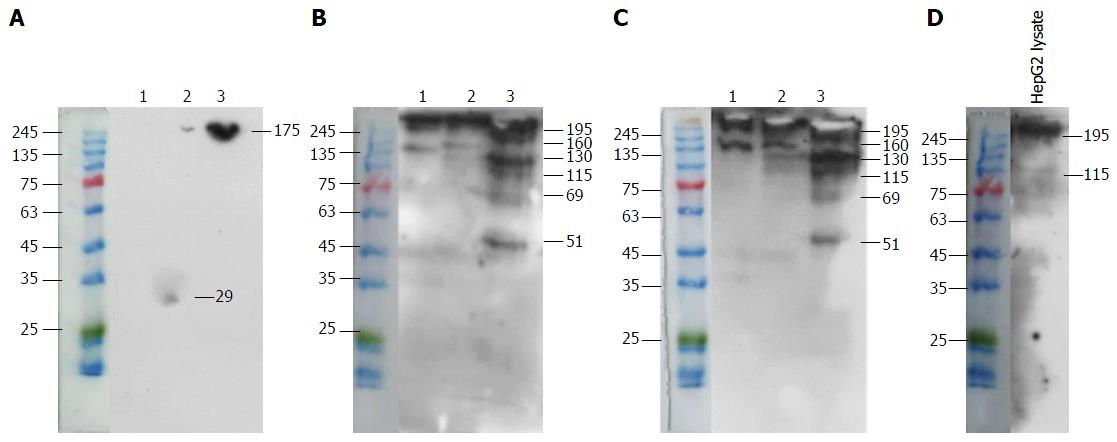
Figure 6 Specific antigen was precipitated from HepG2 lysate by mouse IgG1 (1), or anti-glypican-3 (2), or mAb 1E4-1D9 (3).
The antigen was electrophoresed in 10% sodium dodecylsulfate-polyacrylamide gel electrophoresis at 200V for 45 min in non-reduced condition and blotted onto PVDF membrane. The antigen was probed with mouse IgG1, isotype control (A), or anti-glypican-3 (B), or mAb 1E4-1D9 (C), compared to HepG2 lysate probed with anti-glypican-3 (D). The reaction was detected by horseradish peroxidase-conjugated rabbit anti-mouse Igs and visualized by SuperSignal™ West Pico Chemiluminescent Substrate. PVDF: Polyvinyl difluoride.
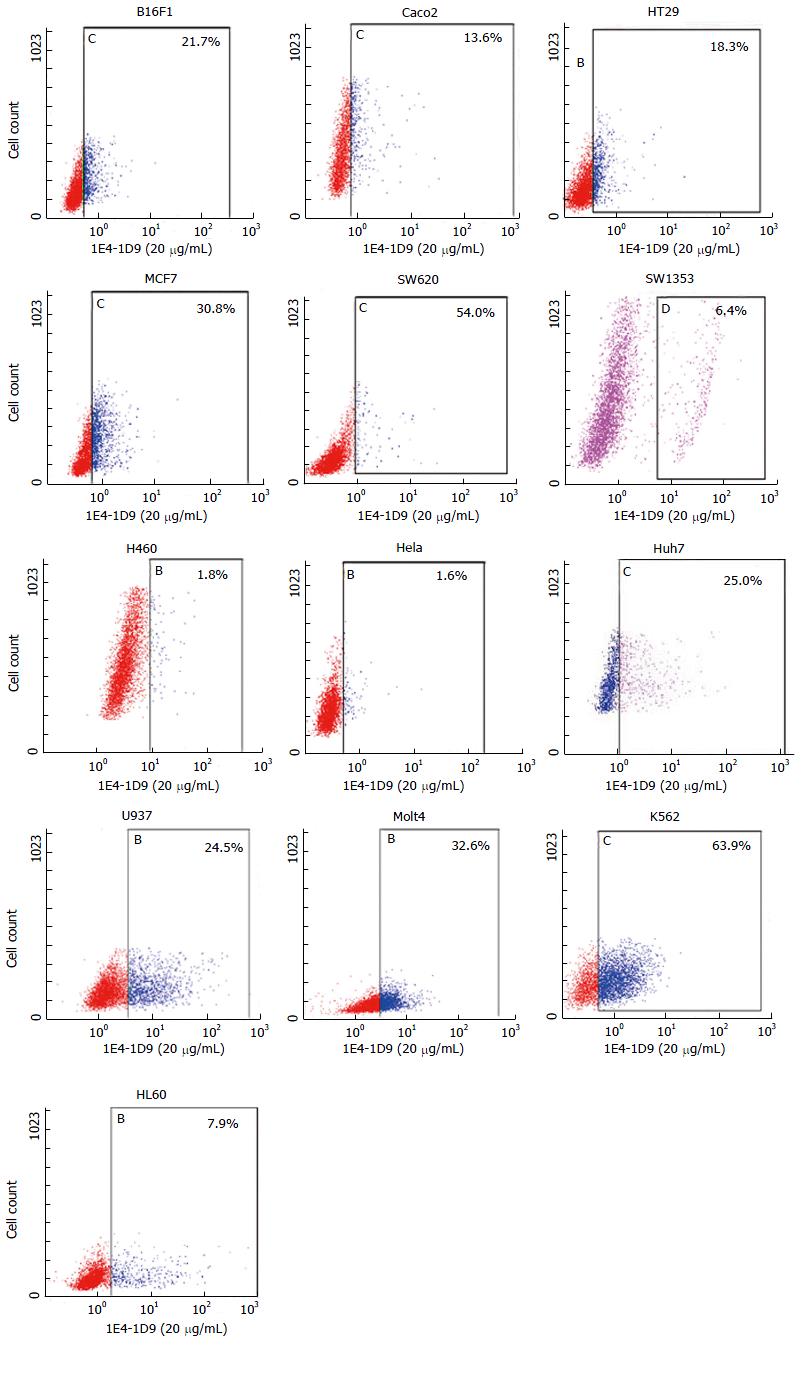
Figure 7 Expression of mAb 1E4-1D9 on solid tumor and hematopoietic tumor cell lines.
Various cell lines (4 × 10⁵ cells/mL) was reacted with mAb 1E4-1D9 (20 μg/mL) on ice for 30 min and washed 3 times with cold 1% bovine serum albumin-phosphate buffered saline, 0.02% NaN3. The reaction was detected by fluorescein isothiocyanate-conjugated rabbit anti-mouse Igs (1:20) and analyzed by flow cytometer. Mouse IgG1 was used as isotype control.
- Citation: Vongchan P, Linhardt RJ. Characterization of a new monoclonal anti-glypican-3 antibody specific to the hepatocellular carcinoma cell line, HepG2. World J Hepatol 2017; 9(7): 368-384
- URL: https://www.wjgnet.com/1948-5182/full/v9/i7/368.htm
- DOI: https://dx.doi.org/10.4254/wjh.v9.i7.368


