Copyright
©The Author(s) 2017.
World J Hepatol. Jul 18, 2017; 9(20): 884-895
Published online Jul 18, 2017. doi: 10.4254/wjh.v9.i20.884
Published online Jul 18, 2017. doi: 10.4254/wjh.v9.i20.884
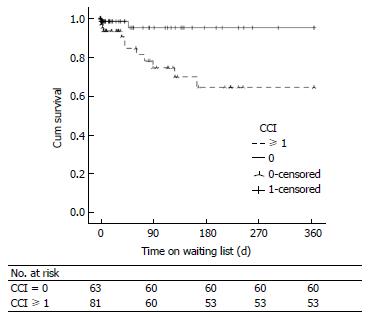
Figure 1 One-year waiting list survival according to the presence or absence of comorbidity.
Log-Rank = 6.798, P = 0.009. CCI: Charlson comorbidity index.
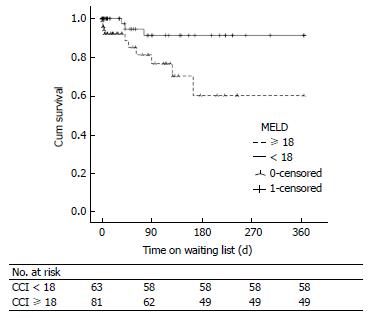
Figure 2 Waiting list survivals according to Model for end-stage liver disease score at listing (cut-off value of 18).
Log-Rank = 6.741, P = 0.009. CCI: Charlson comorbidity index; MELD: Model for end stage liver disease.
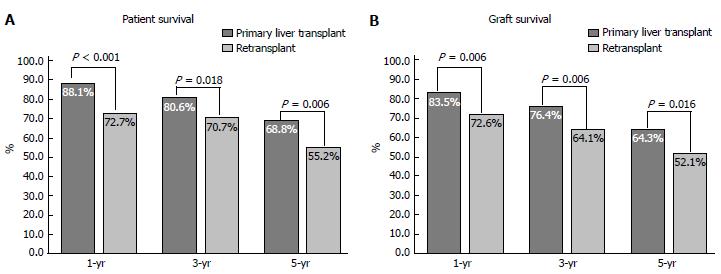
Figure 3 Post-transplant survival at 1, 3 and 5 years.
A: Post-transplant patient survival for PLT and LRT; B: Post-transplant graft survival for PLT and LRT. LRT: Liver retransplantation; PLT: Primary liver transplantation.
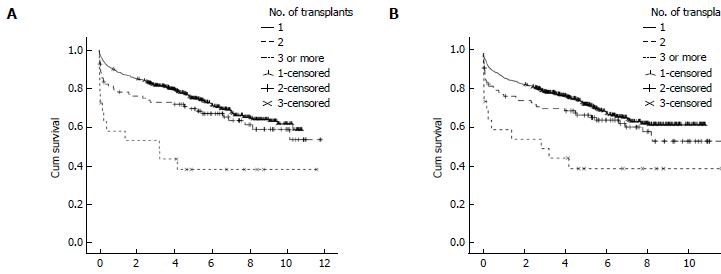
Figure 4 Post-transplant survival according to the number of transplants.
A: Kaplan Meier survial analysis of post-transplant patient survival according to the number of transplants. Log-Rank = 18.455, P < 0.001; B: Kaplan Meier survial analysis of post-transplant graft survival according to the number of transplants. Log-Rank = 13.737, P = 0.001.
- Citation: Al-Freah MAB, Moran C, Foxton MR, Agarwal K, Wendon JA, Heaton ND, Heneghan MA. Impact of comorbidity on waiting list and post-transplant outcomes in patients undergoing liver retransplantation. World J Hepatol 2017; 9(20): 884-895
- URL: https://www.wjgnet.com/1948-5182/full/v9/i20/884.htm
- DOI: https://dx.doi.org/10.4254/wjh.v9.i20.884


