Copyright
©The Author(s) 2017.
World J Hepatol. Jul 8, 2017; 9(19): 857-866
Published online Jul 8, 2017. doi: 10.4254/wjh.v9.i19.857
Published online Jul 8, 2017. doi: 10.4254/wjh.v9.i19.857
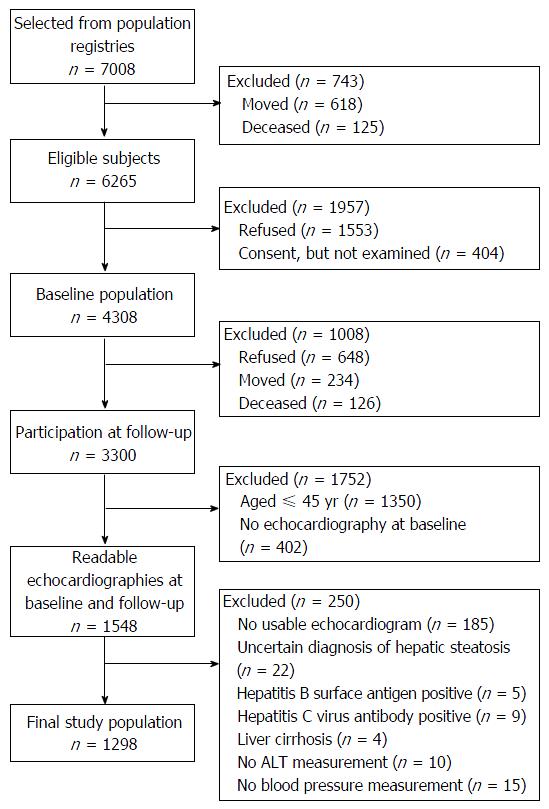
Figure 1 Flow-chart according to sample recruitment.
ALT: Alanine transferase.
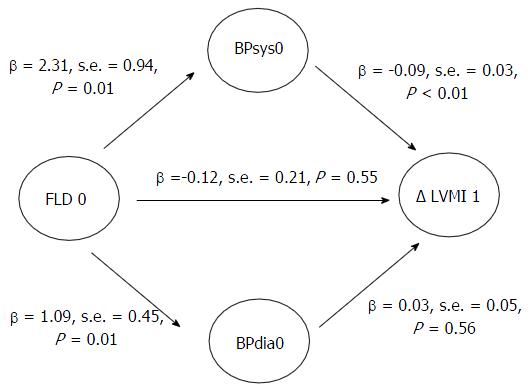
Figure 2 Path model for the effects of hepatic steatosis via systolic and diastolic blood pressure on left ventricular mass index in the whole study population (n = 1298).
χ2 = 3.2, df = 3, P = 0.36; RMSEA < 0.01; CFI > 0.99. Indirect Effect via BPsys0: β = -0.20; s.e. = 0.10; P = 0.07; Indirect Effect via BPdia0: β = 0.03; s.e. = 0.06; P = 0.60. FLD: Fatty liver disease; LVMI: Left ventricular mass index; BPsys: Systolic blood pressure; BPdia: Diastolic blood pressure; RMSEA: Root mean square error; CFI: Comparative fit index; s.e.: Standard error.
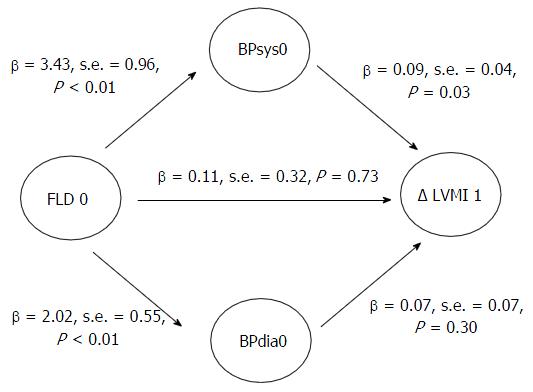
Figure 3 Path model for the effects of hepatic steatosis via systolic and diastolic blood pressure on left ventricular mass index in the subgroup of individuals without medication (n = 811).
χ2 = 1.9, df = 3, P = 0.60; RMSEA < 0.01; CFI > 0.99. Indirect Effect via BPsys0: β = -0.30; s.e. = 0.17; P = 0.07; Indirect Effect via BPdia0: β = 0.15; s.e. = 0.14; P = 0.30. FLD: Fatty liver disease; LVMI: Left ventricular mass index; BPsys: Systolic blood pressure; BPdia: Diastolic blood pressure; RMSEA: Root mean square error; CFI: Comparative fit index; s.e.: Standard error.
- Citation: Piontek K, Schmidt CO, Baumeister SE, Lerch MM, Mayerle J, Dörr M, Felix SB, Völzke H. Is hepatic steatosis associated with left ventricular mass index increase in the general population? World J Hepatol 2017; 9(19): 857-866
- URL: https://www.wjgnet.com/1948-5182/full/v9/i19/857.htm
- DOI: https://dx.doi.org/10.4254/wjh.v9.i19.857


