Copyright
©The Author(s) 2017.
World J Hepatol. May 18, 2017; 9(14): 657-666
Published online May 18, 2017. doi: 10.4254/wjh.v9.i14.657
Published online May 18, 2017. doi: 10.4254/wjh.v9.i14.657
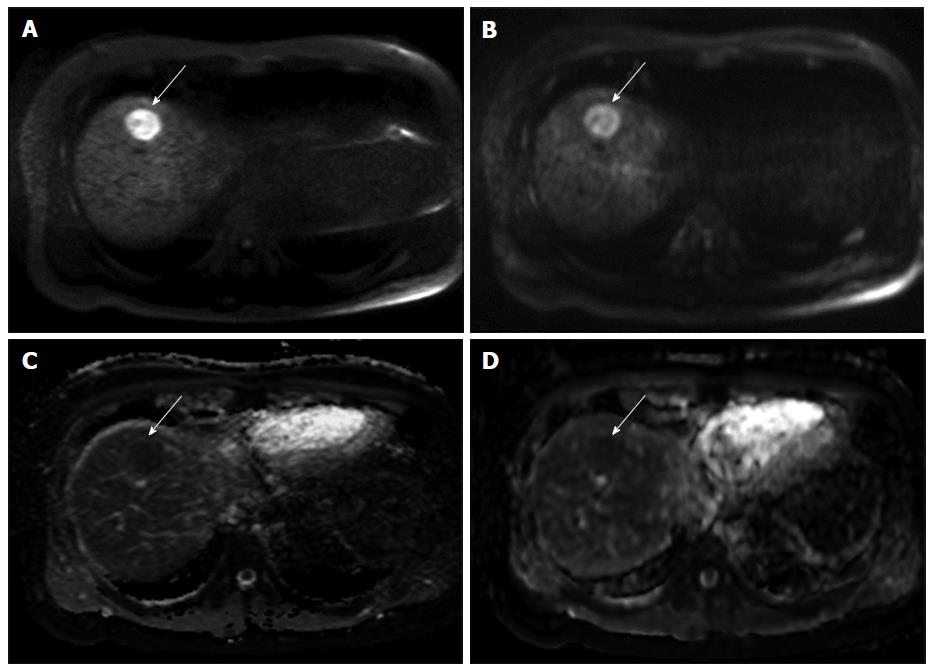
Figure 1 A 36-year-old male.
The HCC in segment 8 of the liver showing hyperintensity on FB-DWI (A) is more clearly described than on RT-DWI (B). The ADC values of HCC were 1.02 × 10⁻³ mm2/s on the ADC map of FB-DWI (C) and 1.16 × 10⁻³ mm2/s on the ADC map of RT-DWI (D). HCC: Hepatocellular carcinoma; FB-DWI: Free-breathing diffusion-weighted imaging; RT-DWI: Respiratory-triggering diffusion-weighted imaging; ADC: Apparent diffusion coefficient.
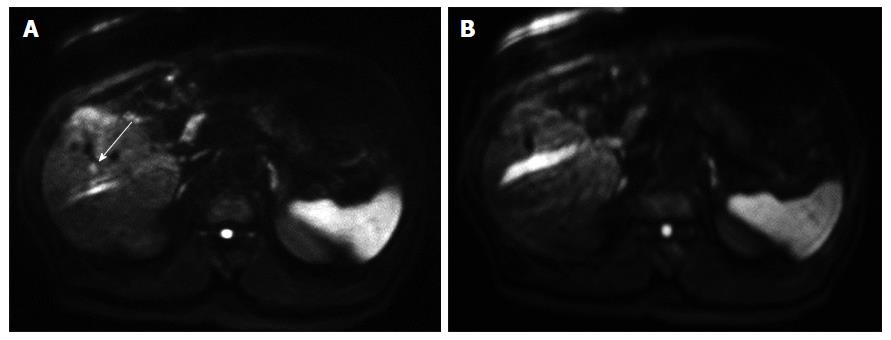
Figure 2 A 78-year-old female.
The HCC in segment 5 of the liver was detected by FB-DWI (A), whereas on RT-DWI, it was concealed by a chemical shift artifact (B). HCC: Hepatocellular carcinoma; FB-DWI: Free-breathing diffusion-weighted imaging; RT-DWI: Respiratory-triggering diffusion-weighted imaging.
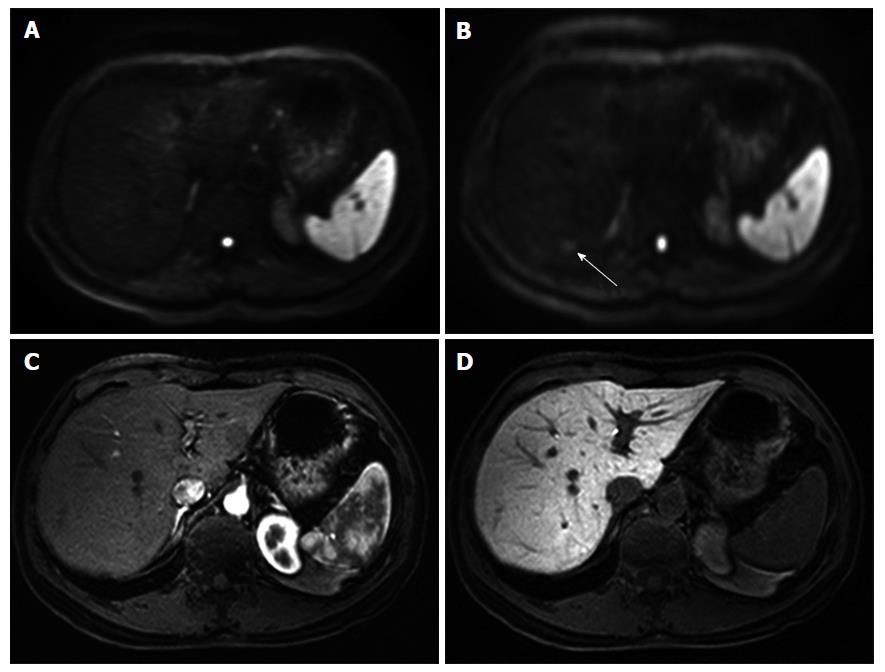
Figure 3 A 53-year-old female.
There was no detectable lesion on FB-DWI (A) but the nodular hyperintensity in segment 7 of the liver was seen on RT-DWI (B). It was diagnosed as a pseudolesion caused by a chemical shift artifact from fat tissue between the liver parenchyma and diaphragm, by referring to precontrast-enhanced imaging (C) and hepatobiliary phase imaging (D) of Gd-EOB-MRI. A follow-up MR examination also showed no progressive lesion (not shown). FB-DWI: Free-breathing diffusion-weighted imaging; RT-DWI: Respiratory-triggering diffusion-weighted imaging; Gd-EOB-MRI: Gadoxetic acid-enhanced magnetic resonance imaging.
- Citation: Takayama Y, Nishie A, Asayama Y, Ishigami K, Kakihara D, Ushijima Y, Fujita N, Shirabe K, Takemura A, Honda H. Image quality and diagnostic performance of free-breathing diffusion-weighted imaging for hepatocellular carcinoma. World J Hepatol 2017; 9(14): 657-666
- URL: https://www.wjgnet.com/1948-5182/full/v9/i14/657.htm
- DOI: https://dx.doi.org/10.4254/wjh.v9.i14.657


