Copyright
©The Author(s) 2016.
World J Hepatol. Dec 8, 2016; 8(34): 1497-1501
Published online Dec 8, 2016. doi: 10.4254/wjh.v8.i34.1497
Published online Dec 8, 2016. doi: 10.4254/wjh.v8.i34.1497
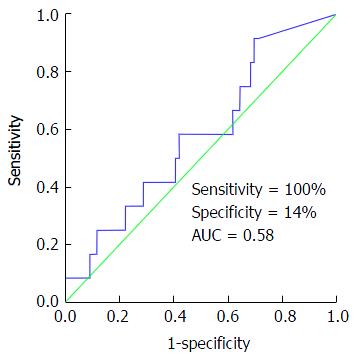
Figure 1 Receiver operator characteristics curve showing the poor accuracy of fractional excretion of sodium < 1% in diagnosing hepatorenal syndrome syndrome with area under the curve of 0.
58, P = 0.47-0.58. AUC: Area under the curve.
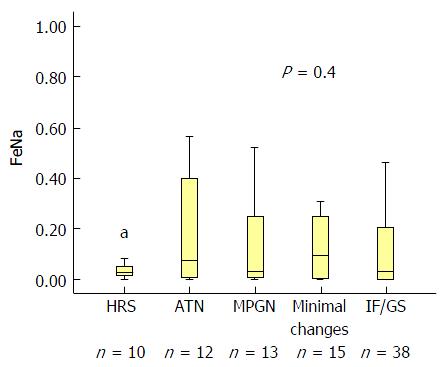
Figure 2 Correlation between fractional excretion of sodium as a continuous variable and kidney biopsy diagnosis.
Although FeNa was lowest in HRS patients, it did not differentiate between HRS and other renal pathologies (P = 0.41). FeNa: Fractional excretion of sodium; HRS: Hepatorenal syndrome; ATN: Acute tubular necrosis; MGPN: Membranoproliferative glomerulonephritis; IF: Interstitial fibrosis; GS: Glomerulosclerosis.
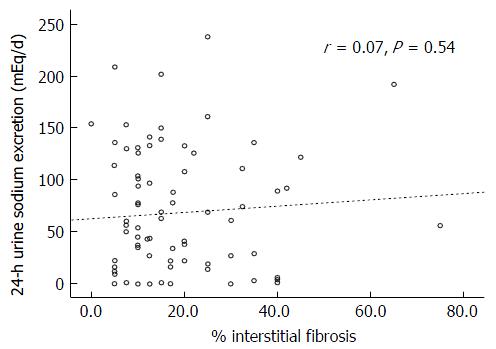
Figure 3 Scatter plot depicting the relationship between the percentage of interstitial fibrosis on kidney biopsy and 24-h urine sodium excretion.
Correlation was overall poor (r = 0.07, P = 0.54).
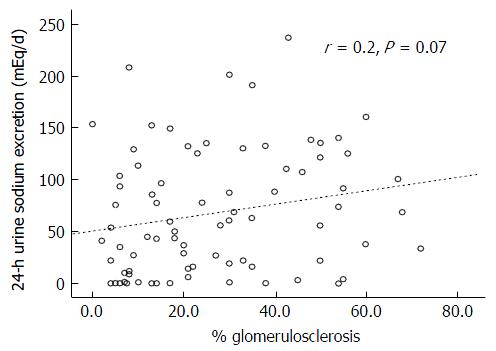
Figure 4 Scatter plot depicting the relationship between the percentage of glomerulosclerosis on kidney biopsy result and 24-h urine sodium excretion (r = 0.
2, P = 0.07). Correlation was better than the one observed with percentage of interstitial fibrosis but still did not reach statistical significance.
- Citation: Alsaad AA, Wadei HM. Fractional excretion of sodium in hepatorenal syndrome: Clinical and pathological correlation. World J Hepatol 2016; 8(34): 1497-1501
- URL: https://www.wjgnet.com/1948-5182/full/v8/i34/1497.htm
- DOI: https://dx.doi.org/10.4254/wjh.v8.i34.1497


