Copyright
©The Author(s) 2016.
World J Hepatol. Nov 28, 2016; 8(33): 1478-1488
Published online Nov 28, 2016. doi: 10.4254/wjh.v8.i33.1478
Published online Nov 28, 2016. doi: 10.4254/wjh.v8.i33.1478
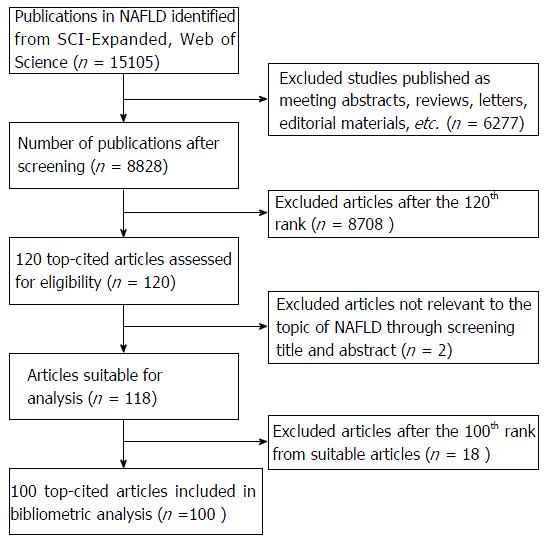
Figure 1 Flow chart of the selection process for the top 100 cited in nonalcoholic fatty liver disease.
NAFLD: Nonalcoholic fatty liver disease.
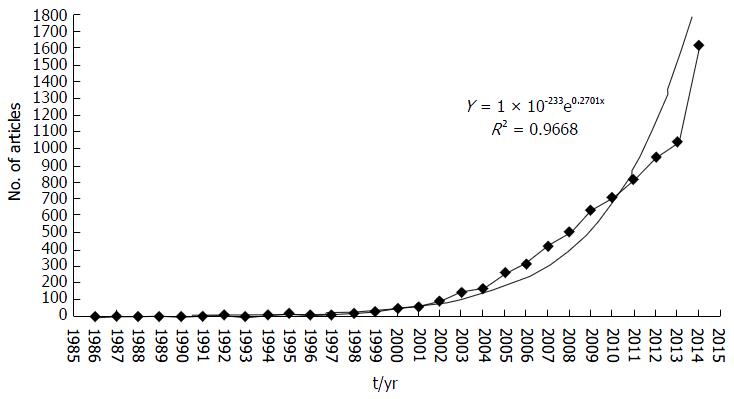
Figure 2 Number of global SCI Journal articles varies with time.
Remarks: Fitting equation during 1985-2015 is: Y = 1 × 10-233e0.2701x, R2 = 0.9668. In the equation, Y is the number of accumulation articles and X is the sequence number of year. It indicated that research on NAFLD entered an exponential growth phase since 2004. NAFLD: Nonalcoholic fatty liver disease.
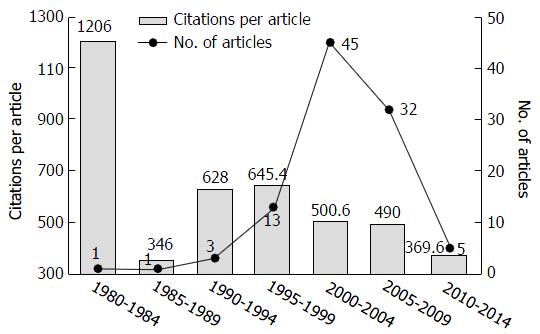
Figure 3 Number of the top 100 cited papers in nonalcoholic fatty liver disease per five year and the mean of the citation of the top cited paper with five years bin.
- Citation: Zhang TS, Qin HL, Wang T, Li HT, Li H, Xia SH, Xiang XH. Bibliometric analysis of top 100 cited articles in nonalcoholic fatty liver disease research. World J Hepatol 2016; 8(33): 1478-1488
- URL: https://www.wjgnet.com/1948-5182/full/v8/i33/1478.htm
- DOI: https://dx.doi.org/10.4254/wjh.v8.i33.1478


