Copyright
©The Author(s) 2016.
World J Hepatol. Sep 28, 2016; 8(27): 1137-1148
Published online Sep 28, 2016. doi: 10.4254/wjh.v8.i27.1137
Published online Sep 28, 2016. doi: 10.4254/wjh.v8.i27.1137
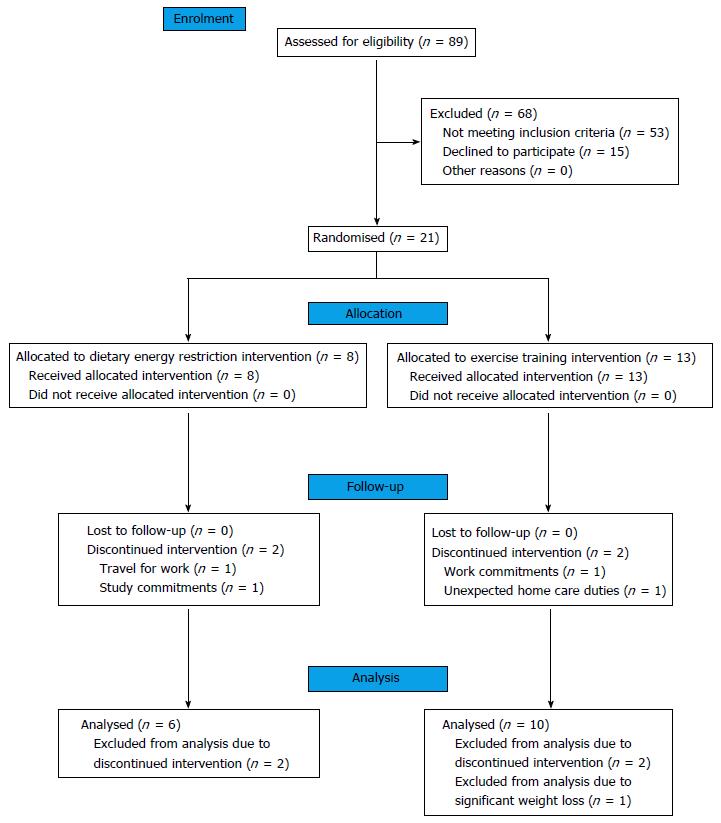
Figure 1 Consort diagram describing the flow of patients through the randomised controlled trial.
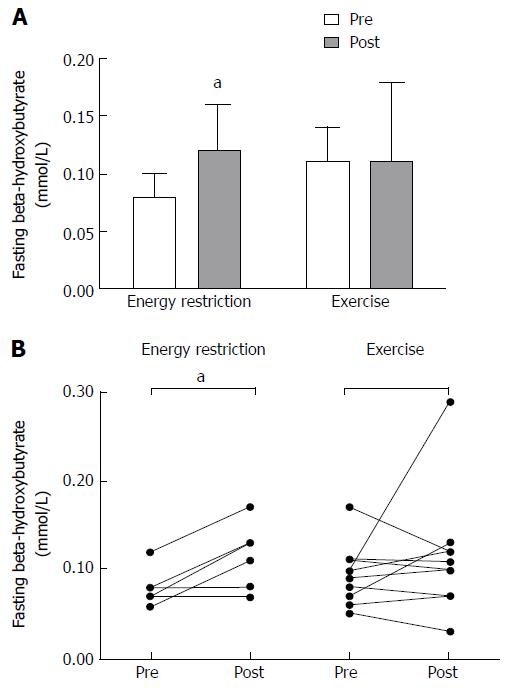
Figure 2 Basal β-hydroxybutyrate concentrations before and after 6 mo of energy restriction (n = 6) or exercise training (n = 10).
A: Average responses; B: Individual responses. aP < 0.05 between pre and post treatment.
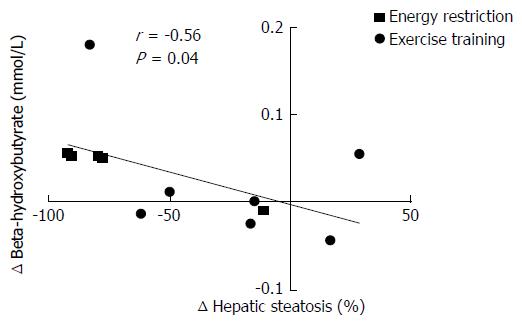
Figure 3 Relationship between change in β-hydroxybutyrate concentrations and relative change in hepatic steatosis in response to 6 mo of energy restriction or exercise training (n = 13).
This relationship remained significant after controlling for changes in body weight (r = -0.67, P = 0.02).
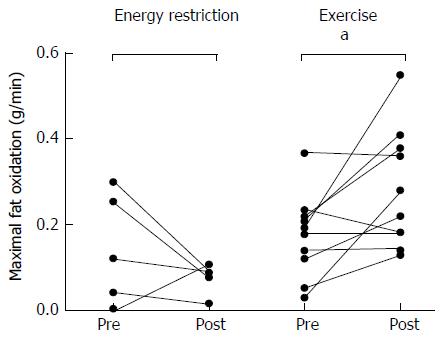
Figure 4 Maximal fat oxidation before and after six months of energy restriction (n = 6) or exercise training (n = 10); individual data.
aP < 0.05 between pre and post intervention.
- Citation: Croci I, Byrne NM, Chachay VS, Hills AP, Clouston AD, O’Moore-Sullivan TM, Prins JB, Macdonald GA, Hickman IJ. Independent effects of diet and exercise training on fat oxidation in non-alcoholic fatty liver disease. World J Hepatol 2016; 8(27): 1137-1148
- URL: https://www.wjgnet.com/1948-5182/full/v8/i27/1137.htm
- DOI: https://dx.doi.org/10.4254/wjh.v8.i27.1137


