Copyright
©The Author(s) 2016.
World J Hepatol. Aug 8, 2016; 8(22): 942-948
Published online Aug 8, 2016. doi: 10.4254/wjh.v8.i22.942
Published online Aug 8, 2016. doi: 10.4254/wjh.v8.i22.942
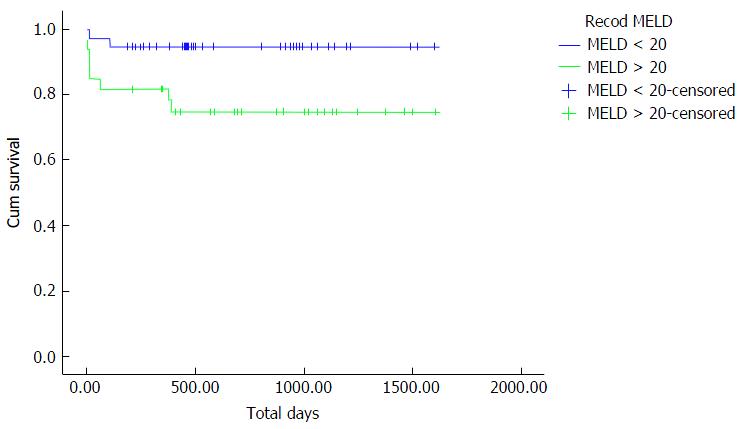
Figure 1 Kaplan-Meier curve for overall survival of both groups.
The Group 1 patients that had a MELD score < 20 had higher overall survival rates than the Group 2 patients that had a MELD score > 20. MELD: Model for end-stage liver disease; Cum survival: Cumulative survival.
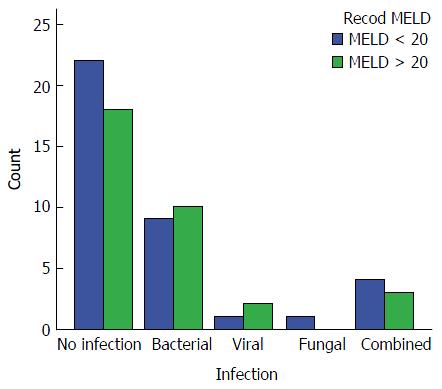
Figure 2 Infection rates in both groups.
MELD: Model for end-stage liver disease.
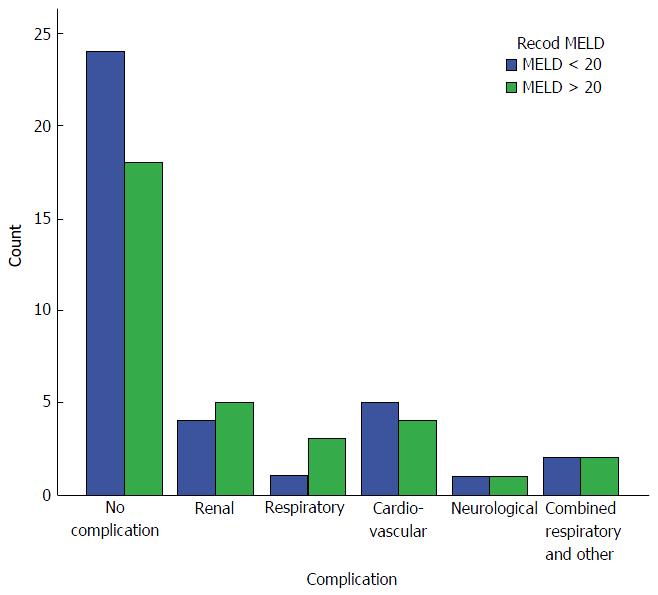
Figure 3 Incidence of systemic complications in both groups.
MELD: Model for end-stage liver disease.
- Citation: Dabbous H, Sakr M, Abdelhakam S, Montasser I, Bahaa M, Said H, El-Meteini M. Living donor liver transplantation for high model for end-stage liver disease score: What have we learned? World J Hepatol 2016; 8(22): 942-948
- URL: https://www.wjgnet.com/1948-5182/full/v8/i22/942.htm
- DOI: https://dx.doi.org/10.4254/wjh.v8.i22.942


