Copyright
©The Author(s) 2016.
World J Hepatol. Jul 18, 2016; 8(20): 850-857
Published online Jul 18, 2016. doi: 10.4254/wjh.v8.i20.850
Published online Jul 18, 2016. doi: 10.4254/wjh.v8.i20.850
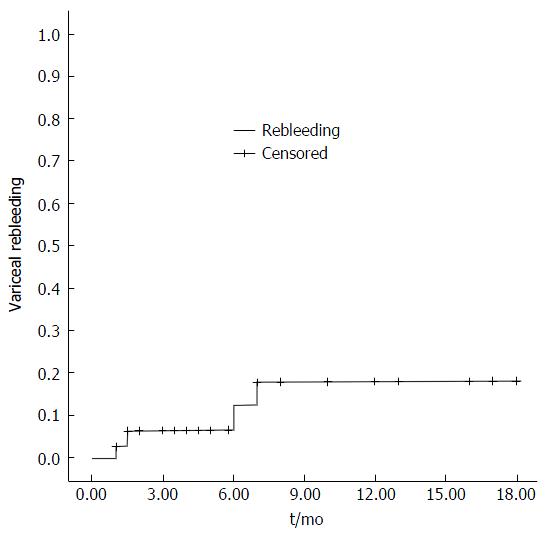
Figure 1 Graph of Kaplan-Meier estimation of cumulative percentages of rebleeding.
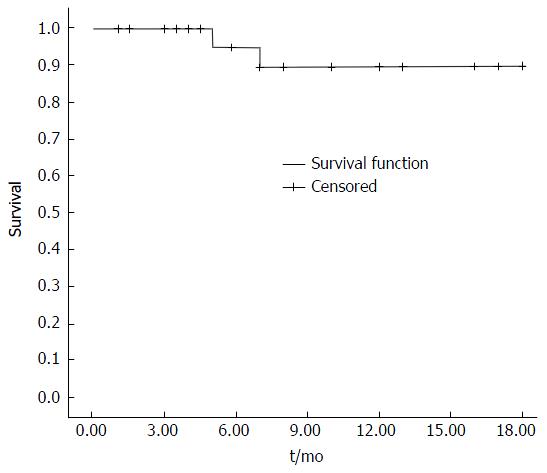
Figure 2 Kaplan-Meier plot shows the rates of survival after transjugular intrahepatic portosystemic shunt placement.
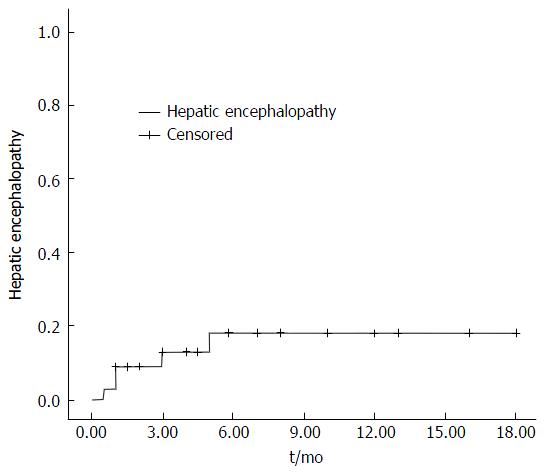
Figure 3 Actuarial probability of hepatic encephalopathy in 81 patients treated with transjugular intrahepatic portosystemic shunt + stomach and esophageal variceal embolization.
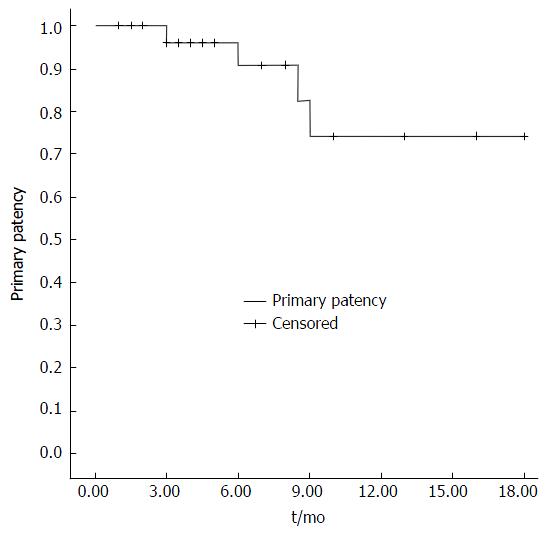
Figure 4 Graph of Kaplan-Meier estimation of cumulative percentages of patients with primary shunt patency in all patients undergoing transjugular intrahepatic portosystemic shunt + stomach and esophageal variceal embolization.
- Citation: Jiang Q, Wang MQ, Zhang GB, Wu Q, Xu JM, Kong DR. Transjugular intrahepatic portosystemic shunt combined with esophagogastric variceal embolization in the treatment of a large gastrorenal shunt. World J Hepatol 2016; 8(20): 850-857
- URL: https://www.wjgnet.com/1948-5182/full/v8/i20/850.htm
- DOI: https://dx.doi.org/10.4254/wjh.v8.i20.850


