Copyright
©The Author(s) 2016.
World J Hepatol. Jun 8, 2016; 8(16): 673-684
Published online Jun 8, 2016. doi: 10.4254/wjh.v8.i16.673
Published online Jun 8, 2016. doi: 10.4254/wjh.v8.i16.673
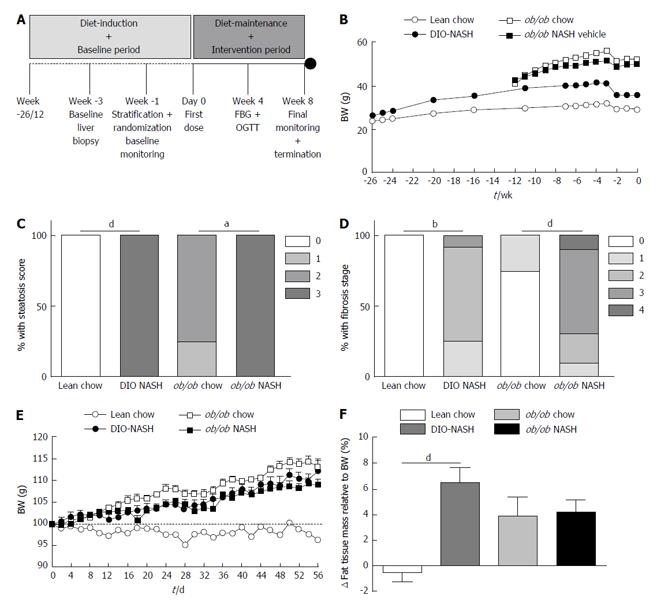
Figure 1 Study design, body weight regulation and liver biopsy-confirmed disease development.
A: Study design of the DIO-NASH and ob/ob NASH mouse models; B: BW during diet-induction and baseline period (monitoring and biopsy-recovery); C and D: Liver biopsy-derived histopathological assessment of (C) steatosis score (0-3), and (D) fibrosis stage (0-4); E and F: Change in BW (E), and change in adiposity (F), during diet-maintenance and intervention period (repeated vehicle dosing). aP < 0.05, bP < 0.01, dP < 0.001. The results are presented as mean ± SEM. Lean chow (n = 9), DIO-NASH (n = 12), ob/ob chow (n = 8), ob/ob NASH (n = 10). NASH: Nonalcoholic steatohepatitis; BW: Body weight; OGTT: Oral glucose tolerance test; FBG: Fed blood glucose; SEM: Standard error of the mean.
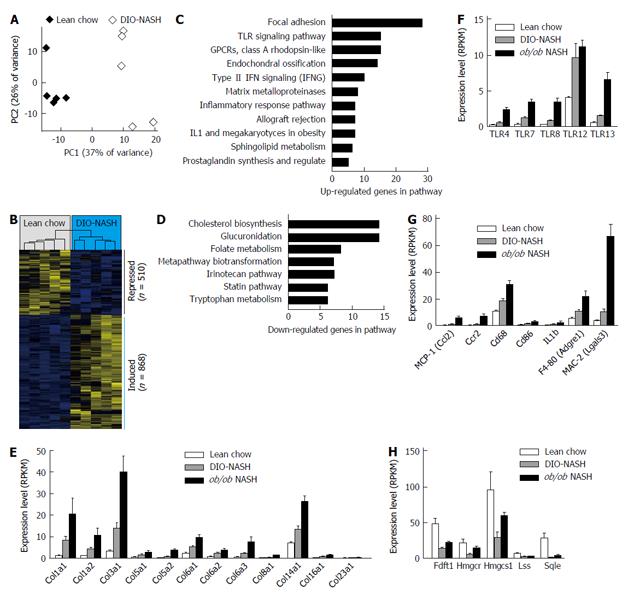
Figure 2 Gene expression analysis by RNAsequencing and bioinformatics.
A: Principal component analysis of the 500 most variable genes, [principal component (PC)]; B: Hierarchical clustering of the differentially expressed genes, bars on the right indicate the induced and repressed genes; C: Pathways enriched for the induced (up-regulated) genes, filtered for P < 0.01 and n > 4; D: Same as (C) for the down-regulated genes; E-H: Expression levels of selected differentially expressed genes shown as mean ± SEM. Lean chow (n = 5), DIO-NASH (n = 5), ob/ob NASH (n = 5). NASH: Nonalcoholic steatohepatitis; BW: Body weight; TLR: Toll-like receptor; IFN: Interferon; IL1: Interleukine 1; MCP-1: Monocyte chemoattractant protein-1; GPCRs: G protein-coupled receptors; IFNG: Interferon gamma; RPKM: Reads per kilobase of transcript per million mapped reads; SEM: Standard error of the mean.
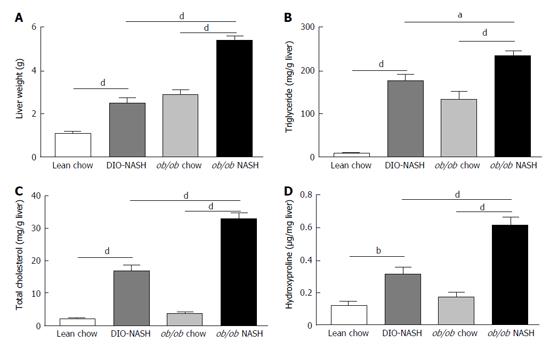
Figure 3 Liver weight and hepatic lipid and collagen content at study end.
Liver weight at termination (A), hepatic triglyceride content (B), hepatic total cholesterol content (C), and hepatic hydroxyproline (collagen) content (D) at study end. aP < 0.05, bP < 0.01, dP < 0.001. The results are presented as mean ± SEM. Lean chow (n = 9), DIO-NASH (n = 12), ob/ob chow (n = 8), ob/ob NASH (n = 10). NASH: Nonalcoholic steatohepatitis; BW: Body weight; SEM: Standard error of the mean.
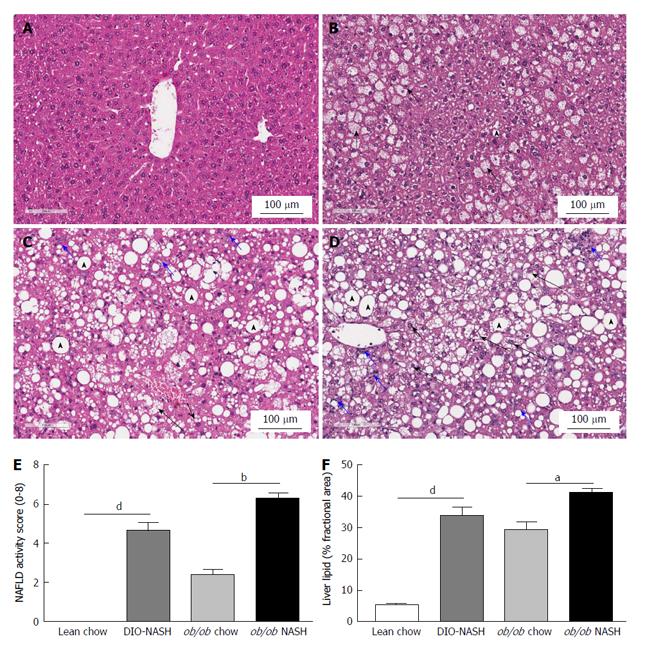
Figure 4 Histological assessment of non-alcoholic fatty liver disease activity score and liver lipid at study end.
Representative H and E stained sections from; lean chow (A), ob/ob chow (B), DIO-NASH (C) and ob/ob NASH (D) mouse models. NAFLD activity score (steatosis, inflammation and ballooning degeneration) performed by a blinded pathologist at study end (E), and quantitatively image analysis of steatosis (% area) from H and E staining using visiomorph software (F). Macrovesicular steatosis indicated by arrowheads, microvesicular steatosis indicated by short black arrows, inflammation indicated by short blue arrows, ballooning degeneration indicated by long black arrows. aP < 0.05, bP < 0.01, dP < 0.001. The results are presented as mean ± SEM. Lean chow (n = 9), DIO-NASH (n = 12), ob/ob chow (n = 8), ob/ob NASH (n = 10). NASH: Nonalcoholic steatohepatitis; NAFLD: Nonalcoholic fatty liver disease; SEM: Standard error of the mean.
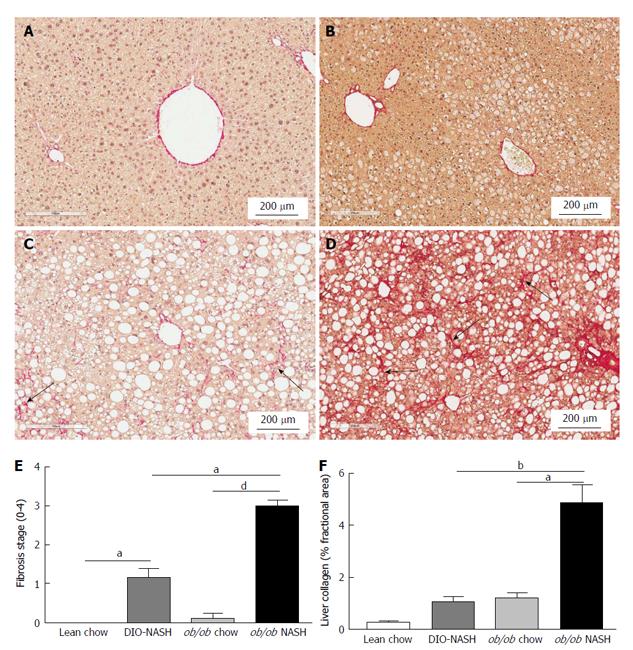
Figure 5 Histological assessment of fibrosis stage and liver collagen at study end.
Representative sirius red stained sections from; lean chow (A), ob/ob chow (B), DIO-NASH (C) and ob/ob NASH (D) mouse model. Liver fibrosis stage performed by a blinded pathologist at study end (E), and quantitatively image analysis of collagen (% area) from sirius red staining using visiomorph software (F). Fibrous band formation indicated by black arrows. aP < 0.05, bP < 0.01, dP < 0.001. The results are presented as mean ± SEM. Lean chow (n = 9), DIO-NASH (n = 12), ob/ob chow (n = 8), ob/ob NASH (n = 10). NASH: Nonalcoholic steatohepatitis; SEM: Standard error of the mean.
- Citation: Kristiansen MNB, Veidal SS, Rigbolt KTG, Tølbøl KS, Roth JD, Jelsing J, Vrang N, Feigh M. Obese diet-induced mouse models of nonalcoholic steatohepatitis-tracking disease by liver biopsy. World J Hepatol 2016; 8(16): 673-684
- URL: https://www.wjgnet.com/1948-5182/full/v8/i16/673.htm
- DOI: https://dx.doi.org/10.4254/wjh.v8.i16.673


