Copyright
©The Author(s) 2015.
World J Hepatol. Nov 18, 2015; 7(26): 2664-2675
Published online Nov 18, 2015. doi: 10.4254/wjh.v7.i26.2664
Published online Nov 18, 2015. doi: 10.4254/wjh.v7.i26.2664
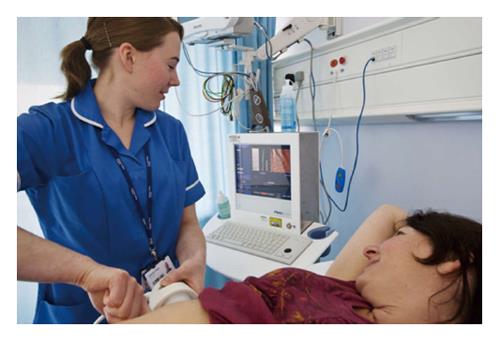
Figure 1 Transient elastography.
A specialist nurse places the probe perpendicular to the surface of the liver. A low frequency shear wave is generated along the same axis as the ultrasound transducer. The velocity of the shear wave through the liver is measured by a high frequency ultrasound signal and the output displayed as stiffness, in kPa, alongside a two-dimensional “elastogram”. The output is the median of 10 measurements, with a success rate of > 66% and an interquartile range of measurements < 1/3 of the median considered satisfactory.
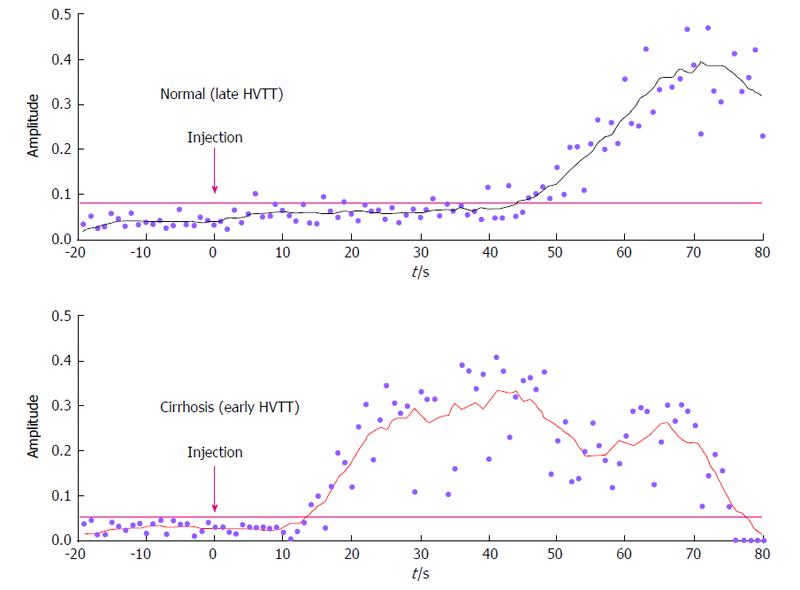
Figure 2 Hepatic vascular transit times.
Time intensity curves from the hepatic vein plotted in a normal patient and a patient with cirrhosis, showing earlier arrival of contrast in the cirrhotic liver. Adapted from Lim et al[22] 2005. HVTT: Hepatic vascular transit times.
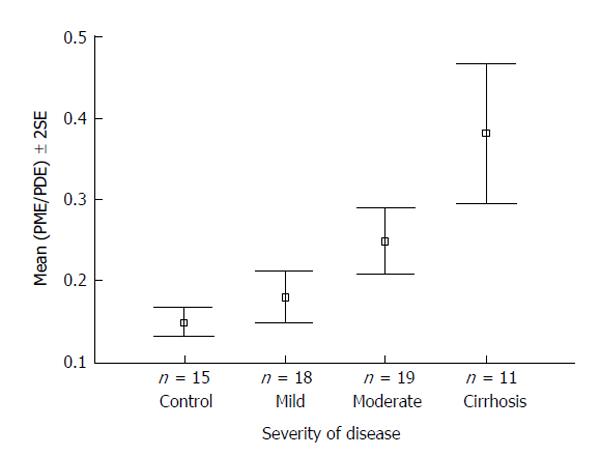
Figure 3 31P magnetic resonance spectroscopy.
PME/PDE ratios obtained from in vivo hepatic 31P MRS varying with severity of hepatitis C-associated liver disease. Adapted from Lim et al[26] 2003. MRS: Magnetic resonance spectroscopy; PME: Phosphomonoester; PDE: Phosphodiester.
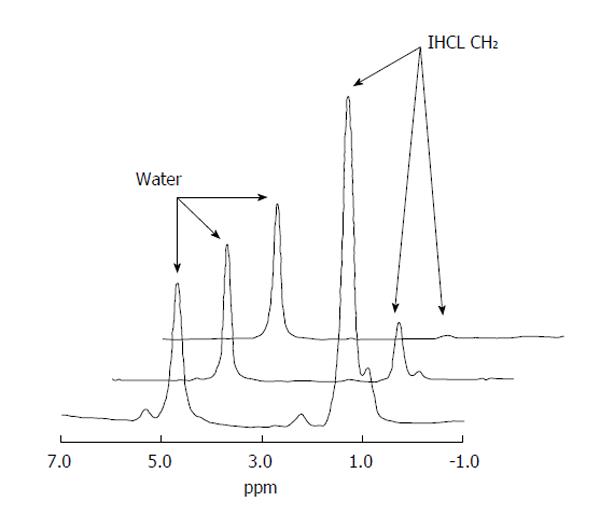
Figure 4 1H magnetic resonance spectroscopy.
Proton (1H) MR Spectra (left to right) from: (1) a patient with significant hepatic steatosis; (2) a patient with mild hepatic steatosis; and (3) a healthy volunteer. The intrahepatocellular (IHCL) lipid resonance is many times larger in (1) than (3), with the hepatic water resonance scaled to the same height for comparative purposes. Candidate markers for hepatocellular carcinoma which have been proposed in the literature. Most reflect high cellular turnover exhibited by tumours, but the majority lack sensitivity and specificity (see text for further explanations). Reproduced from Thomas et al[27] 2005. ppm: Parts per million; IHCL CH2: Intrahepatocellular lipid.
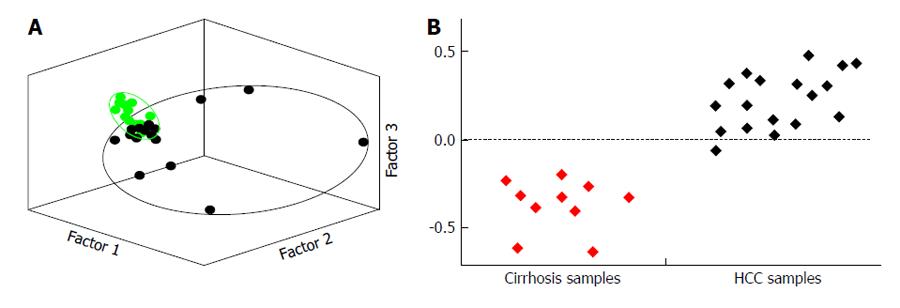
Figure 5 Principal components multivariate statistical analysis (A) and partial least squared discriminant multivariate statistical analysis (B).
A: Principal components multivariate statistical analysis scatter plot showing statistical separation of data sets of urinary nuclear magnetic (NMR) spectroscopy information of hepatocellular carcinoma (HCC) subjects (small black spots), compared to urinary data sets from healthy controls (small green spots); B: Partial least squared discriminant multivariate statistical analysis showing statistical differentiation of metabolite information from HCC subjects obtained using NMR spectroscopy, compared to similar urinary data sets from patients with cirrhosis. These are the essential raisons d’être for searching and using urinary biomarkers for the early and reliable diagnosis of HCC, but promising research is still being undertaken to this end (Figure 6).
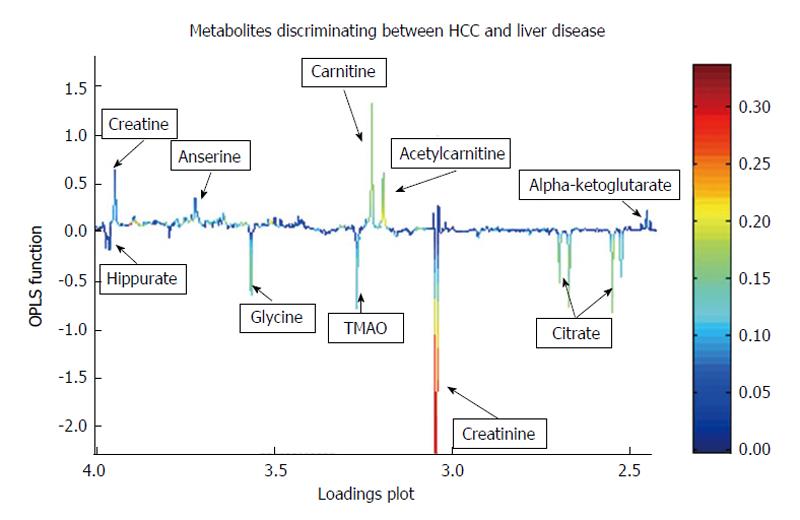
Figure 6 Statistical “loadings plot” of information obtained from an urinary nuclear magnetic resonance spectroscopy data set showing metabolites upregulated in hepatocellular carcinoma (upward peaks: Carnitine, anserine, creatine, acetylcarnitine, alpha-ketoglutarate) and downregulated in hepatocellular carcinoma (downward pointing peaks: Hippurate, glycine, trimethylamineoxide, creatinine, citrate), compared to urinary nuclear magnetic resonance spectroscopy data from patients with cirrhosis.
Most metabolites represent alternative energy metabolites as liver tumours are not solely dependent on glycolysis for an energy source. HCC: Hepatocellular carcinoma; TMA: Trimethylamineoxide; OPLS: Orthogonal partial least squares discriminant analysis.
- Citation: Trovato FM, Tognarelli JM, Crossey MM, Catalano D, Taylor-Robinson SD, Trovato GM. Challenges of liver cancer: Future emerging tools in imaging and urinary biomarkers. World J Hepatol 2015; 7(26): 2664-2675
- URL: https://www.wjgnet.com/1948-5182/full/v7/i26/2664.htm
- DOI: https://dx.doi.org/10.4254/wjh.v7.i26.2664


