Copyright
©The Author(s) 2015.
World J Hepatol. Aug 18, 2015; 7(17): 2069-2079
Published online Aug 18, 2015. doi: 10.4254/wjh.v7.i17.2069
Published online Aug 18, 2015. doi: 10.4254/wjh.v7.i17.2069
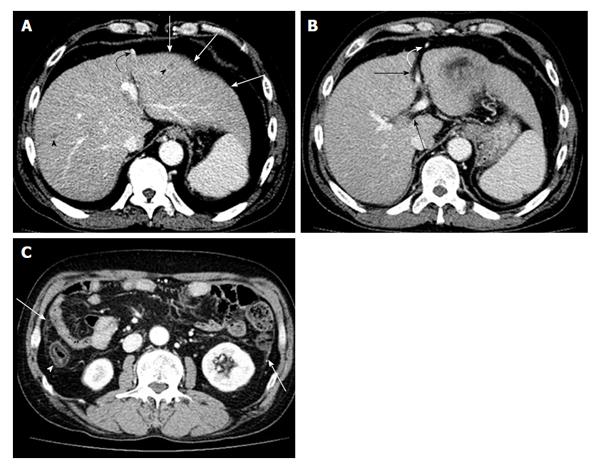
Figure 1 Contrast enhanced computed tomography portal phase images of the patient with liver cirrhosis due to chronic hepatitis B.
A: Liver shows surface undulation (arrows). Two small low attenuated nodules are seen in both hepatic lobes suggesting regenerative nodules (arrow heads). Recanalized paraumbilical vein and paraesophageal varix are noted (curved arrow); B: Recanalization of paraumbilical vein (curved arrow) represents portal hypertension. Widening of hepatic fissure and porta hepatis is seen (black arrows); C: Ascending colon presents edematous wall thickening caused by congestion due to portal hypertension or hypoalbuminemic edema (curved arrow). Diffuse peritoneal thickening is also noted (arrows).
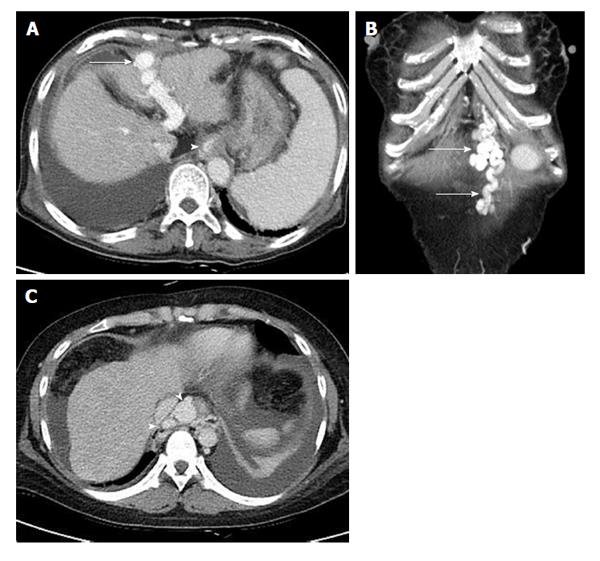
Figure 2 Image of liver cirrhosis caused by chronic hepatitis B.
Contrast enhanced computed tomography portal phase images show multiple collateral vessels of portal vein. A: The image presents large intrahepatic portosystemic shunt through left portal vein and recanalized paraumbilical vein (arrow). Lower esophageal varix is seen (arrow head); B: Coronal image shows prominent paraumbilical veins (arrows); C: Axial image shows engorged paraesophageal varix (arrow heads) which usually supplied by left gastric vein and drained into azygos- or hemiazygos-vein.
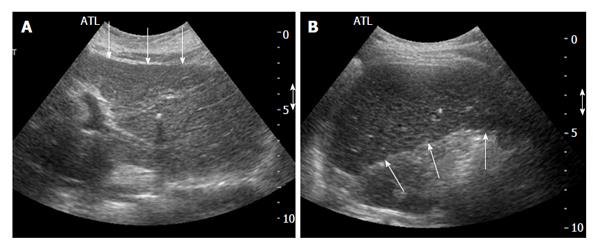
Figure 3 Transaxial scan.
A: Transaxial epigastric scan shows the left lobe of the liver with surface irregularity (arrows), and coarse parenchyma echotexture; B: Subcostal transaxial scan shows the inferior margin of right hepatic lobe with irregular surface (arrows).
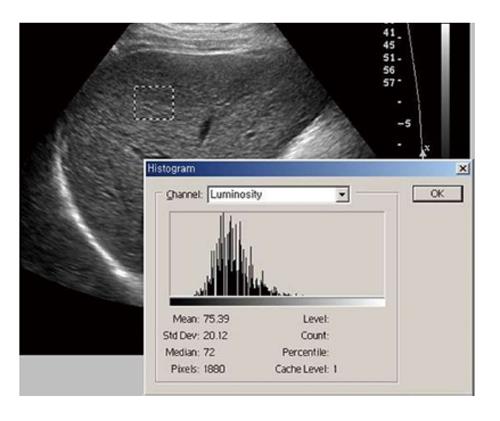
Figure 4 The region of interest of texture analysis is positioned in the right lobe of the liver, with an intercostals scan performed with gray scale ultrasonography.
Chronic liver disease patient shows heterogeneous parenchymal echogenecity with high standard deviation value (Area: 1880 pixels, Mean: 75.39, SD: 20.12).
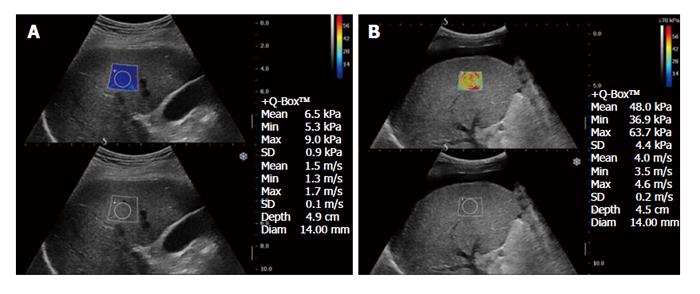
Figure 5 The region of interest of supersonic shear wave imaging is positioned in the right lobe of the liver, with an intercostals scan.
On the right of the display there is shear wave velocity (expressed in kPa and m/s). The display show a real-time color mapping of the elasticity encoded pixel by pixel in an image superimposed on the standard B-mode. In panel (A) subject with normal shear wave speed value. In panel (B) patient with shear wave speed value compatible with liver cirrhosis. The display also shows large amount of ascites.
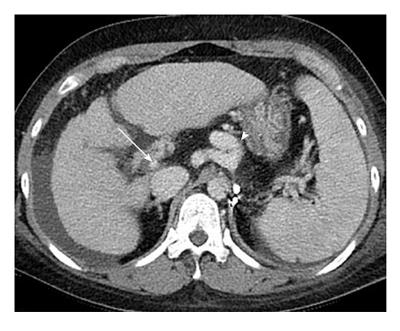
Figure 6 Image of liver cirrhosis caused by chronic hepatitis B.
Contrast enhanced computed tomography portal phase image shows the liver with irregular surface and heterogeneous enhancement of parenchyma with reticular pattern suggesting confluent fibrosis. The image shows decreased diameter of portal vein (arrow) due to large collateral vessels (arrow head) and also shows large amount of ascites.
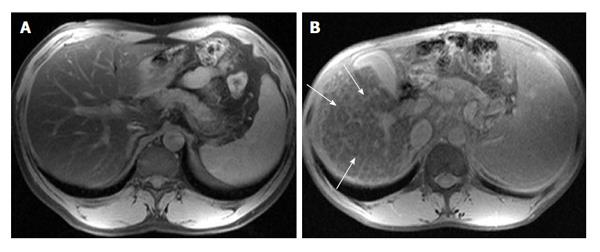
Figure 7 Double contrast enhanced protocol magnetic resonance images.
Fat saturated T2-weighted magnetic resonance images of 15-min delay after injection of superparamagnetic iron oxides and gadolinium chelates. A: The image of normal patient shows homogenous low signal intensity of hepatic parenchyma; B: The image of patient with liver cirrhosis shows hyperintense reticulations (arrows), represent septal fibrosis, in cirrhotic liver.
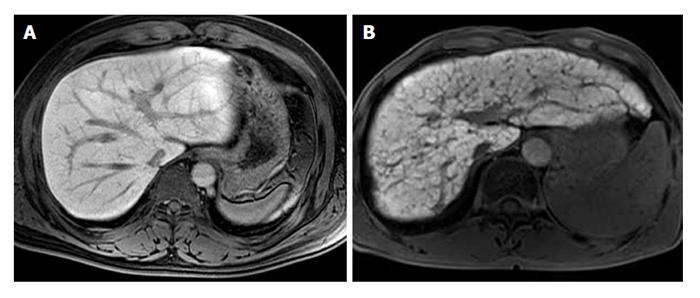
Figure 8 Fat saturated T1-weighted magnetic resonance images of 20-min delay after injection of gadoxetate disodium.
A: The image of healthy patient shows homogenous high signal intensity of hepatic parenchyma; B: The image of patient with liver cirrhosis shows heterogeneity of hepatic parenchyma enhancement with hypointense reticulations representing septal fibrosis, and decreased enhancement degree as compared with the image (A).
- Citation: Yeom SK, Lee CH, Cha SH, Park CM. Prediction of liver cirrhosis, using diagnostic imaging tools. World J Hepatol 2015; 7(17): 2069-2079
- URL: https://www.wjgnet.com/1948-5182/full/v7/i17/2069.htm
- DOI: https://dx.doi.org/10.4254/wjh.v7.i17.2069


