Copyright
©2013 Baishideng Publishing Group Co.
World J Hepatol. Mar 27, 2013; 5(3): 149-151
Published online Mar 27, 2013. doi: 10.4254/wjh.v5.i3.149
Published online Mar 27, 2013. doi: 10.4254/wjh.v5.i3.149
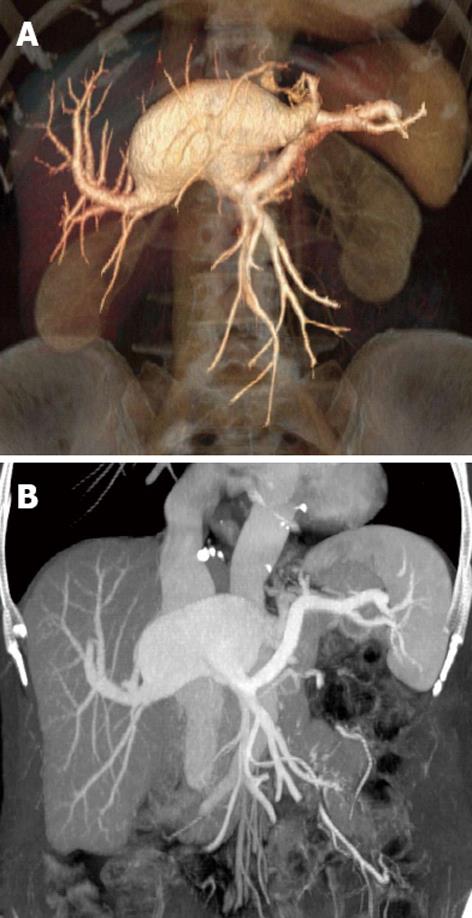
Figure 1 Computed tomography.
A: Volume rendering reconstruction of the aneurysm; B: Maximum intensity projection of the aneurysm.
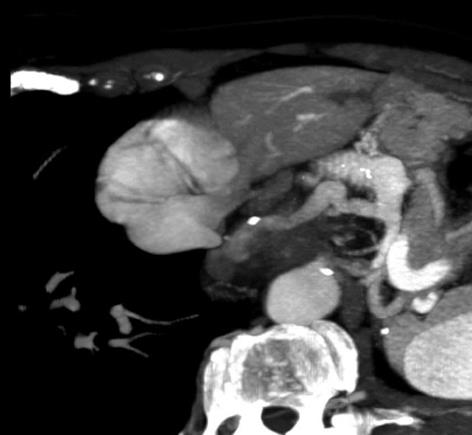
Figure 2 Computed tomography multi-planar reformation oblique and maximum intensity projection of the esophageal varices’ venous collector.
Observation of slow refilling indicated prehepatic portal hypertension.
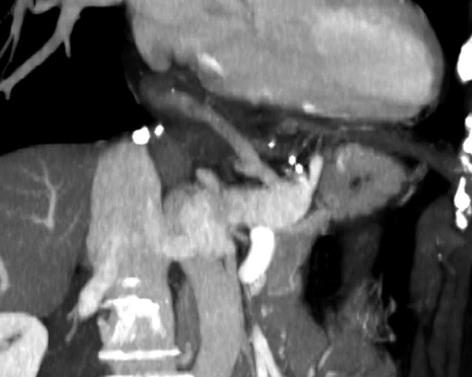
Figure 3 Computed tomography oblique maximum intensity projection on the long axis of the variceal collector showing the gastric varix.
- Citation: Debernardi-Venon W, Stradella D, Ferruzzi G, Marchisio F, Elia C, Rizzetto M. Extrahepatic aneurysm of the portal venous system and portal hypertension. World J Hepatol 2013; 5(3): 149-151
- URL: https://www.wjgnet.com/1948-5182/full/v5/i3/149.htm
- DOI: https://dx.doi.org/10.4254/wjh.v5.i3.149


