Copyright
©2013 Baishideng Publishing Group Co.
World J Hepatol. Mar 27, 2013; 5(3): 137-144
Published online Mar 27, 2013. doi: 10.4254/wjh.v5.i3.137
Published online Mar 27, 2013. doi: 10.4254/wjh.v5.i3.137
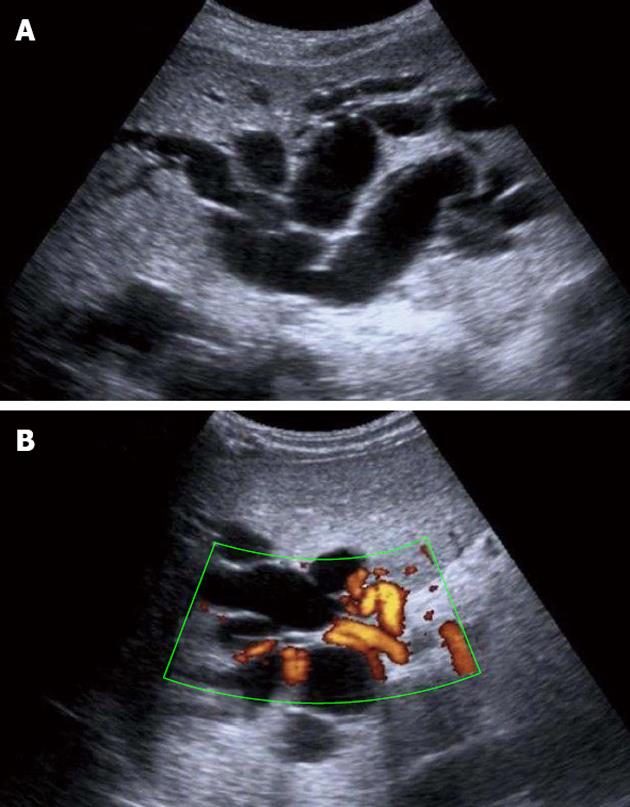
Figure 1 Ultrasound examination.
A: Ultrasound examination showing dilatation of the intrahepatic bile ducts; B: Doppler ultrasound examination demonstrating cavernomatous degeneration of the portal vein with hilar collateral circulation.
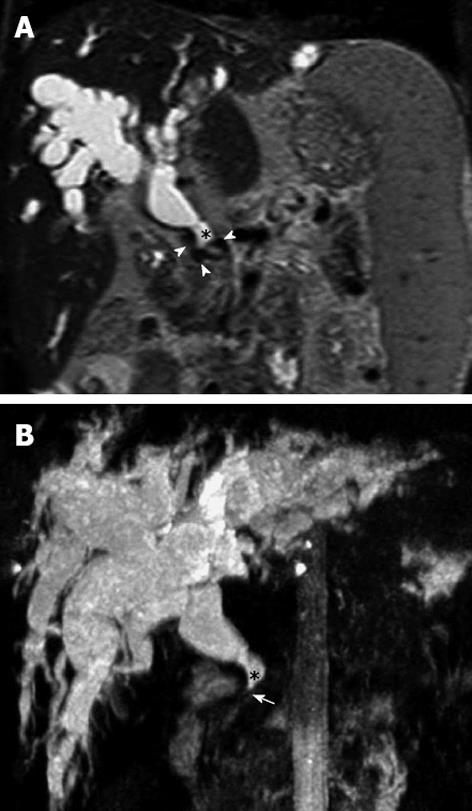
Figure 2 Magnetic resonance cholangiopancreatography.
A: Coronal T2 weight Magnetic resonance indicates marked dilatation of the intra-and extra-hepatic bile duct (*), with presence of vascular structures with void flow that exert extrinsic compression (arrowheads), corresponding to the cavernoma. B: Coronal maximum intensity reconstruction shows the severity of the dilatation of the intra- and extra-hepatic bile duct (*) with notable narrowing of the distal common bile duct (arrow).
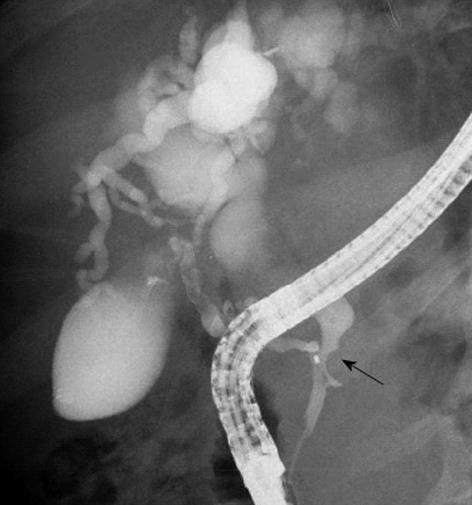
Figure 3 Pancreatic endoscopic retrograde cholangiopancreatography image indicates the site of stenosis of the bile duct (arrow) and a marked dilation of the biliary radicals.
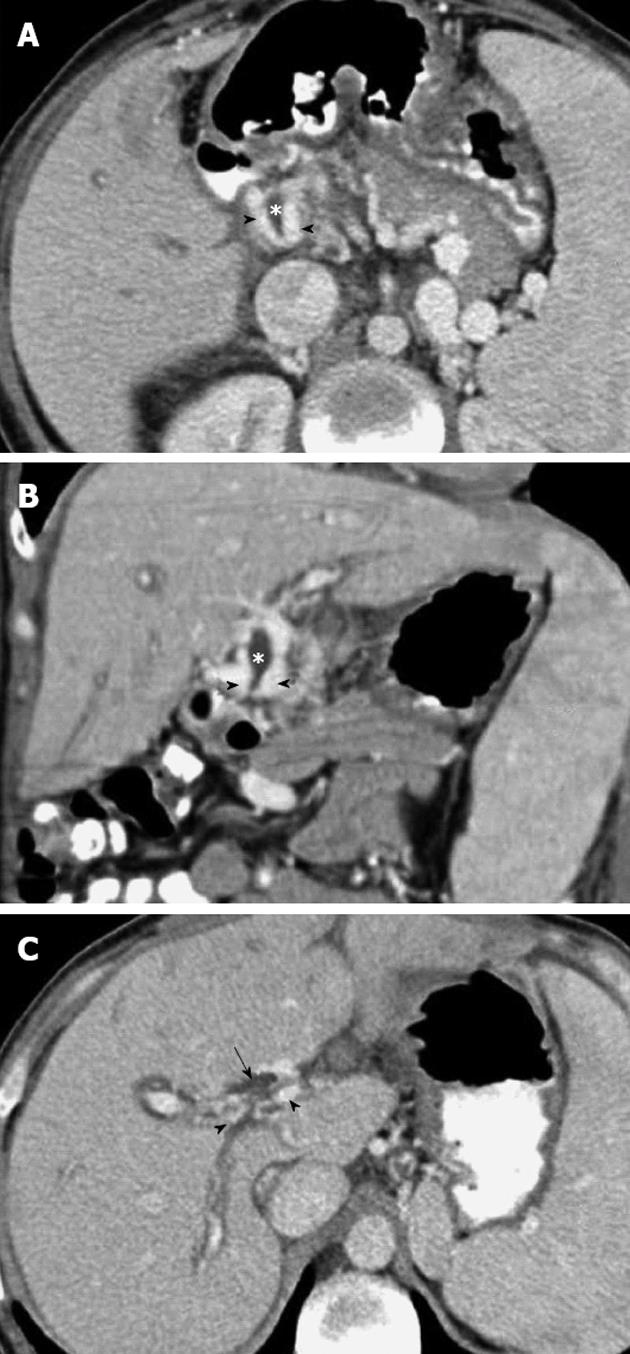
Figure 4 Portal phase abdominal computed tomography.
A, B: Axial (A) and coronal planes (B) show multiple dilated collateral representing the paracholedochal plexus (arrowheads) with reduced diameter of the bile duct (*), secondary to extrinsic compression by the cavernoma; C: The superior axial image shows dilatation of the bile ducts (arrow).
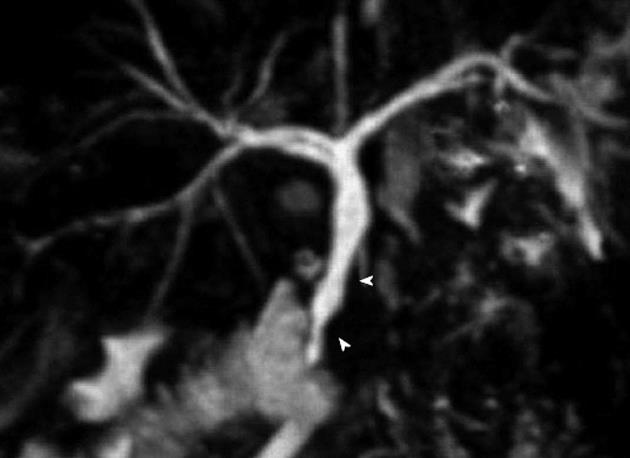
Figure 5 Magnetic resonance cholangiopancreatography.
Coronal maximum intensity reconstruction identifies irregularities and extrinsic compression of the distal common bile duct (arrowheads).
- Citation: Suárez V, Puerta A, Santos LF, Pérez JM, Varón A, Botero RC. Portal hypertensive biliopathy: A single center experience and literature review. World J Hepatol 2013; 5(3): 137-144
- URL: https://www.wjgnet.com/1948-5182/full/v5/i3/137.htm
- DOI: https://dx.doi.org/10.4254/wjh.v5.i3.137


