Copyright
©2011 Baishideng Publishing Group Co.
World J Hepatol. Jul 27, 2011; 3(7): 184-197
Published online Jul 27, 2011. doi: 10.4254/wjh.v3.i7.184
Published online Jul 27, 2011. doi: 10.4254/wjh.v3.i7.184
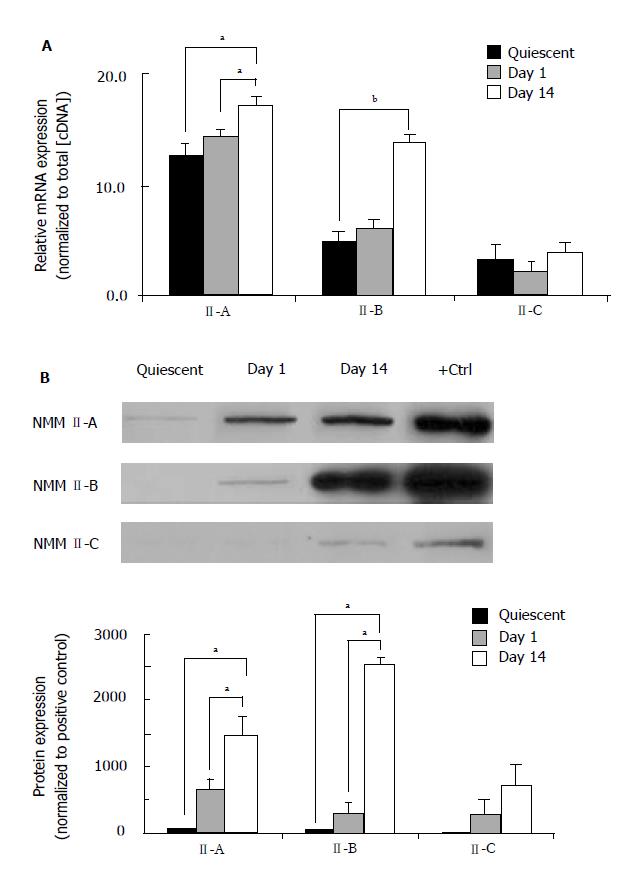
Figure 1 Relative mRNA and protein expression of nonmuscle myosin II-A, II-B and II-C in hepatic stellate cells.
A: mRNA expression of all isoforms was assessed in quiescent and culture-activated hepatic stellate cells (HSCs) (Day 1 and Day 14) by RealTime PCR. mRNA expression of all isoforms was normalized to total cDNA concentration. (aP < 0.05; bP < 0.001 as compared to quiescent). B: Protein expression of all three NMM II isoforms was determined in quiescent and culture-activated HSCs (Day 1 and Day 14) by an actin-selection assay and subsequent Western blot analysis. Sample lysates were equalized for protein concentration using the bradford method and incubated with F-actin (10 mmol/L). (+ Ctrl; Rat-1 fibroblast cell line). Top panel: representative Western blots. Bottom panel: Western blot quantification using band intensity. (aP < 0.05 as compared to quiescent).
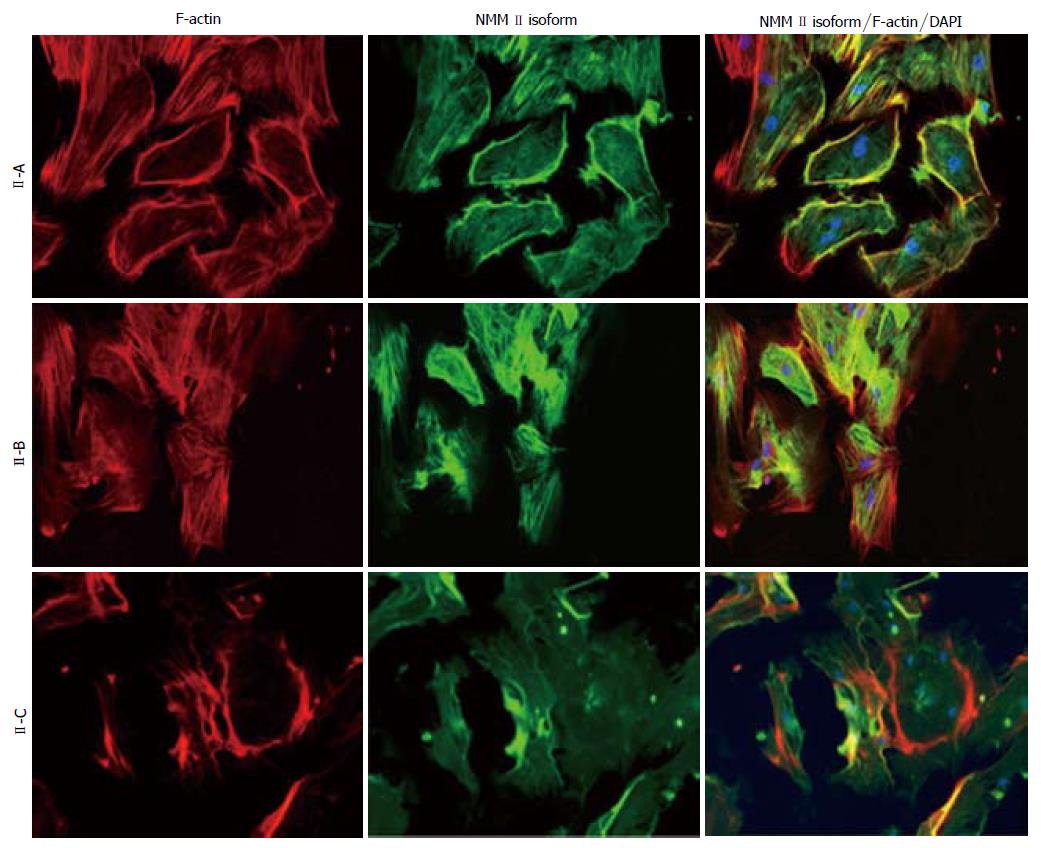
Figure 2 Immunocytochemical analysis of nonmuscle myosin II-A, II-B and II-C in hepatic stellate cells.
Expression of all three isoforms was detected in culture-activated cells (Day 14). Specific II immunoreactivity of representative fields is shown in green; F-actin stress fibers (phalloidin) are shown in red and cell nuclei are stained blue (DAPI). Images of II isoforms, F-actin, and DAPI were taken separately at identical exposures and color channels were merged using IMAGE-PRO software (350 ×).
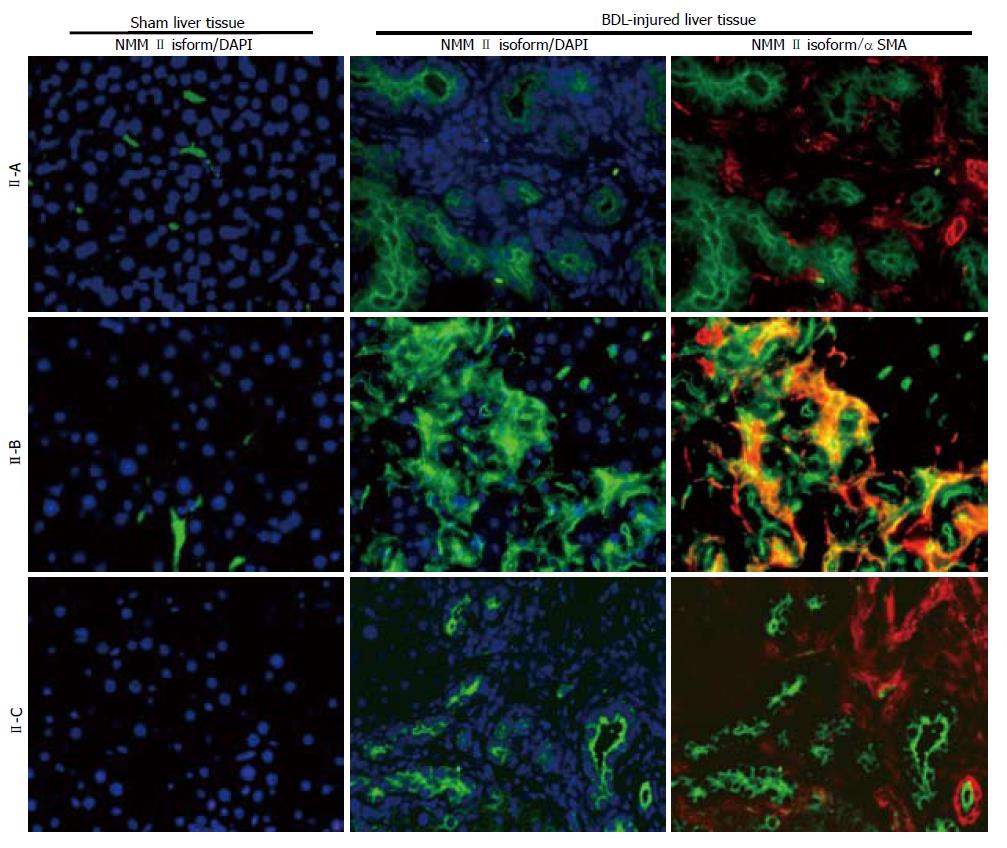
Figure 3 Immunohistochemical analysis of nonmuscle myosin II-A, II-B and II-C in normal and injured liver sections.
Specific nonmuscle myosin (NMM) II immunoreactivity of representative fields is shown in green; αactin smooth muscle, as a marker of hepatic stellate cell activation is shown in red and cell nuclei are stained blue (DAPI). Images of NMM II isoforms, F-actin, and DAPI were taken separately at identical exposures and color channels were merged using IMAGE-PRO software (200 ×).
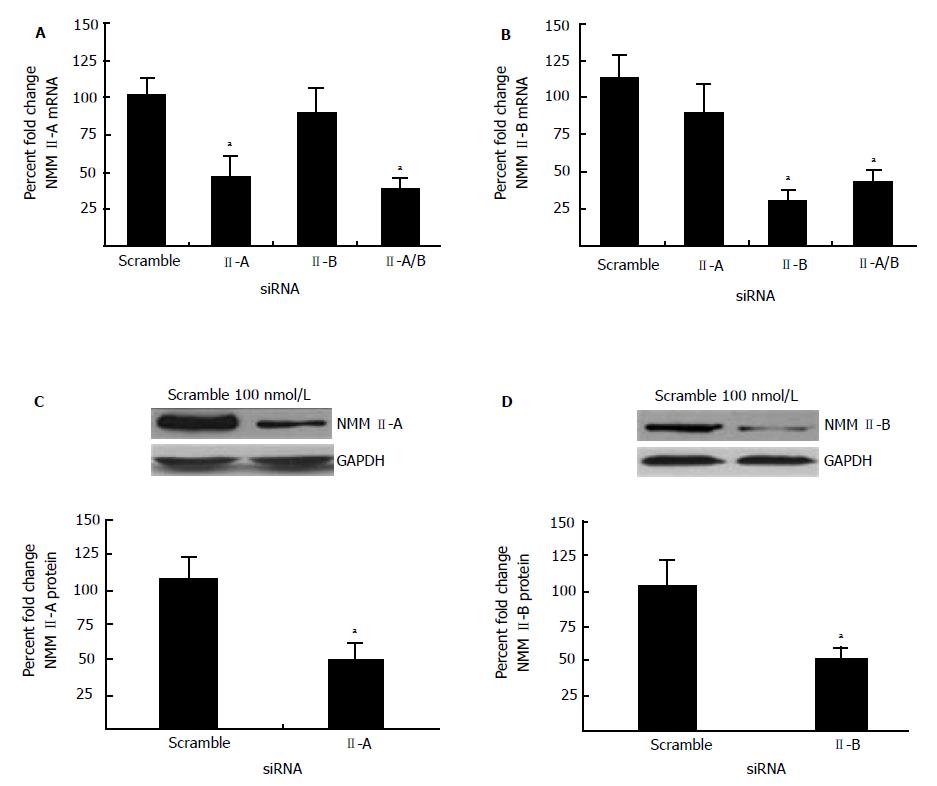
Figure 4 Nonmuscle myosin II isoform inhibition.
A and B: Culture-activated hepatic stellate cells (Day 3) were incubated with nonmuscle myosin II-A or II-B, II-A & II-B, or scramble siRNA (100 nmol/L) for 48 h. RealTime PCR determined isoform-specific inhibition of each isoform as normalized to total cDNA concentration and compared to scramble control. C and D: In parallel experiments cell lysates were isolated and protein inhibition determined by western blot analysis. Protein expression was normalized to GAPDH and compared to scramble control (aP < 0.05 as compared to scramble).
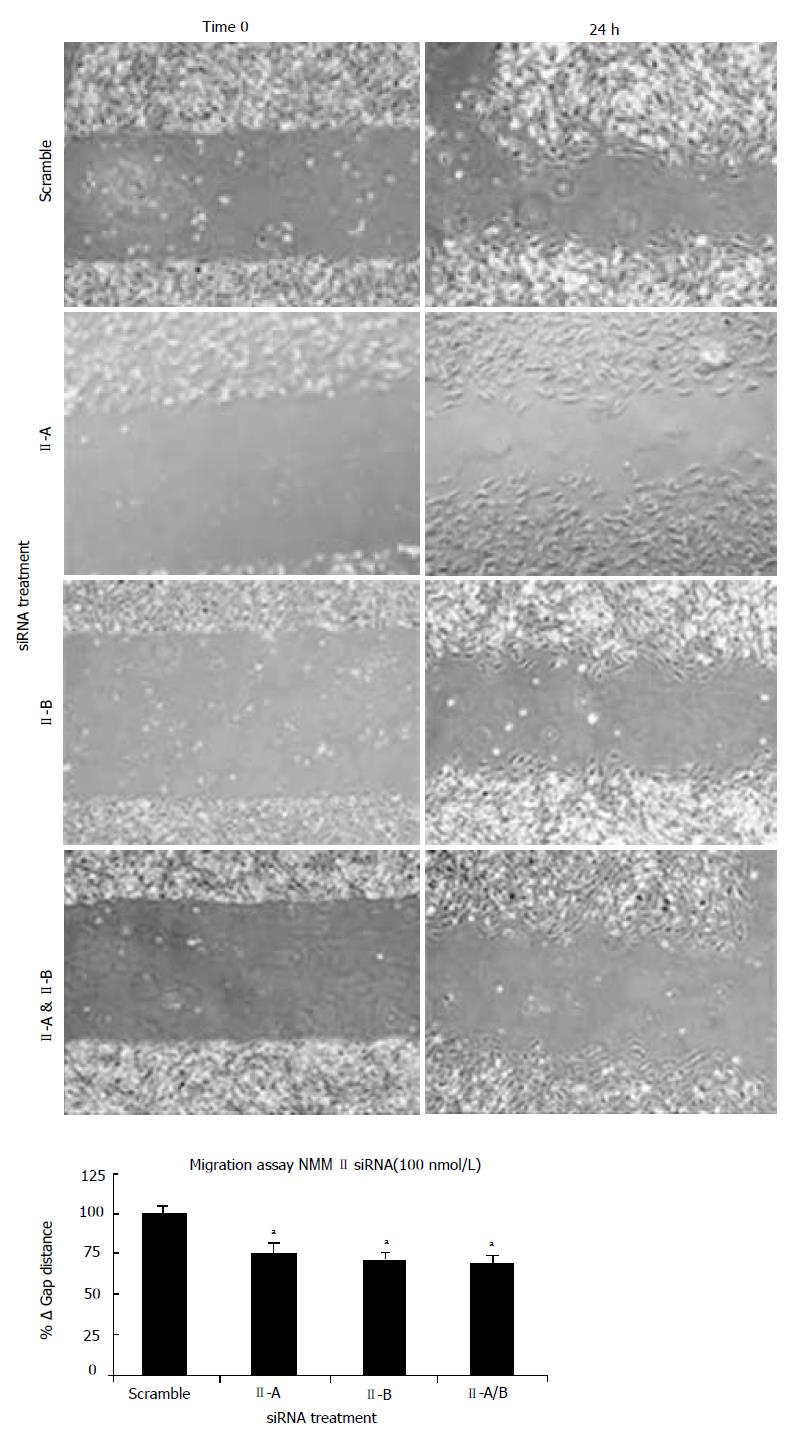
Figure 5 Effect of nonmuscle myosin II inhibition on hepatic stellate cell migration.
Culture-activated hepatic stellate cells (Day 3) were transiently transfected with siRNA targeted to all nonmuscle myosin (NMM) II permutations (NMM II-A, II-B,II-A & II-B) or scramble siRNA and incubated for 48 h. A plate scrape model of migration was used to simulate liver injury. After 24 h, migration was calculated as change in wound (gap) diameter over time. Top panel: representative micrographs. Bottom panel: Migration assay quantification. (aP < 0.05 as compared to scramble).
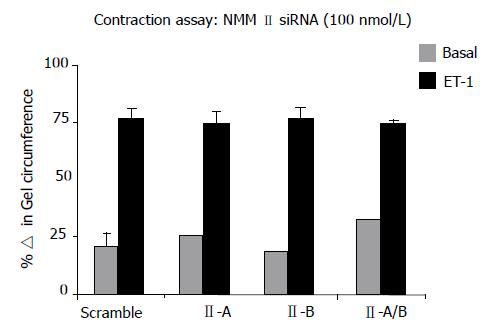
Figure 6 Effect of nonmuscle myosin II inhibition on hepatic stellate cell contraction.
Culture-activated hepatic stellate cells (Day 3) were transiently transfected with siRNA targeted to nonmuscle myosin(NMM) II-A, II-B, II-A and II-B or scramble siRNA (100 nmol/L and allowed to incubate for 24 h. Cells (1 × 10⁵) were seeded onto collagen lattices overnight, serum-starved for 24 h and subsequently treated with ET-1 (1 nmol/L). Twenty-four hours following chemical treatment, hepatic stellate cell contraction was quantified using PTI ImageMaster software and reported as percentage change in gel circumference.
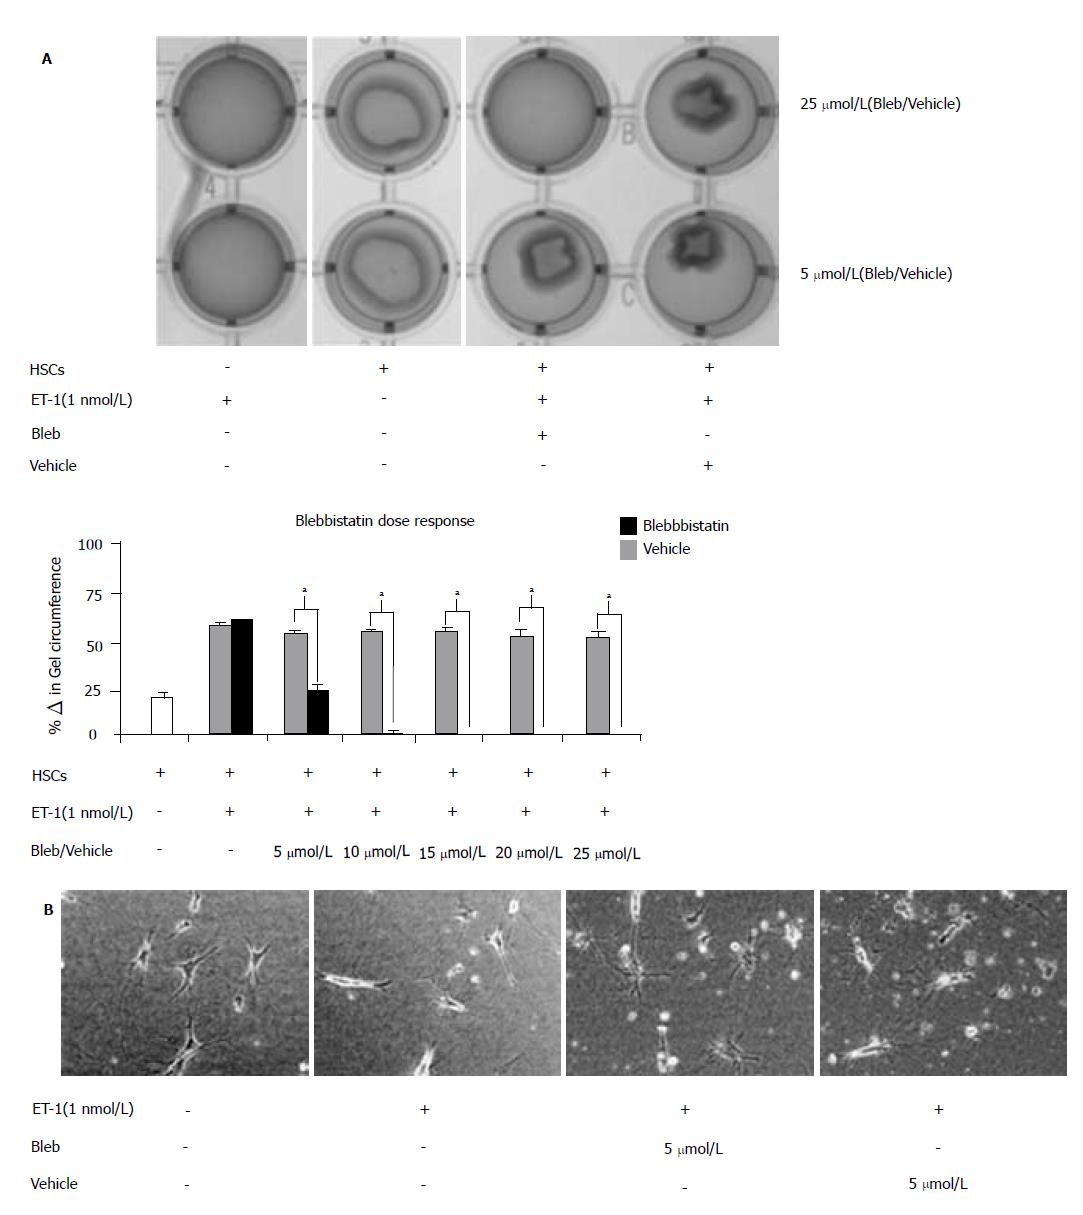
Figure 7 Blebbistatin-inhibited endothelin-1-induced hepatic stellate cell contraction.
Culture-activated hepatic stellate cells(HSCs) (Day 4) were serum-starved 24 h prior to seeding onto collagen lattices (3 × 10⁵ cells/well). Cells were pretreated with inactive (Vehicle) or active (Blebbistatin) myosin II inhibitor in increasing doses (0-25 μmol/L; 5) and subsequently treated with blebbistatin-inhibited endothelin-1 (ET-1) (1 nmol/L) after 30 min. (aP < 0.05 as compared to scramble). A: Representative light micrographs of collagen lattices: with or without seeded HSCs; with or without chemical treatments (top panel). Twenty-four hours following chemical treatment, hepatic stellate cell contraction was quantified using PTI ImageMaster software and reported as percentage change in gel circumference (bottom panel). B: Representative light micrographs of collagen-seeded HSCs with or without chemical treatments.
- Citation: Moore CC, Lakner AM, Yengo CM, Schrum LW. Nonmuscle myosin II regulates migration but not contraction in rat hepatic stellate cells. World J Hepatol 2011; 3(7): 184-197
- URL: https://www.wjgnet.com/1948-5182/full/v3/i7/184.htm
- DOI: https://dx.doi.org/10.4254/wjh.v3.i7.184


