Copyright
©2010 Baishideng.
Figure 1 US, CEUS and CT visualizations of the same liver metastasis (indicated by an arrow).
The lesion is not recognizable using US, but is visible by CEUS and CT. A: US; B: CEUS; C: CT.
Figure 2 Hypovascular liver metastases visualized with US and CEUS.
The same hypovascular liver metastasis is visualized by US and CEUS in both the arterial and portal phases. In the arterial phase a slight rim enhancement is seen (arrows). The non-enhancing area in the center represents a necrosis, and is demonstrated in both the arterial and late phases. A: B-mode US; B: Arterial phase; C: Late phase.
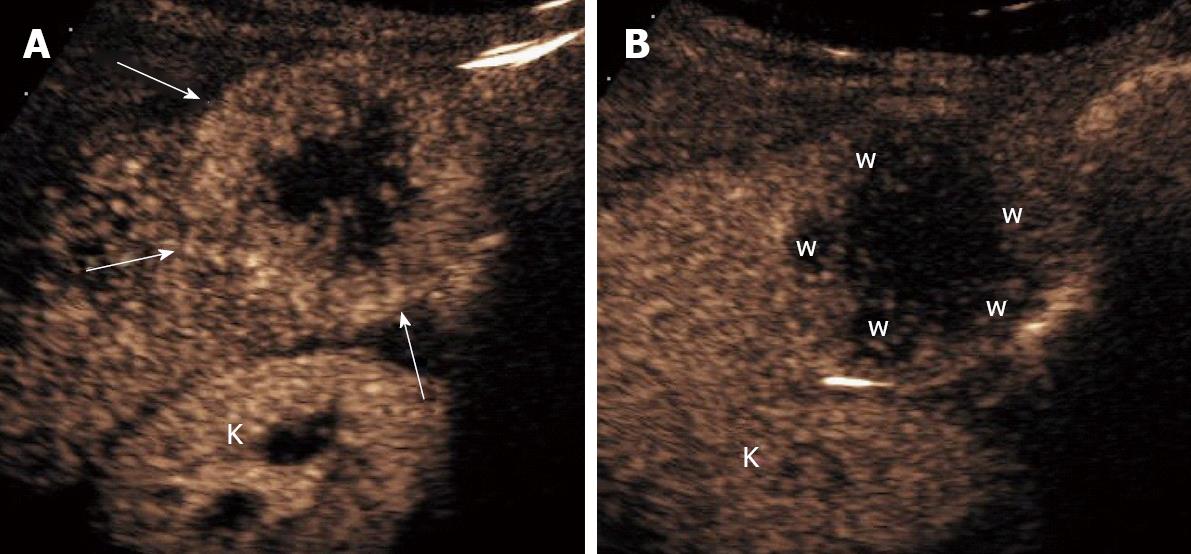
Figure 3 Hypervascular liver metastases visualized by CEUS.
The patient is a woman, 77 years old, with renal cancer and hypervascular liver metastases in segment 6 as visualized with CEUS. In the arterial phase, the metastases present a hyper-reflective signal when compared to the surrounding normal liver parenchyma (arrows). The non- enhanced area in the center represents necrosis. In the late phase there is clearly a washout of contrast in the metastases (w). The kidneys are visualized below the liver (k). A: Arterial phase; B: Late phase.
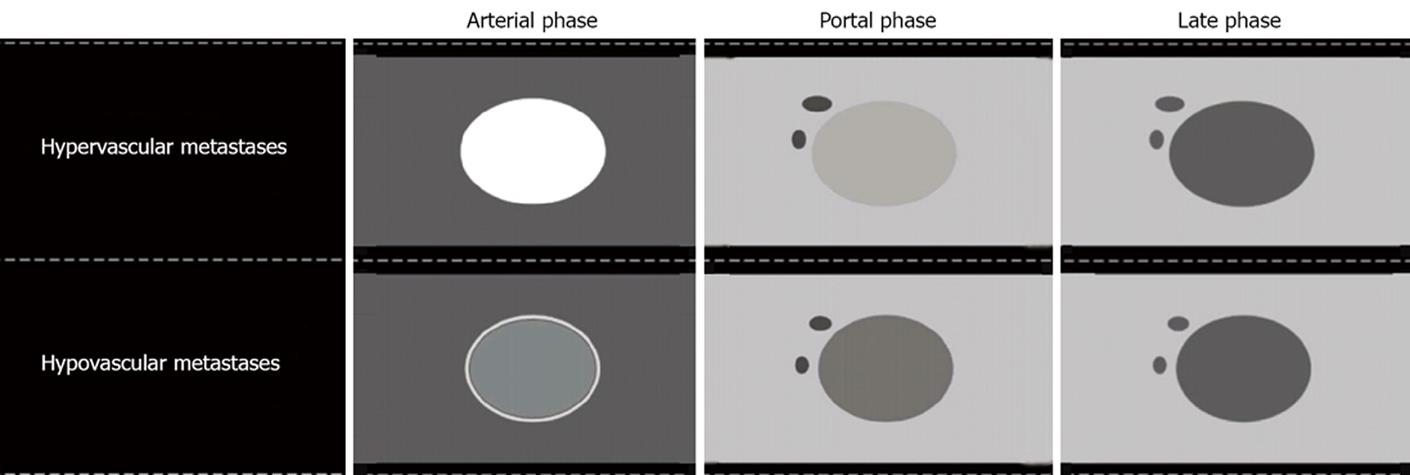
Figure 4 Typical contrast enhancement pattern of a hepatic metastasis by CEUS.
- Citation: Larsen LPS. Role of contrast enhanced ultrasonography in the assessment of hepatic metastases: A review. World J Hepatol 2010; 2(1): 8-15
- URL: https://www.wjgnet.com/1948-5182/full/v2/i1/8.htm
- DOI: https://dx.doi.org/10.4254/wjh.v2.i1.8


