Copyright
©The Author(s) 2025.
World J Hepatol. Aug 27, 2025; 17(8): 109796
Published online Aug 27, 2025. doi: 10.4254/wjh.v17.i8.109796
Published online Aug 27, 2025. doi: 10.4254/wjh.v17.i8.109796
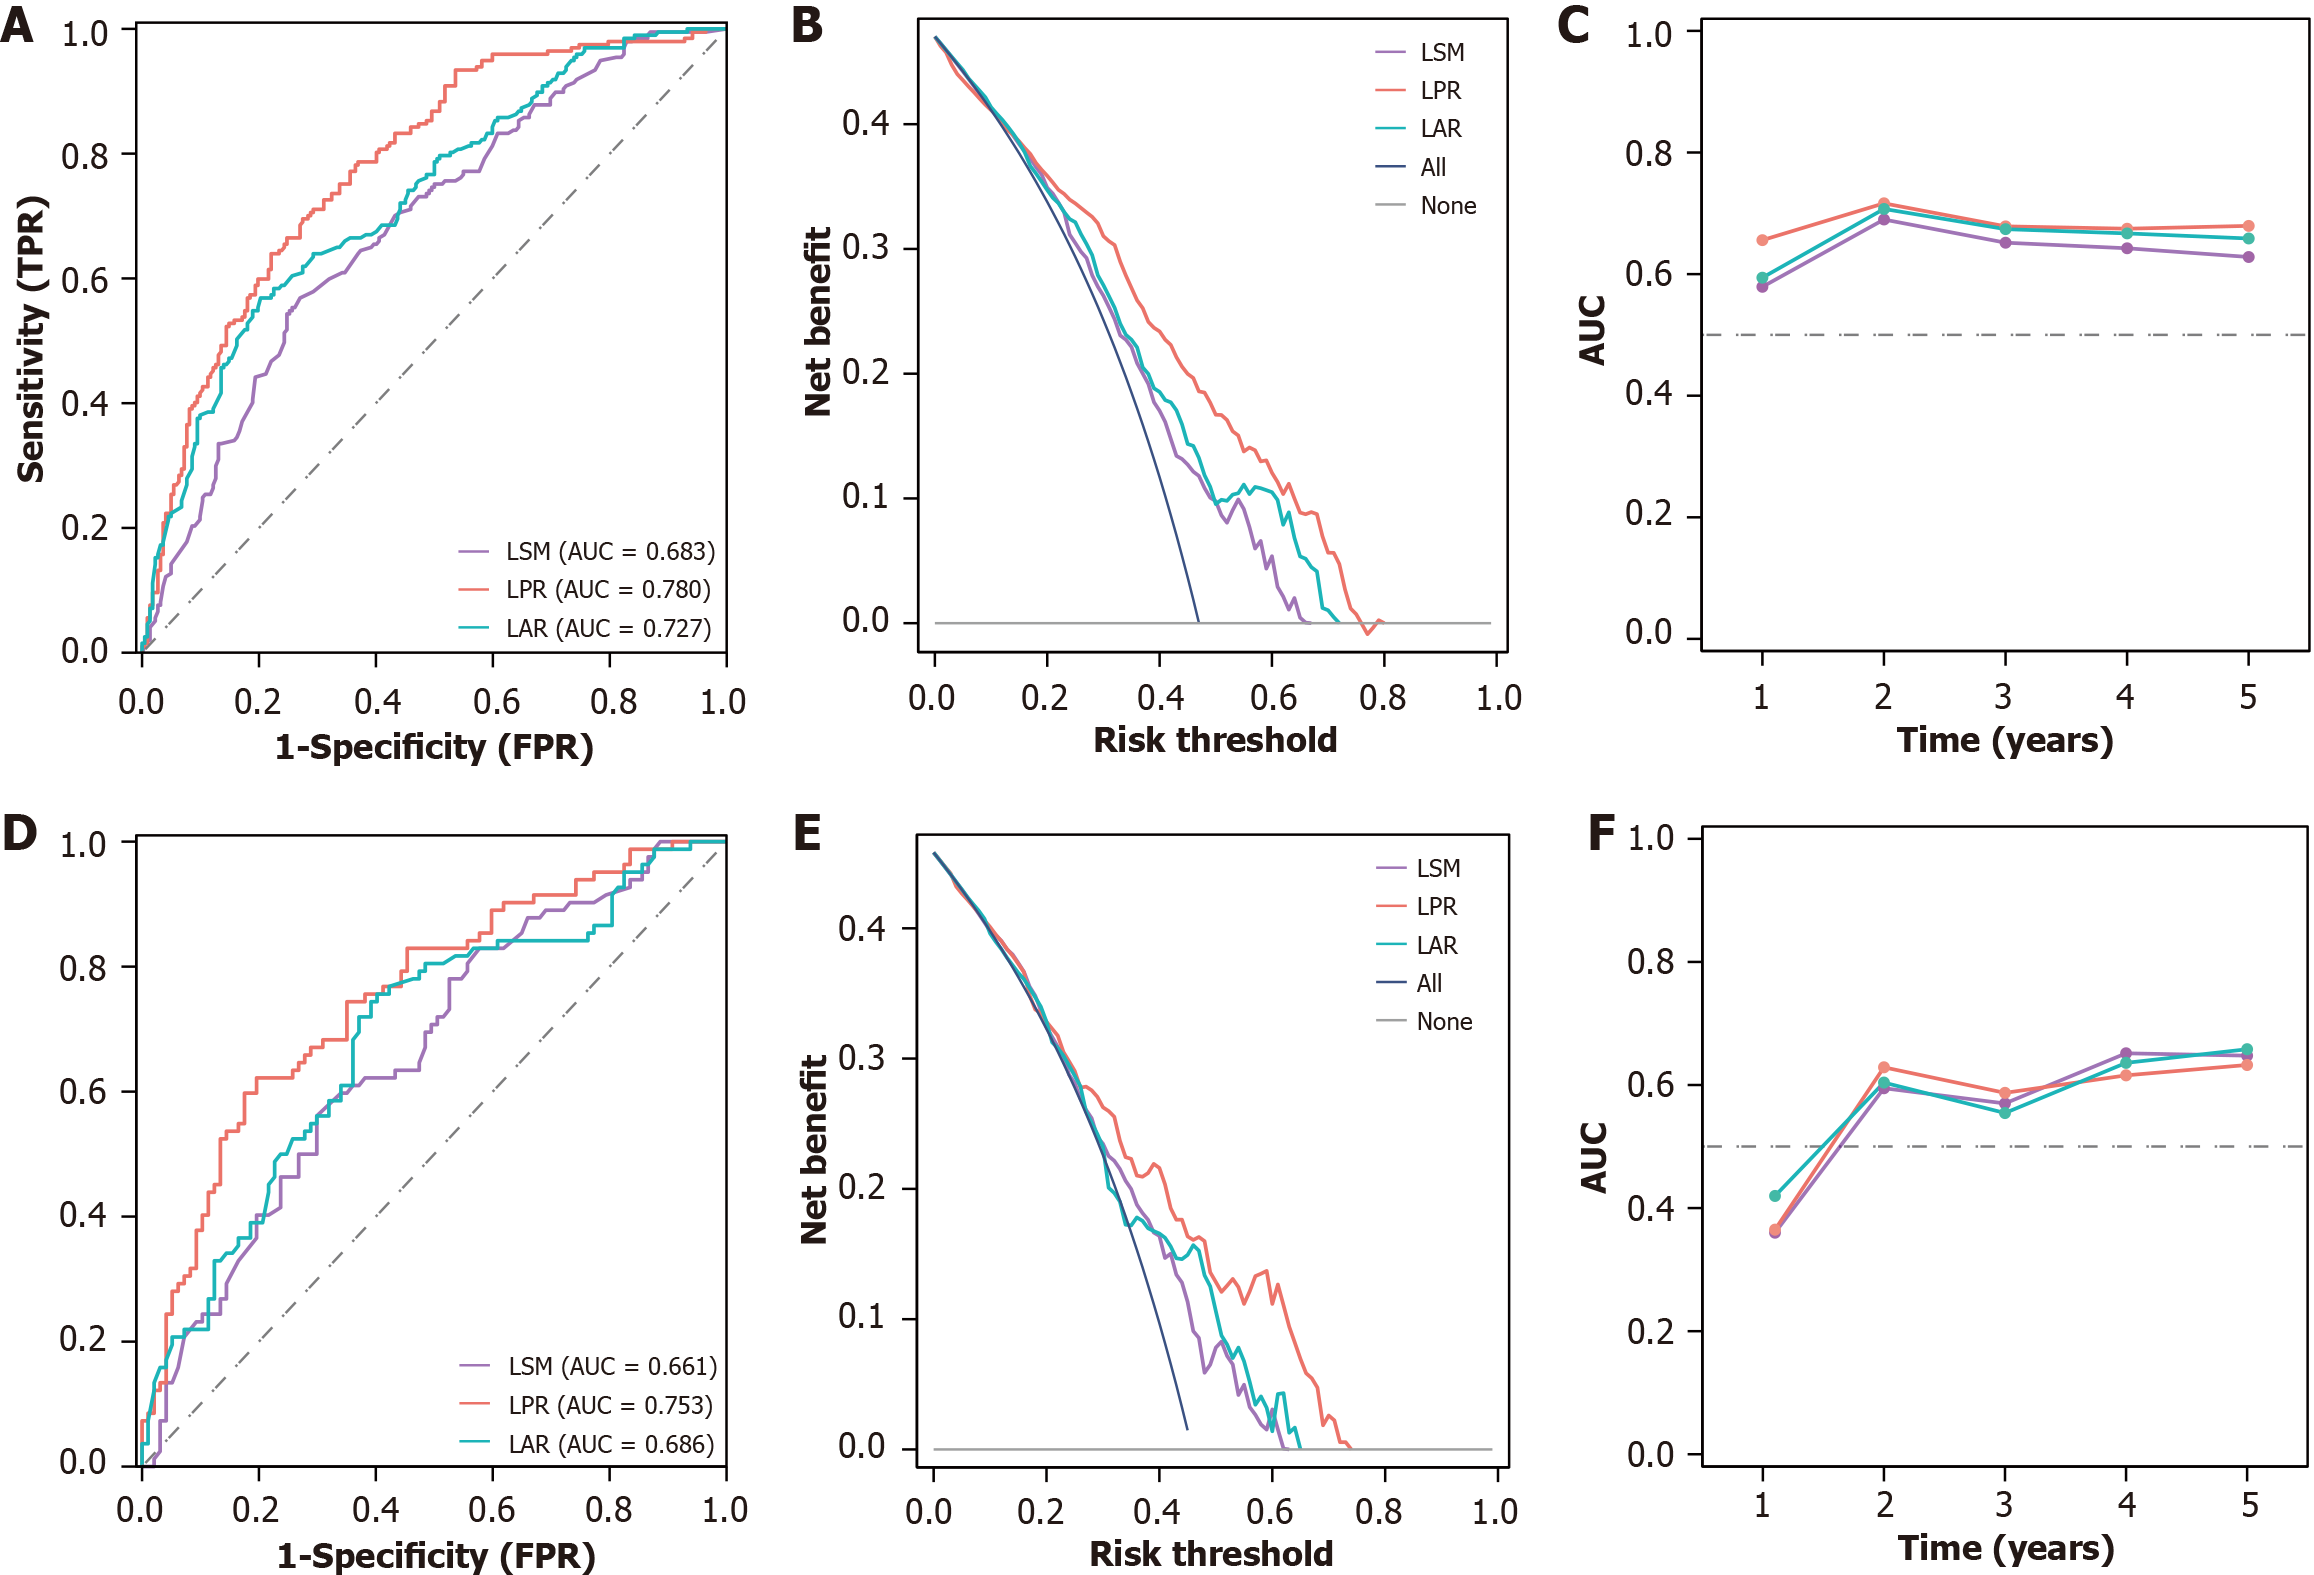
Figure 1 Performance evaluation of liver stiffness measurement and its composite indices in predicting liver-related events.
A: Receiver operating characteristic (ROC) of liver stiffness measurement (LSM), LSM-platelet ratio (LPR), and LSM-albumin ratio (LAR) models in the training cohort; B: Decision curve analysis of LSM, LPR, and LAR models in the training cohort; C: Time-dependent area under the curve (AUC) analysis of LSM, LPR, and LAR models in the training cohort; D: ROC curve of LSM, LPR, and LAR models in the validation cohort; E: Decision curve analysis of LSM, LPR, and LAR models in the validation cohort; F: Time-dependent AUC analysis of LSM, LPR, and LAR models in the validation cohort.
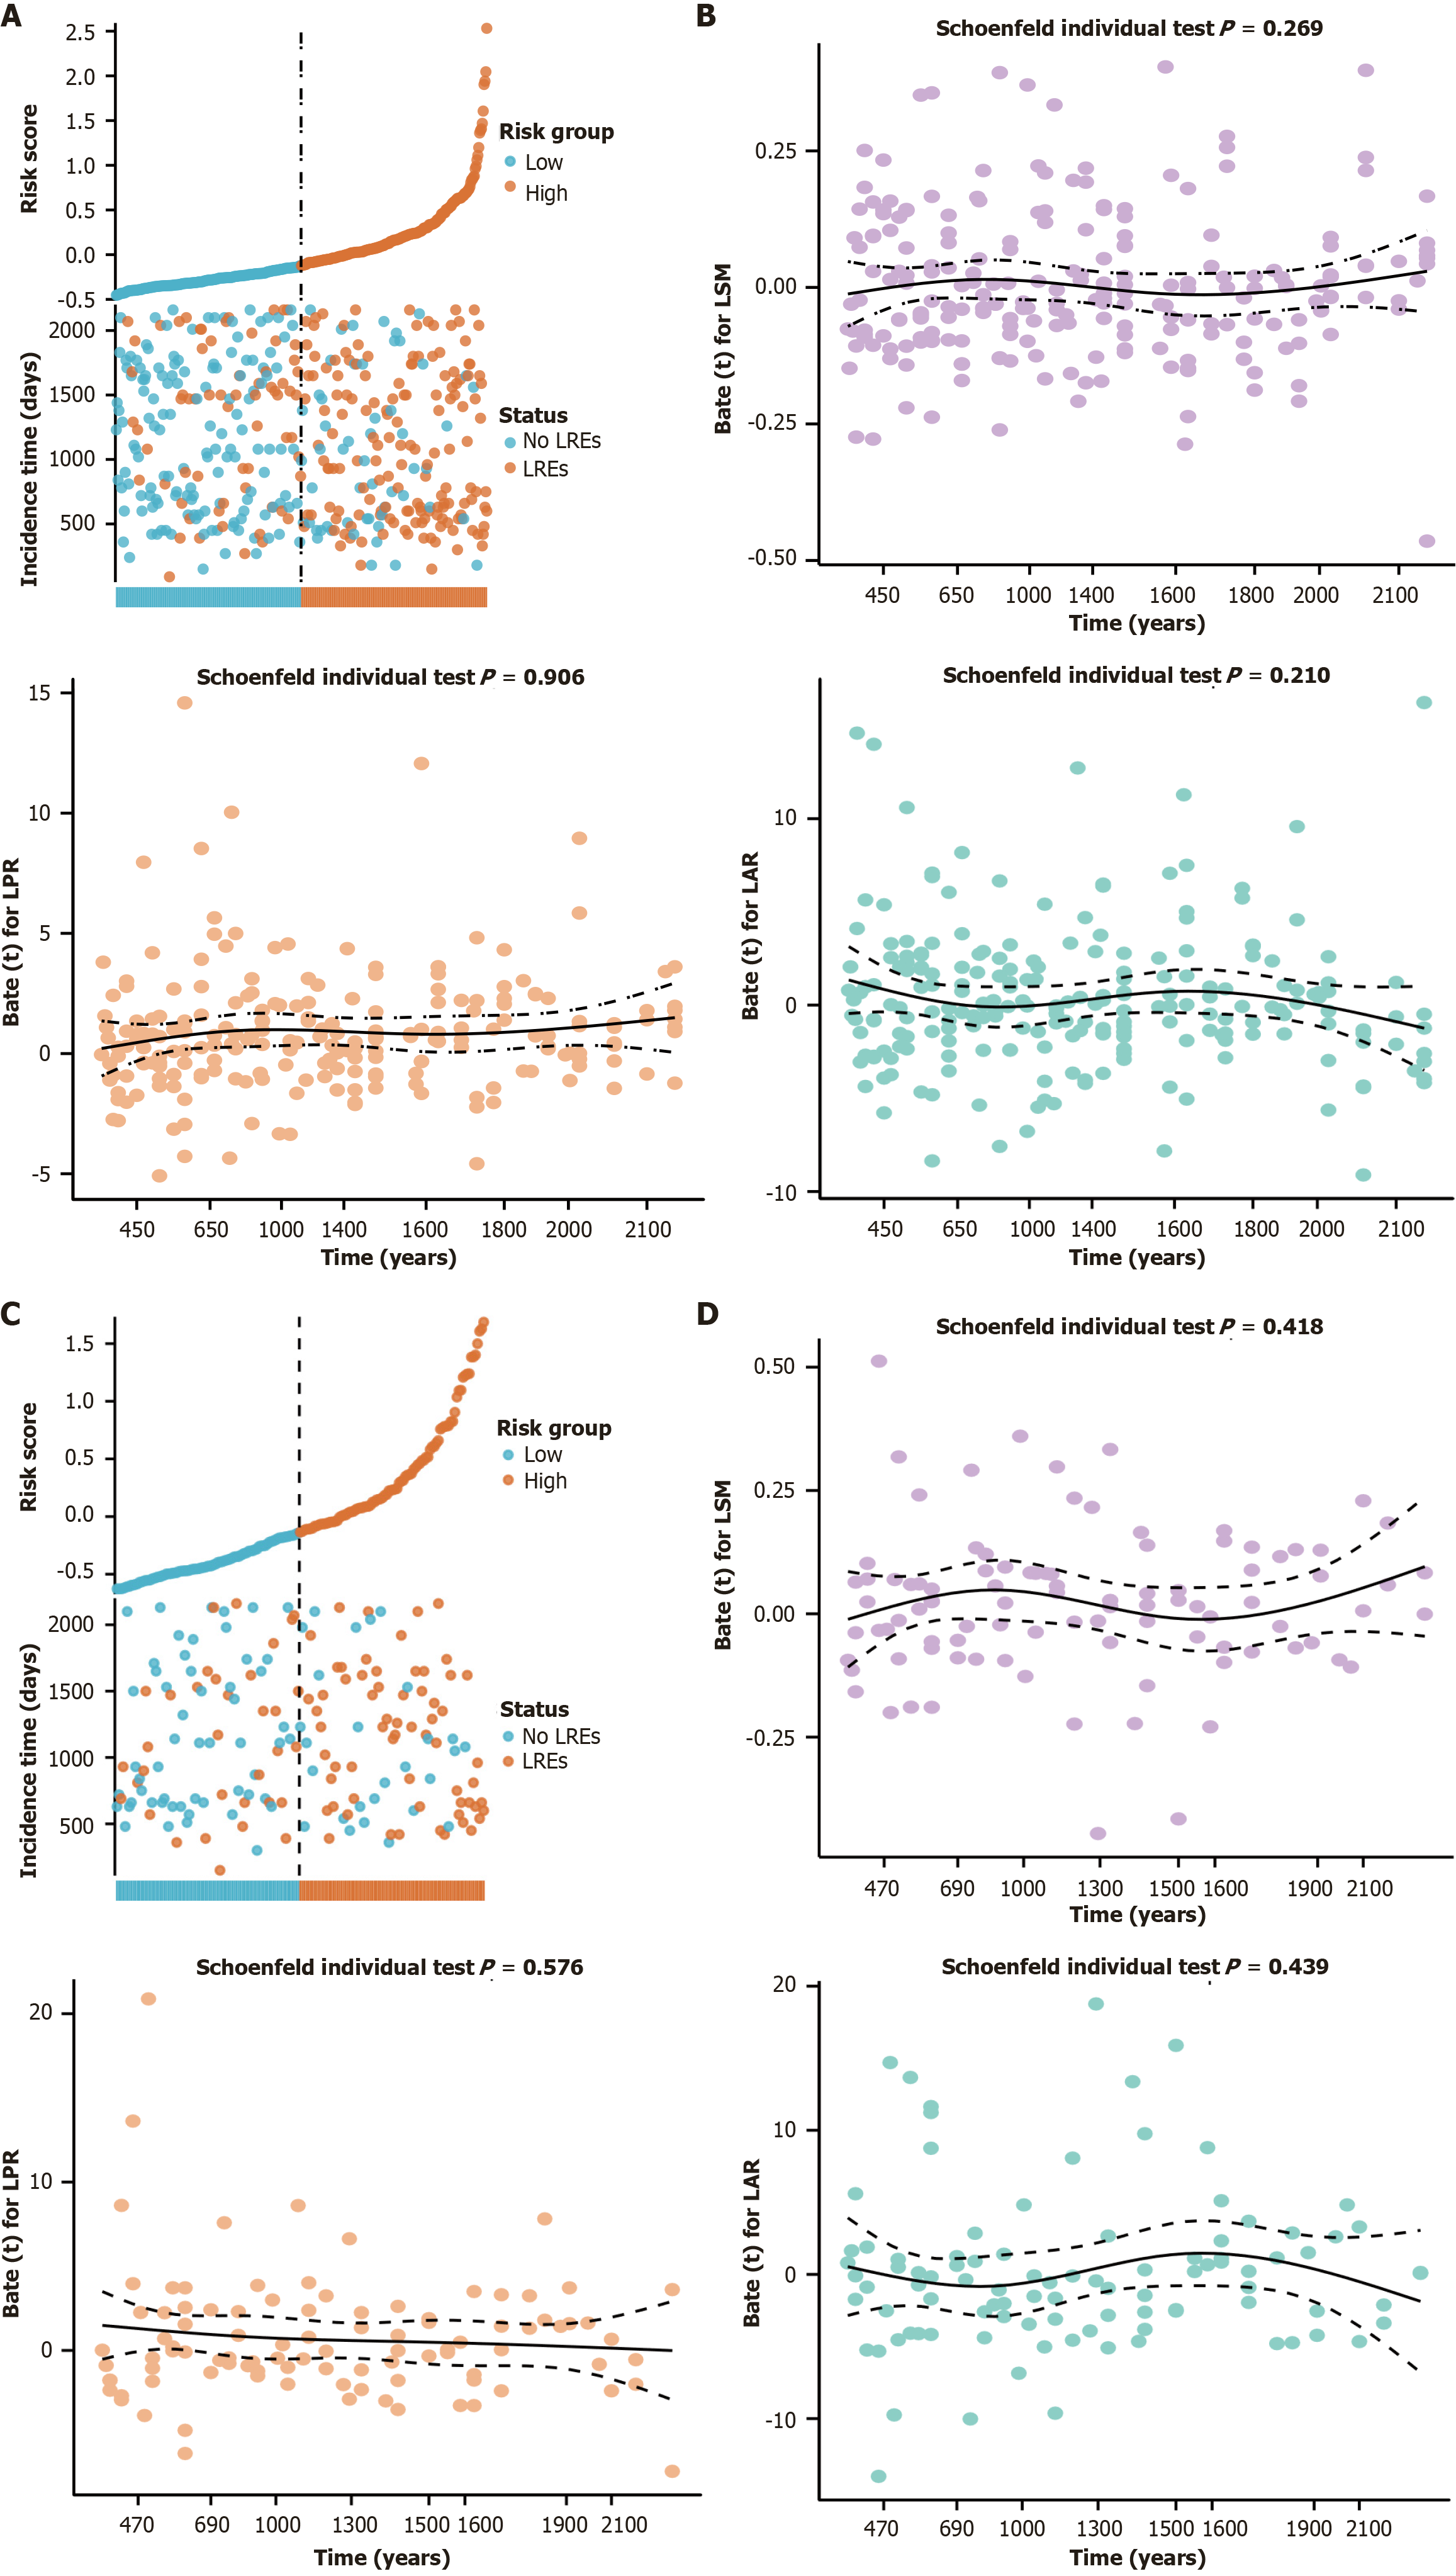
Figure 2 Proportional hazard hypothesis test and risk stratification analysis.
A: The risk stratification diagram in the training cohort; B: The Schoenfeld residual diagram of liver stiffness measurement (LSM), LSM-albumin ratio (LAR), and LSM-platelet ratio (LPR) in the training cohort; C: The risk stratification diagram in the validation cohort; D: The Schoenfeld residual diagram of LSM, LAR, and LPR in the validation cohort. The horizontal axis represents the follow-up time (days), the vertical axis represents the cox regression coefficient of the models, and the solid line and the dotted line represent the fitted spline smooth curve and the standard deviation (confidence interval) of 2 units above and below the fitted curve, respectively.
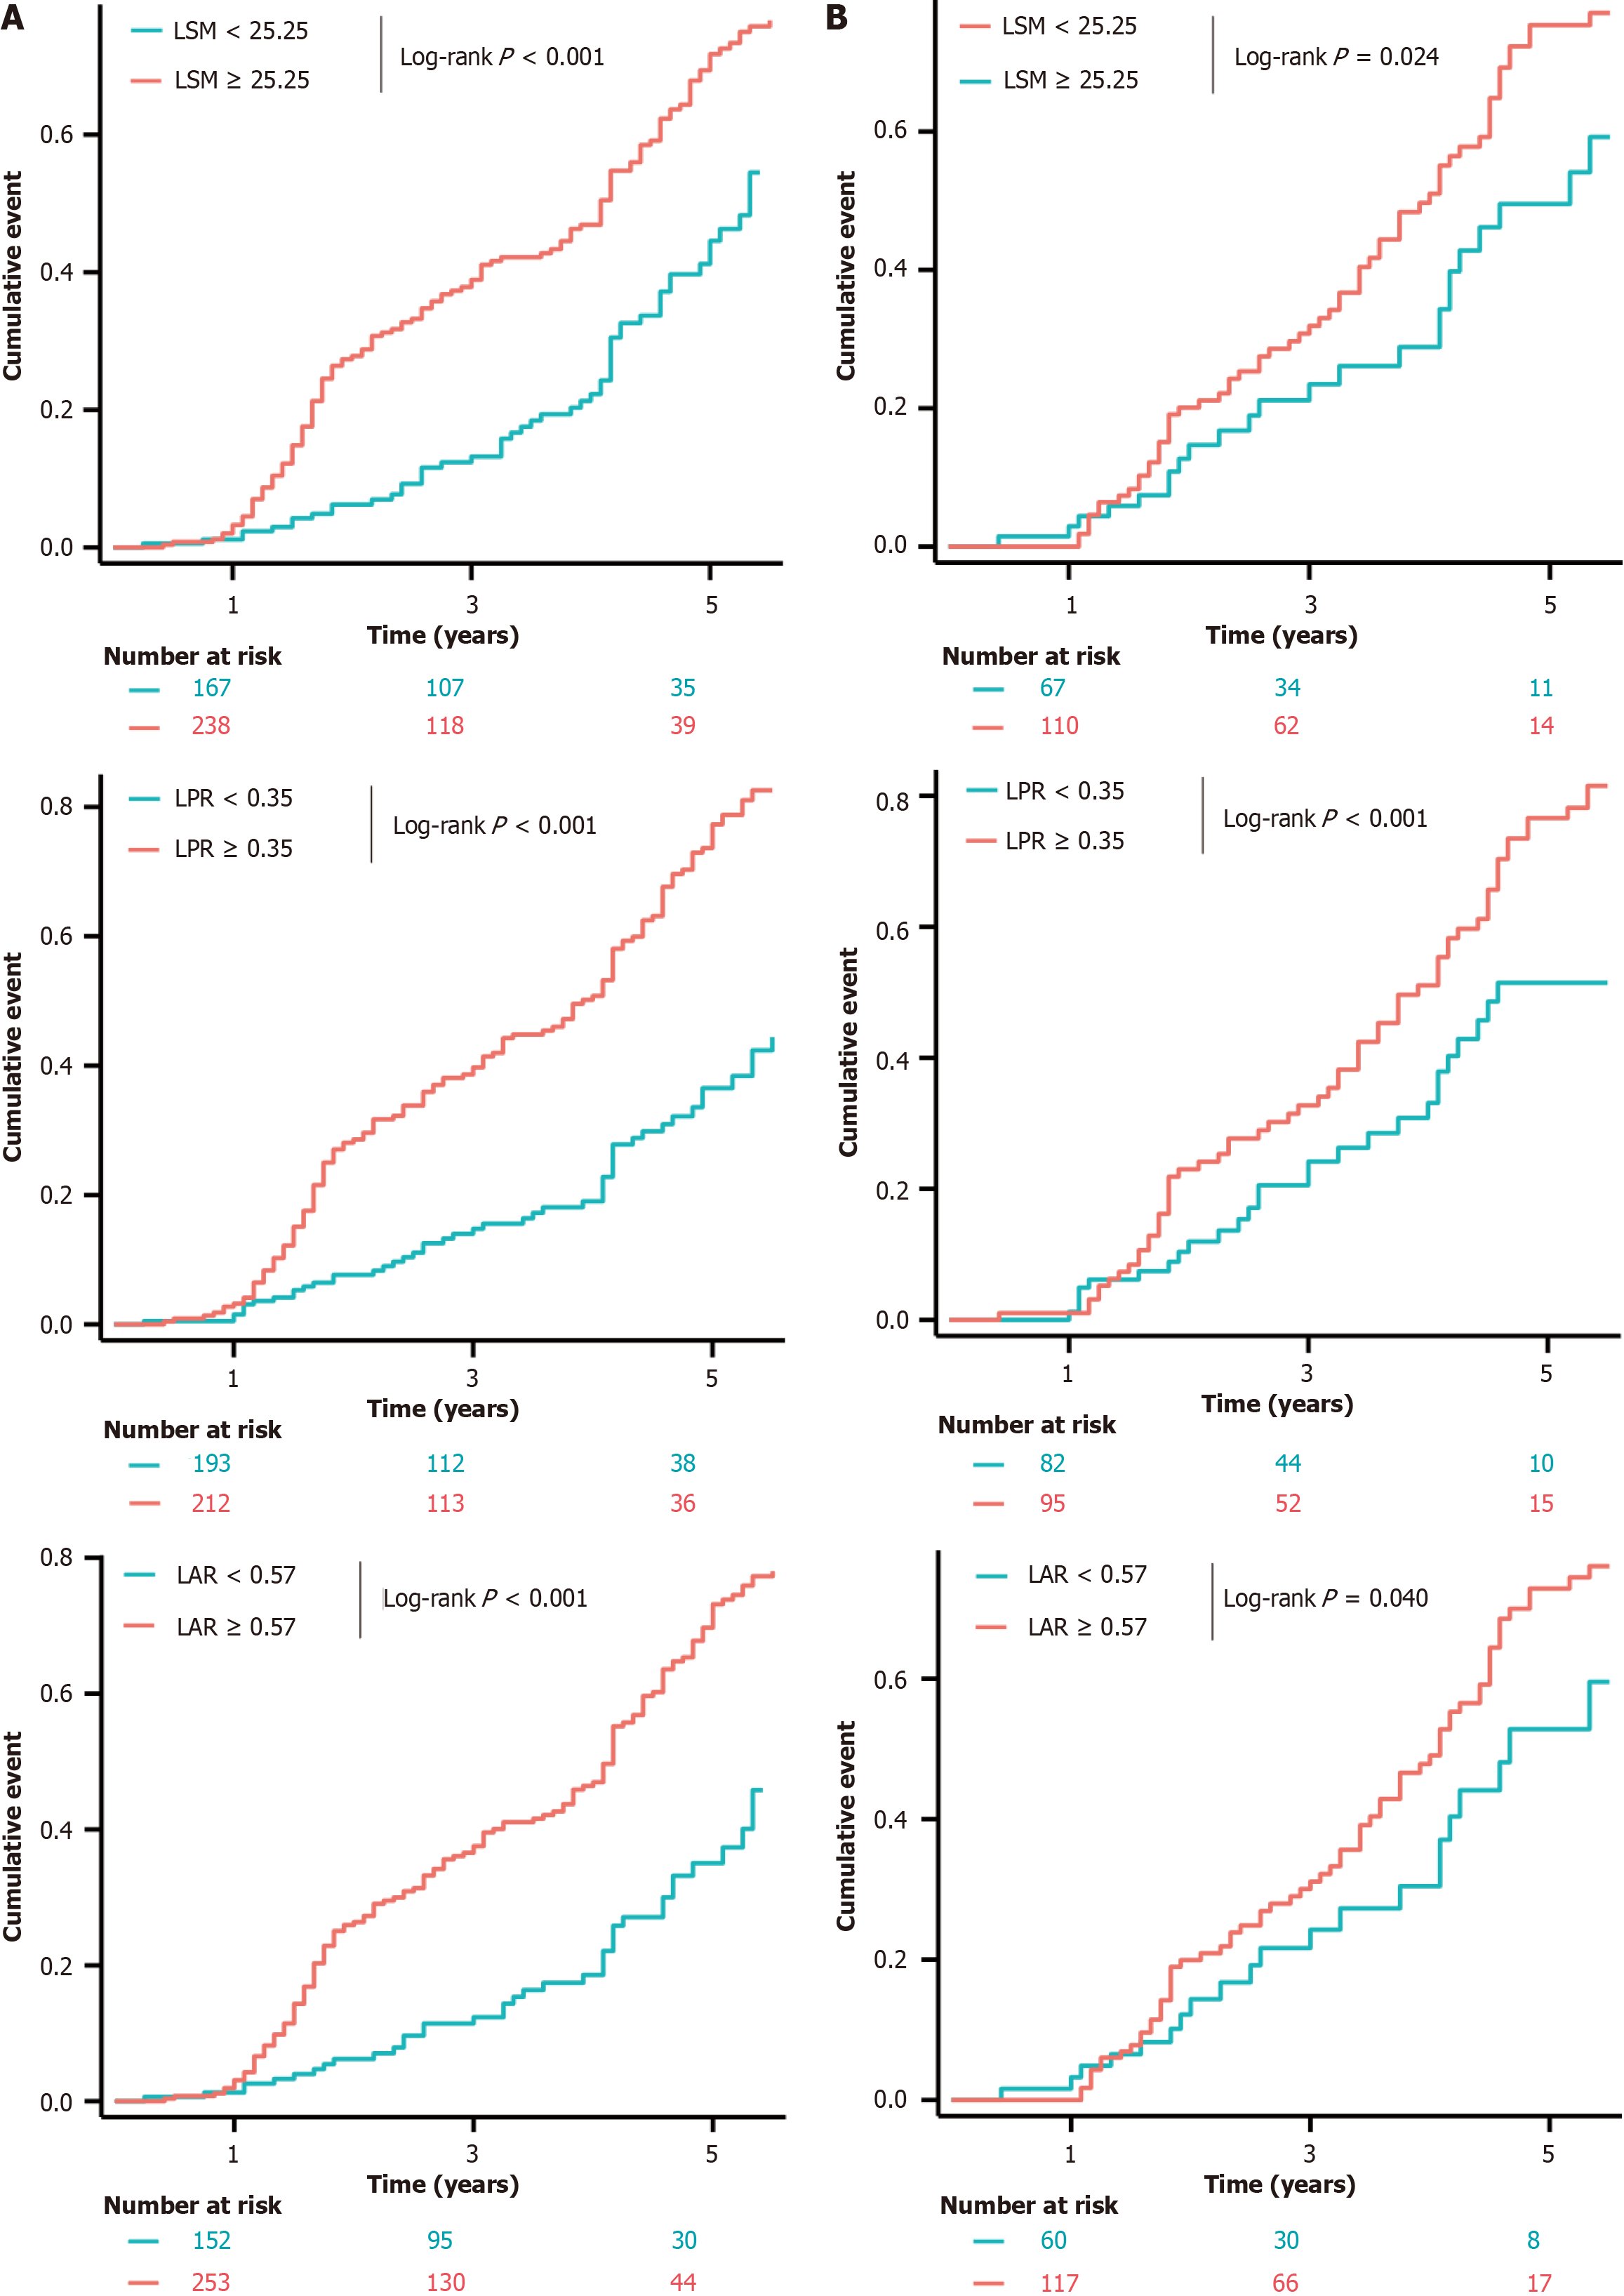
Figure 3 Cumulative incidence of liver-related events in compensated viral cirrhosis patients with clinically significant portal hypertension.
A: Cumulative incidence of decompensation events in patients stratified by liver stiffness measurement (LSM) risk groups (≥ 25.25 kPa vs < 25.25 kPa), LSM-platelet ratio (LPR) risk groups (≥ 0.35 vs < 0.35), and LSM-albumin ratio (LAR) risk groups (≥ 0.57 vs < 0.57) in the training cohort; B: Cumulative incidence of decompensation events in patients stratified by LSM risk groups (≥ 25.25 kPa vs < 25.25 kPa) , LPR risk groups (≥ 0.35 vs < 0.35), and LAR risk groups (≥ 0.57 vs < 0.57) in the validation cohort.
Figure 4 Subgroup analysis of liver-related events stratified by liver stiffness measurement and its composite indices A: Distribution of liver-related events (LREs) in liver stiffness measurement (LSM) risk groups (≥ 25.
25 kPa vs < 25.25 kPa) in the training and validation cohort; B: Cumulative incidence curve of LREs in LSM risk groups (≥ 25.25 kPa vs < 25.25 kPa) in the training and validation cohort; C: Distribution of LREs in LSM-platelet ratio (LPR) risk groups (≥ 0.35 vs < 0.35) in the training and validation cohort; D: Cumulative incidence curve of LREs in LPR risk groups (≥ 0.35 vs < 0.35) in the training and validation cohort; E: Distribution of LREs in LSM-albumin ratio (LAR) risk groups (≥ 0.57 vs < 0.57) in the training and validation cohort; F: Cumulative incidence curve of LREs in LAR risk groups (≥ 0.57 vs < 0.57) in the training and validation cohort.
- Citation: Li YQ, Li YQ, Li JZ, Zhu BB, Lu Y, Feng Y, Wang XB. Assessment of liver stiffness measurement-related markers in predicting liver-related events in viral cirrhosis with clinically significant portal hypertension. World J Hepatol 2025; 17(8): 109796
- URL: https://www.wjgnet.com/1948-5182/full/v17/i8/109796.htm
- DOI: https://dx.doi.org/10.4254/wjh.v17.i8.109796


