Copyright
©The Author(s) 2025.
World J Hepatol. Aug 27, 2025; 17(8): 108533
Published online Aug 27, 2025. doi: 10.4254/wjh.v17.i8.108533
Published online Aug 27, 2025. doi: 10.4254/wjh.v17.i8.108533
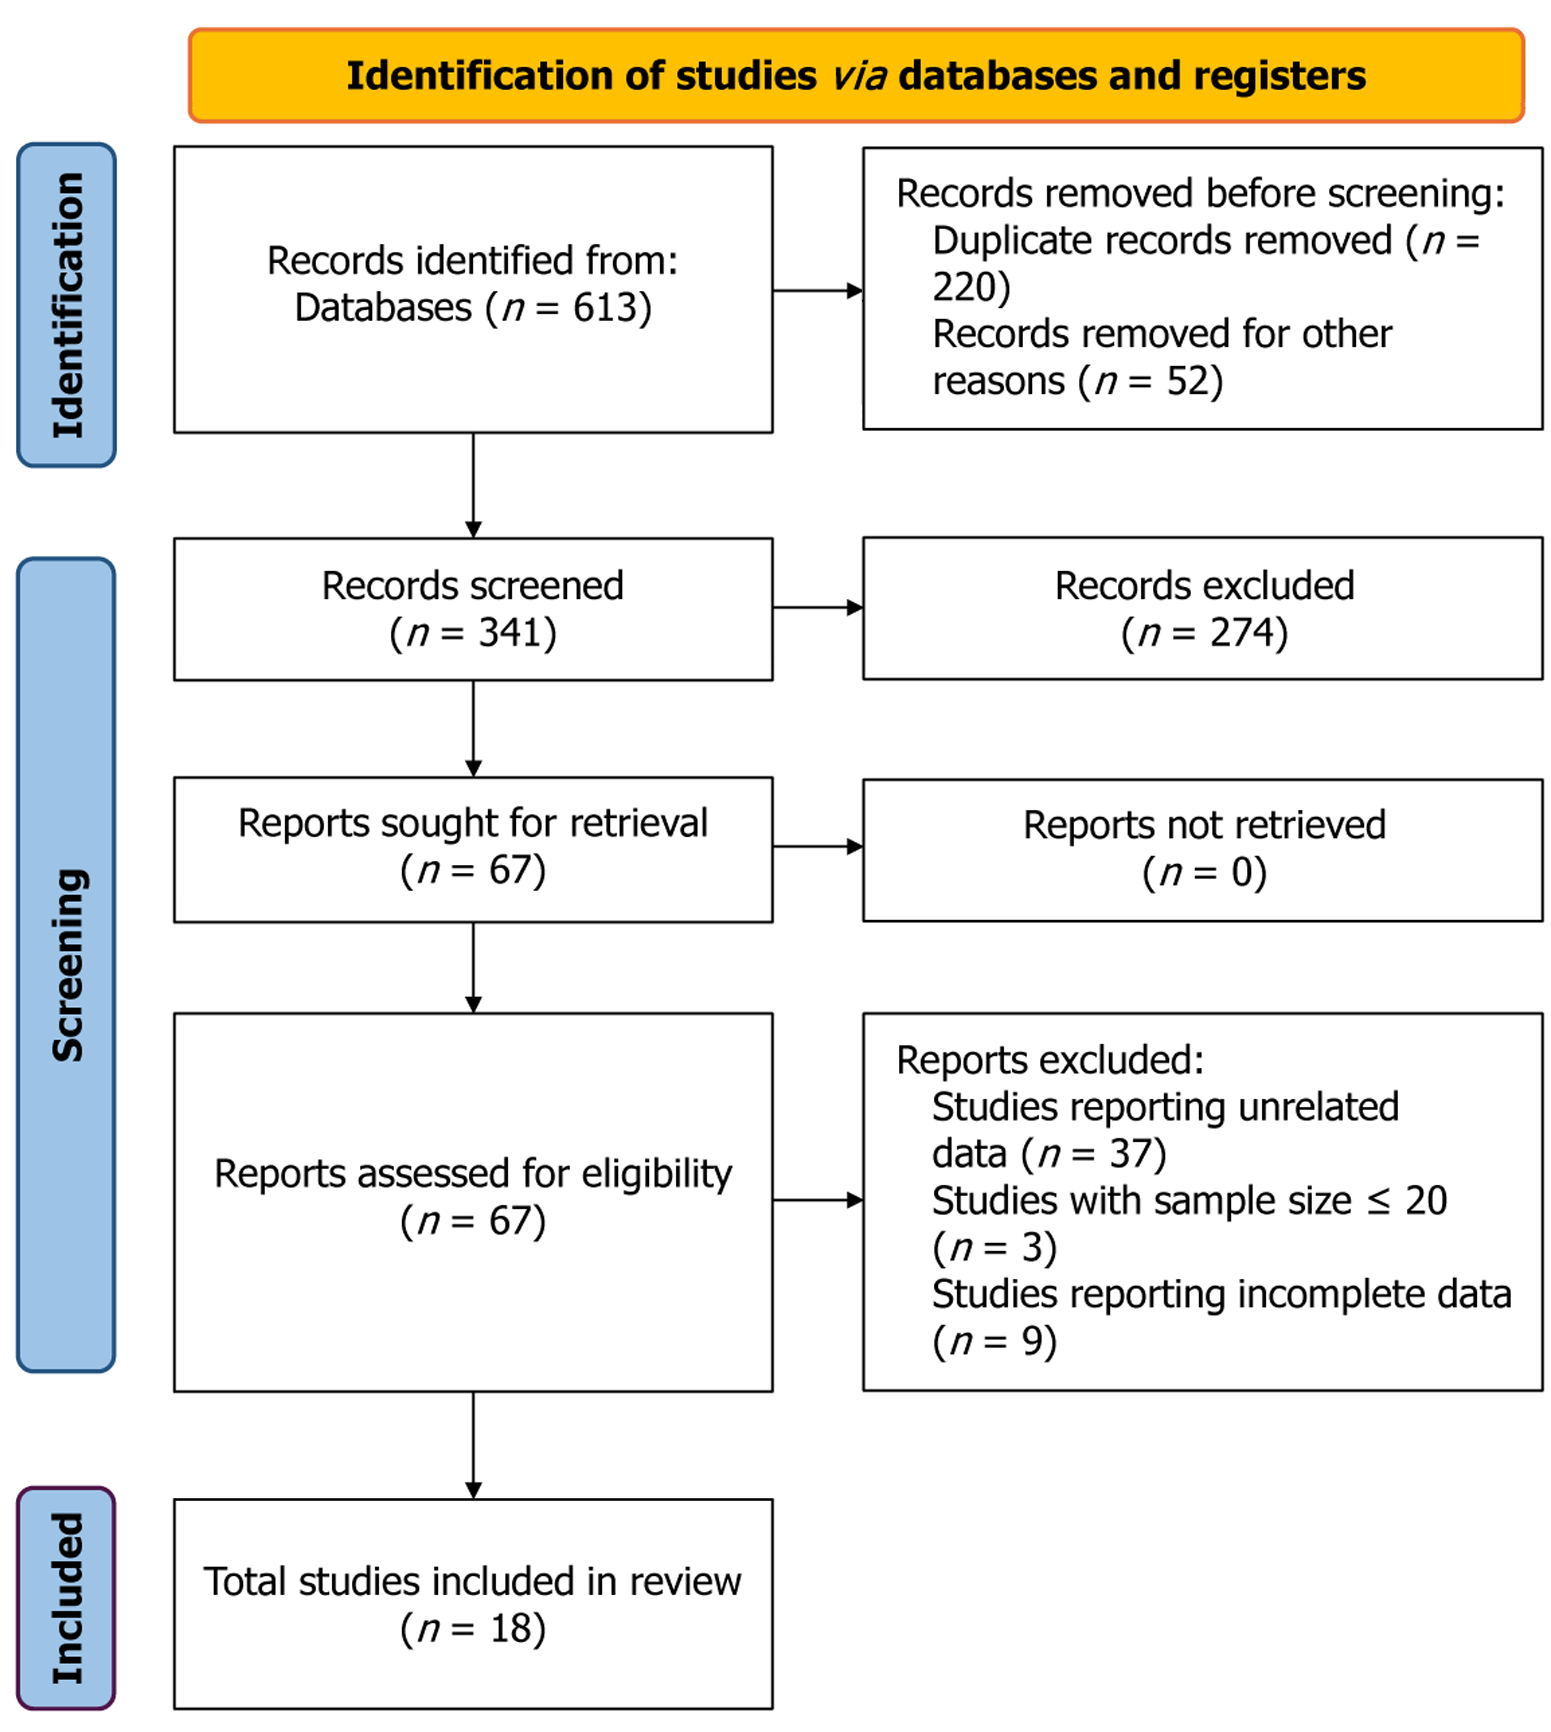
Figure 1 PRISMA flow chart.
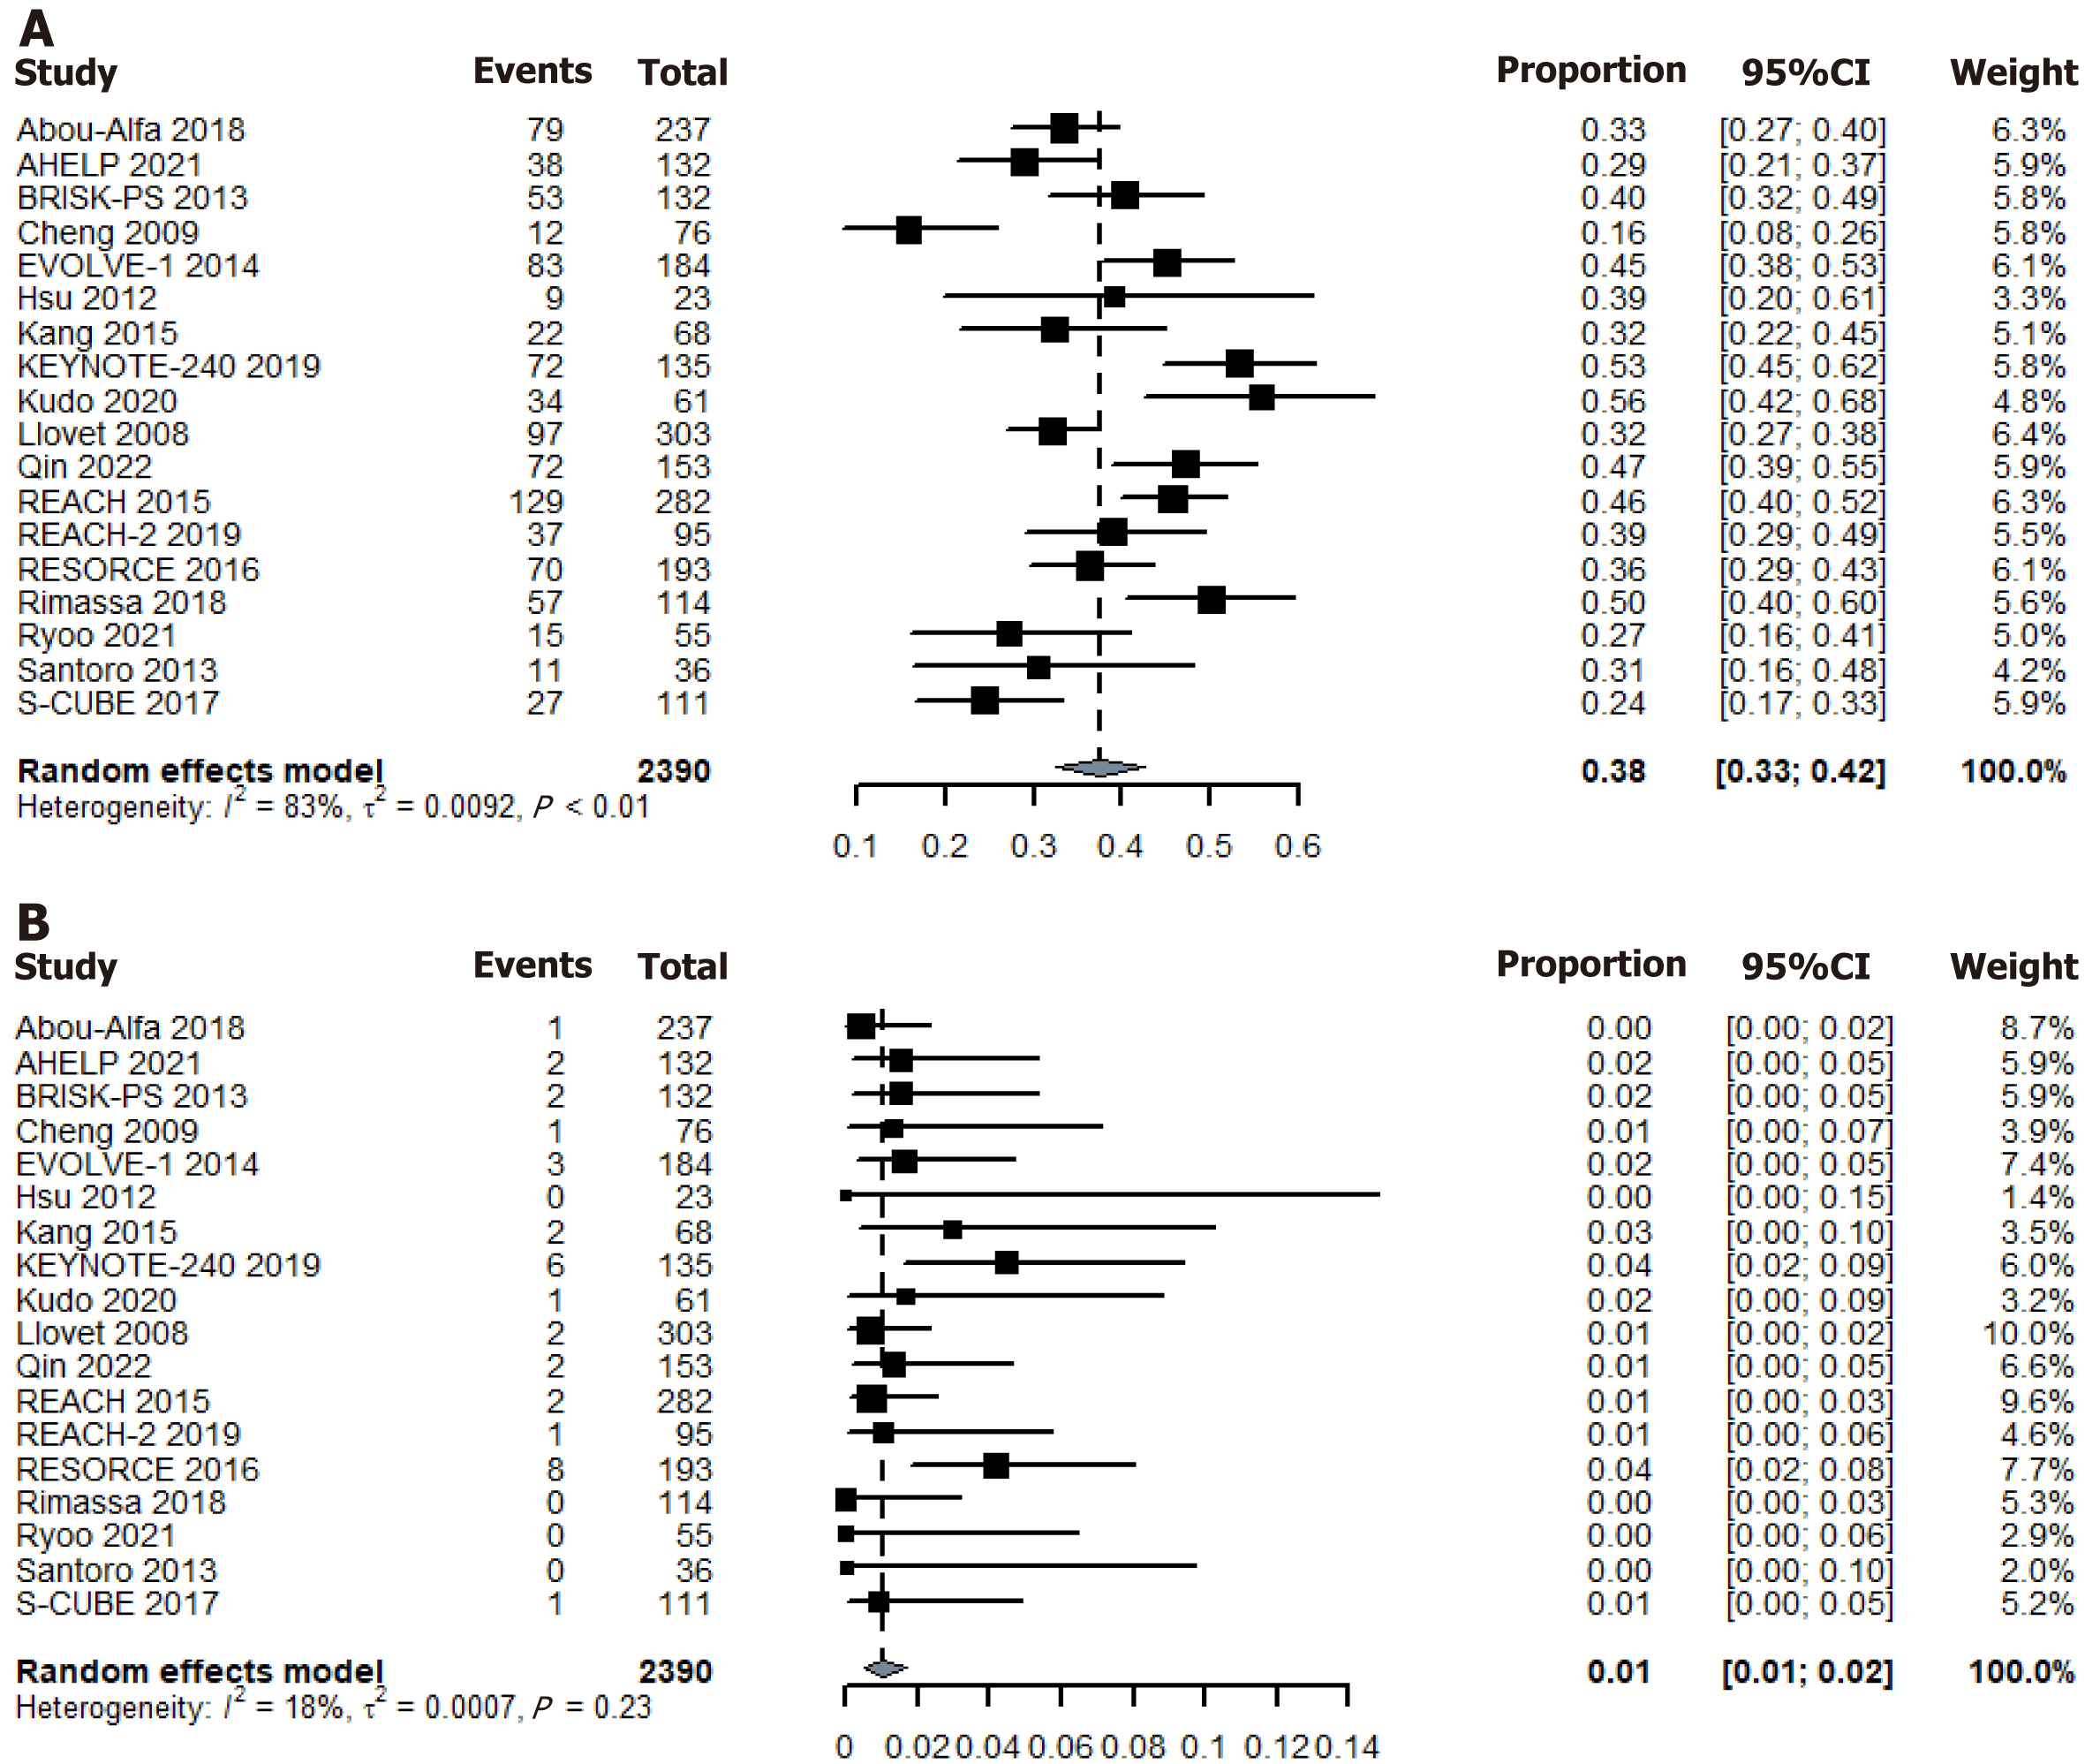
Figure 2 Forest plot of response rates in the placebo arm across the randomized controlled trials of hepatocellular carcinoma.
A: Disease control rate in the placebo arm; B: Objective response rate in the placebo arm.
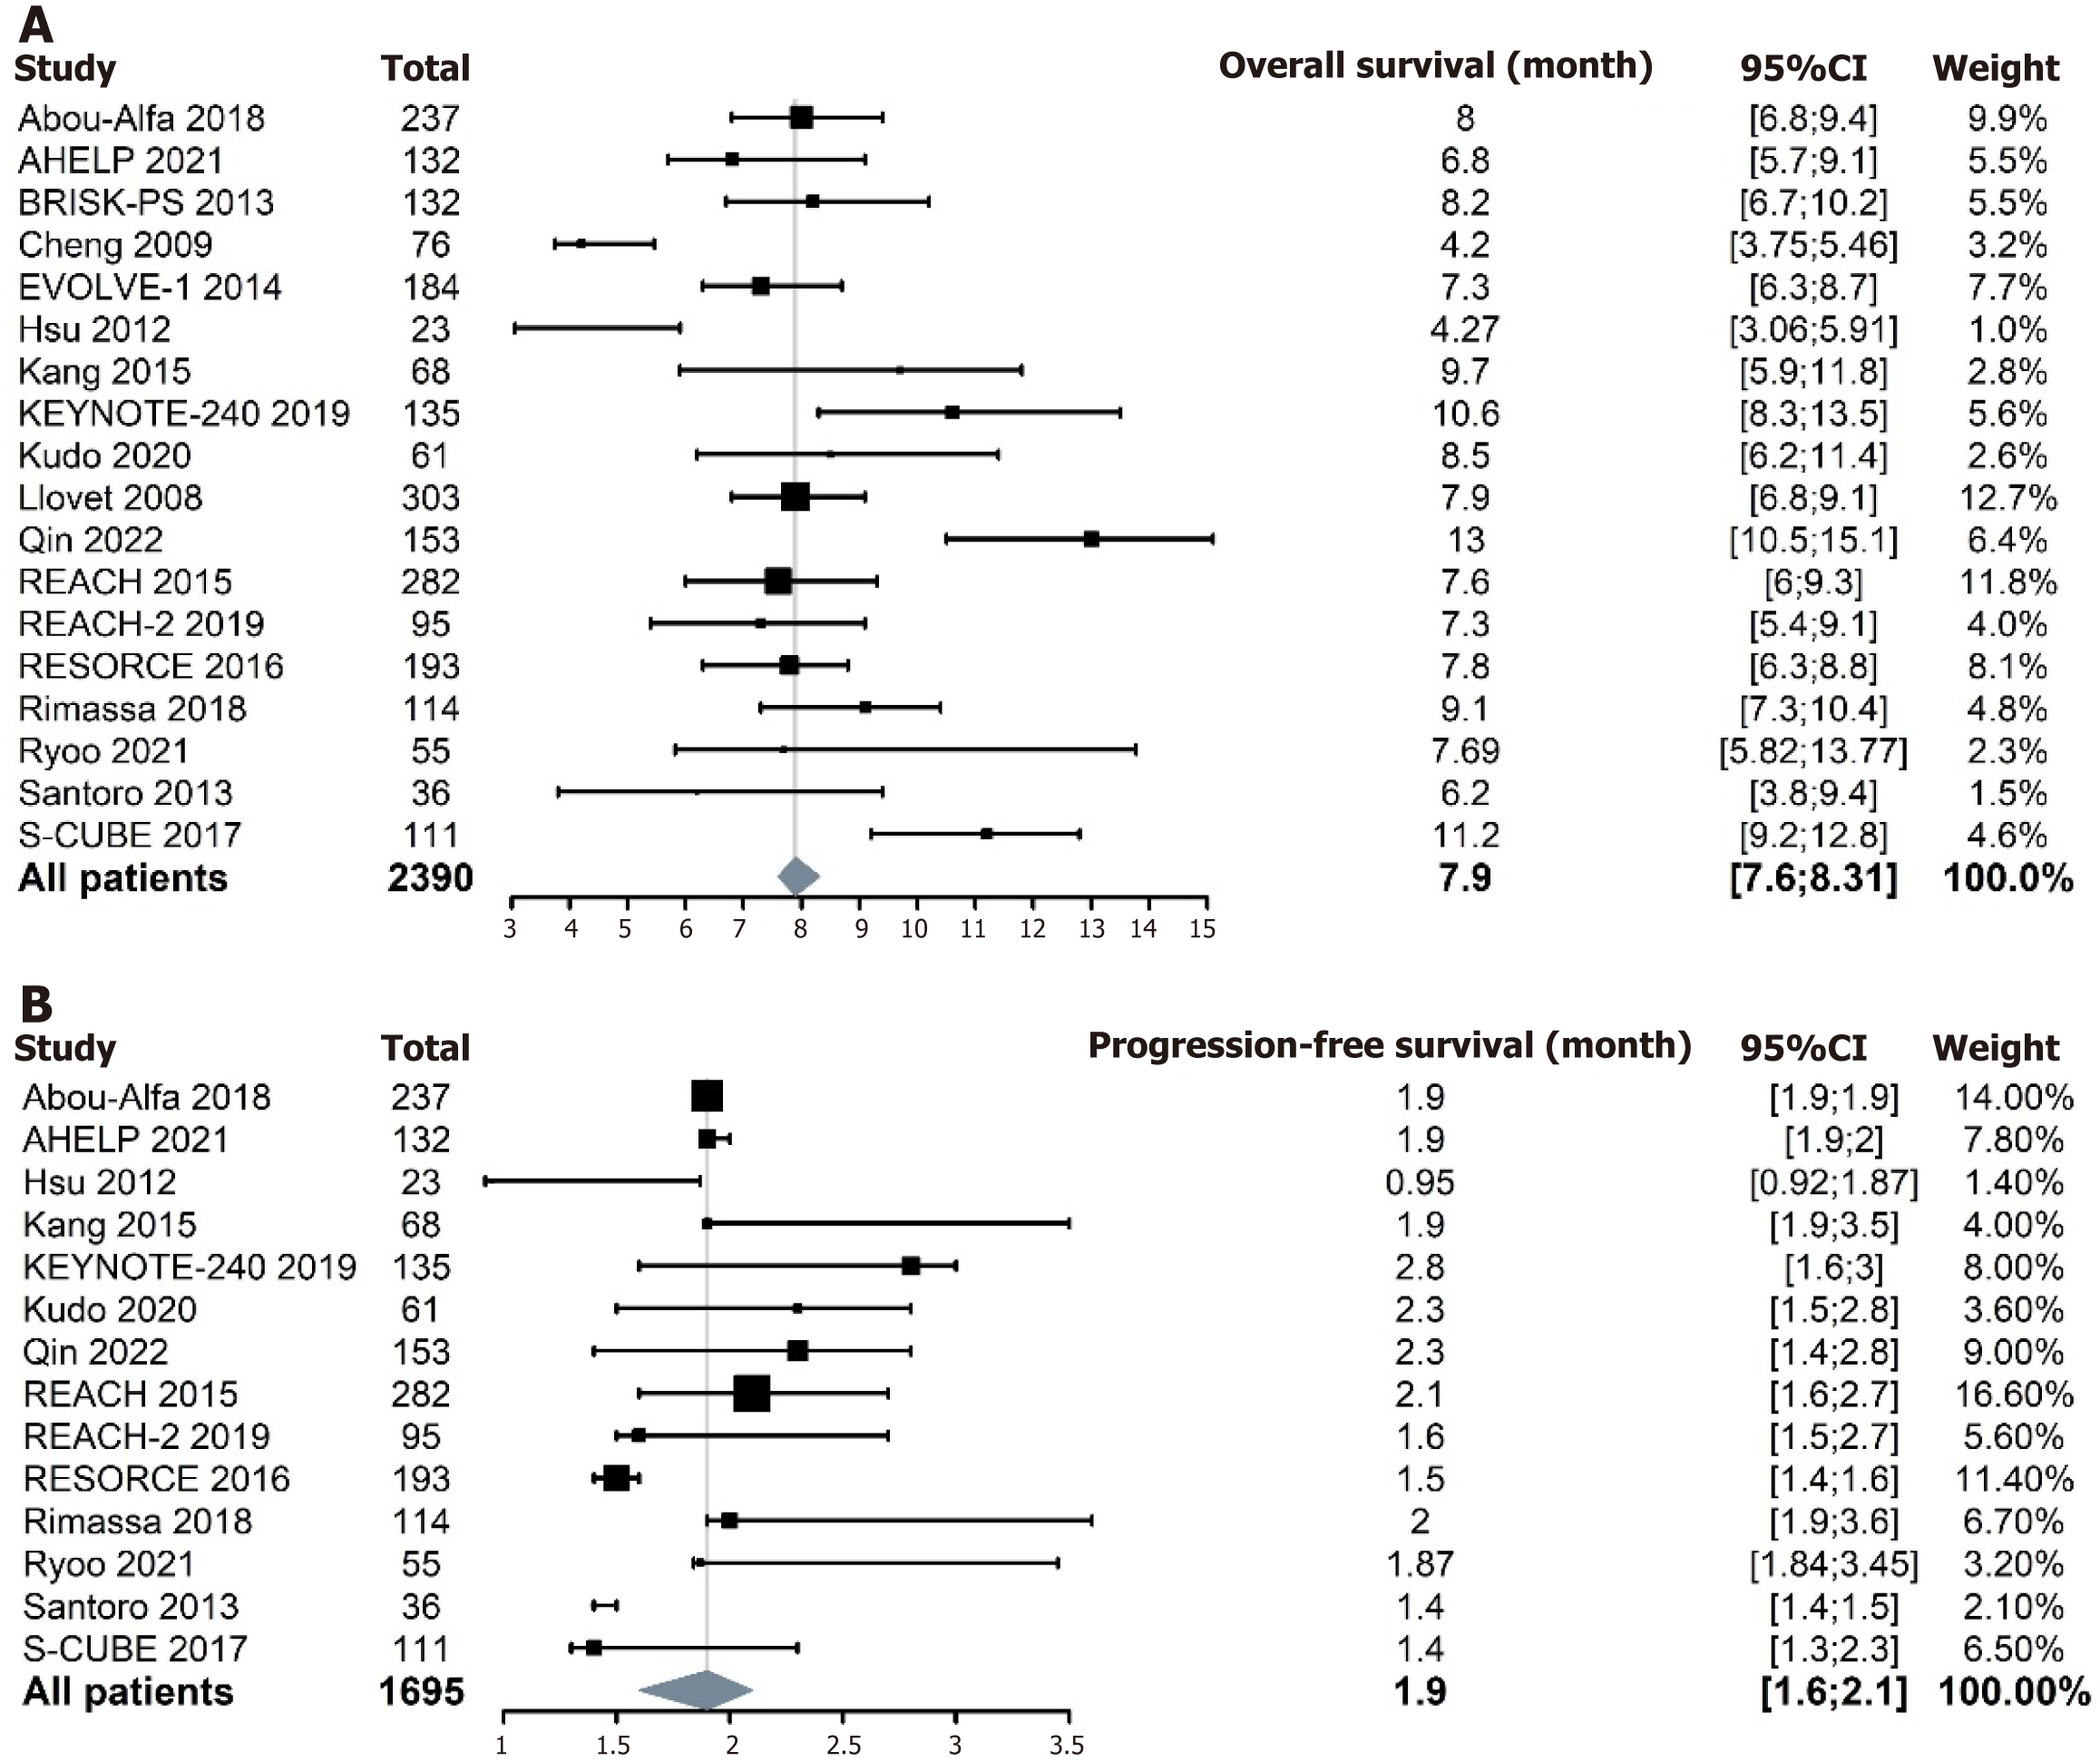
Figure 3 Forest plot of survival status in the placebo arm across the randomized controlled trials of hepatocellular carcinoma.
A: Overall survival in the placebo arm; B: Progression-free survival in the placebo arm.
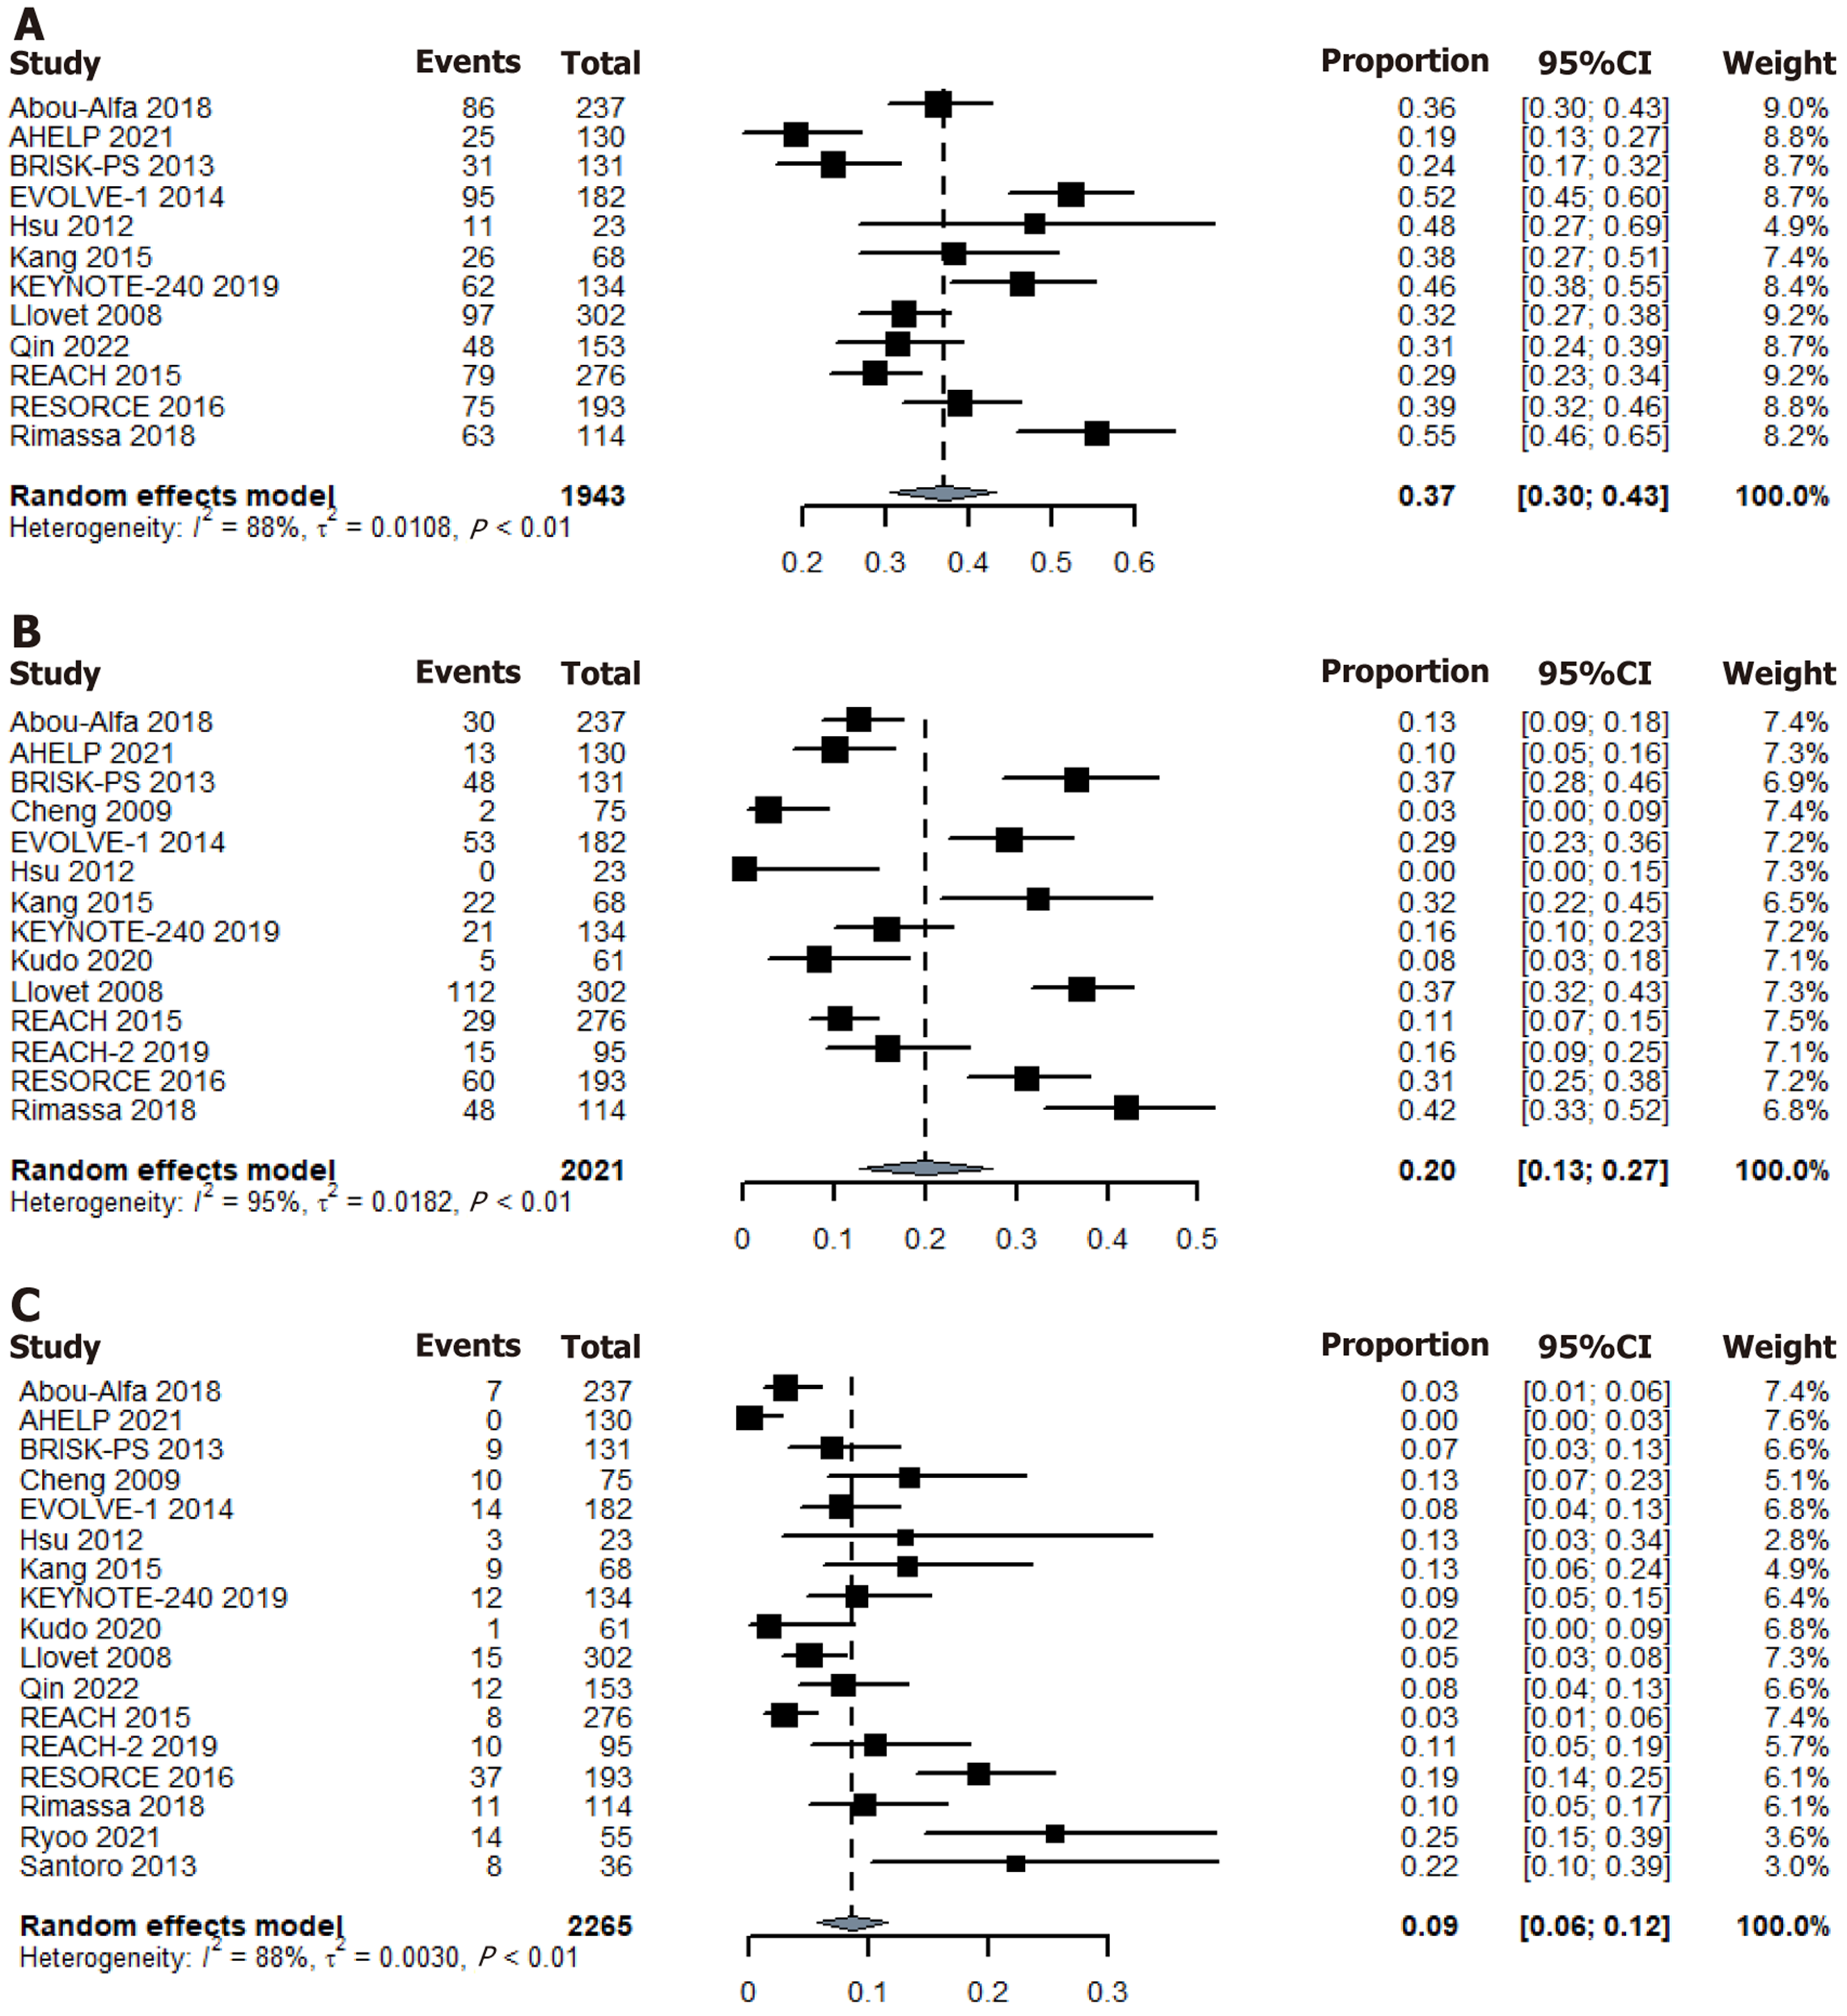
Figure 4 Forest plot of the incidence of adverse events in the placebo arm across the randomized controlled trials of hepatocellular carcinoma.
A: Grade 3 or 4 adverse events (AEs) in the placebo arm; B: Interruption or reductions due to AEs in the placebo arm; C: Treatment discontinuation due to AEs in the placebo arm.
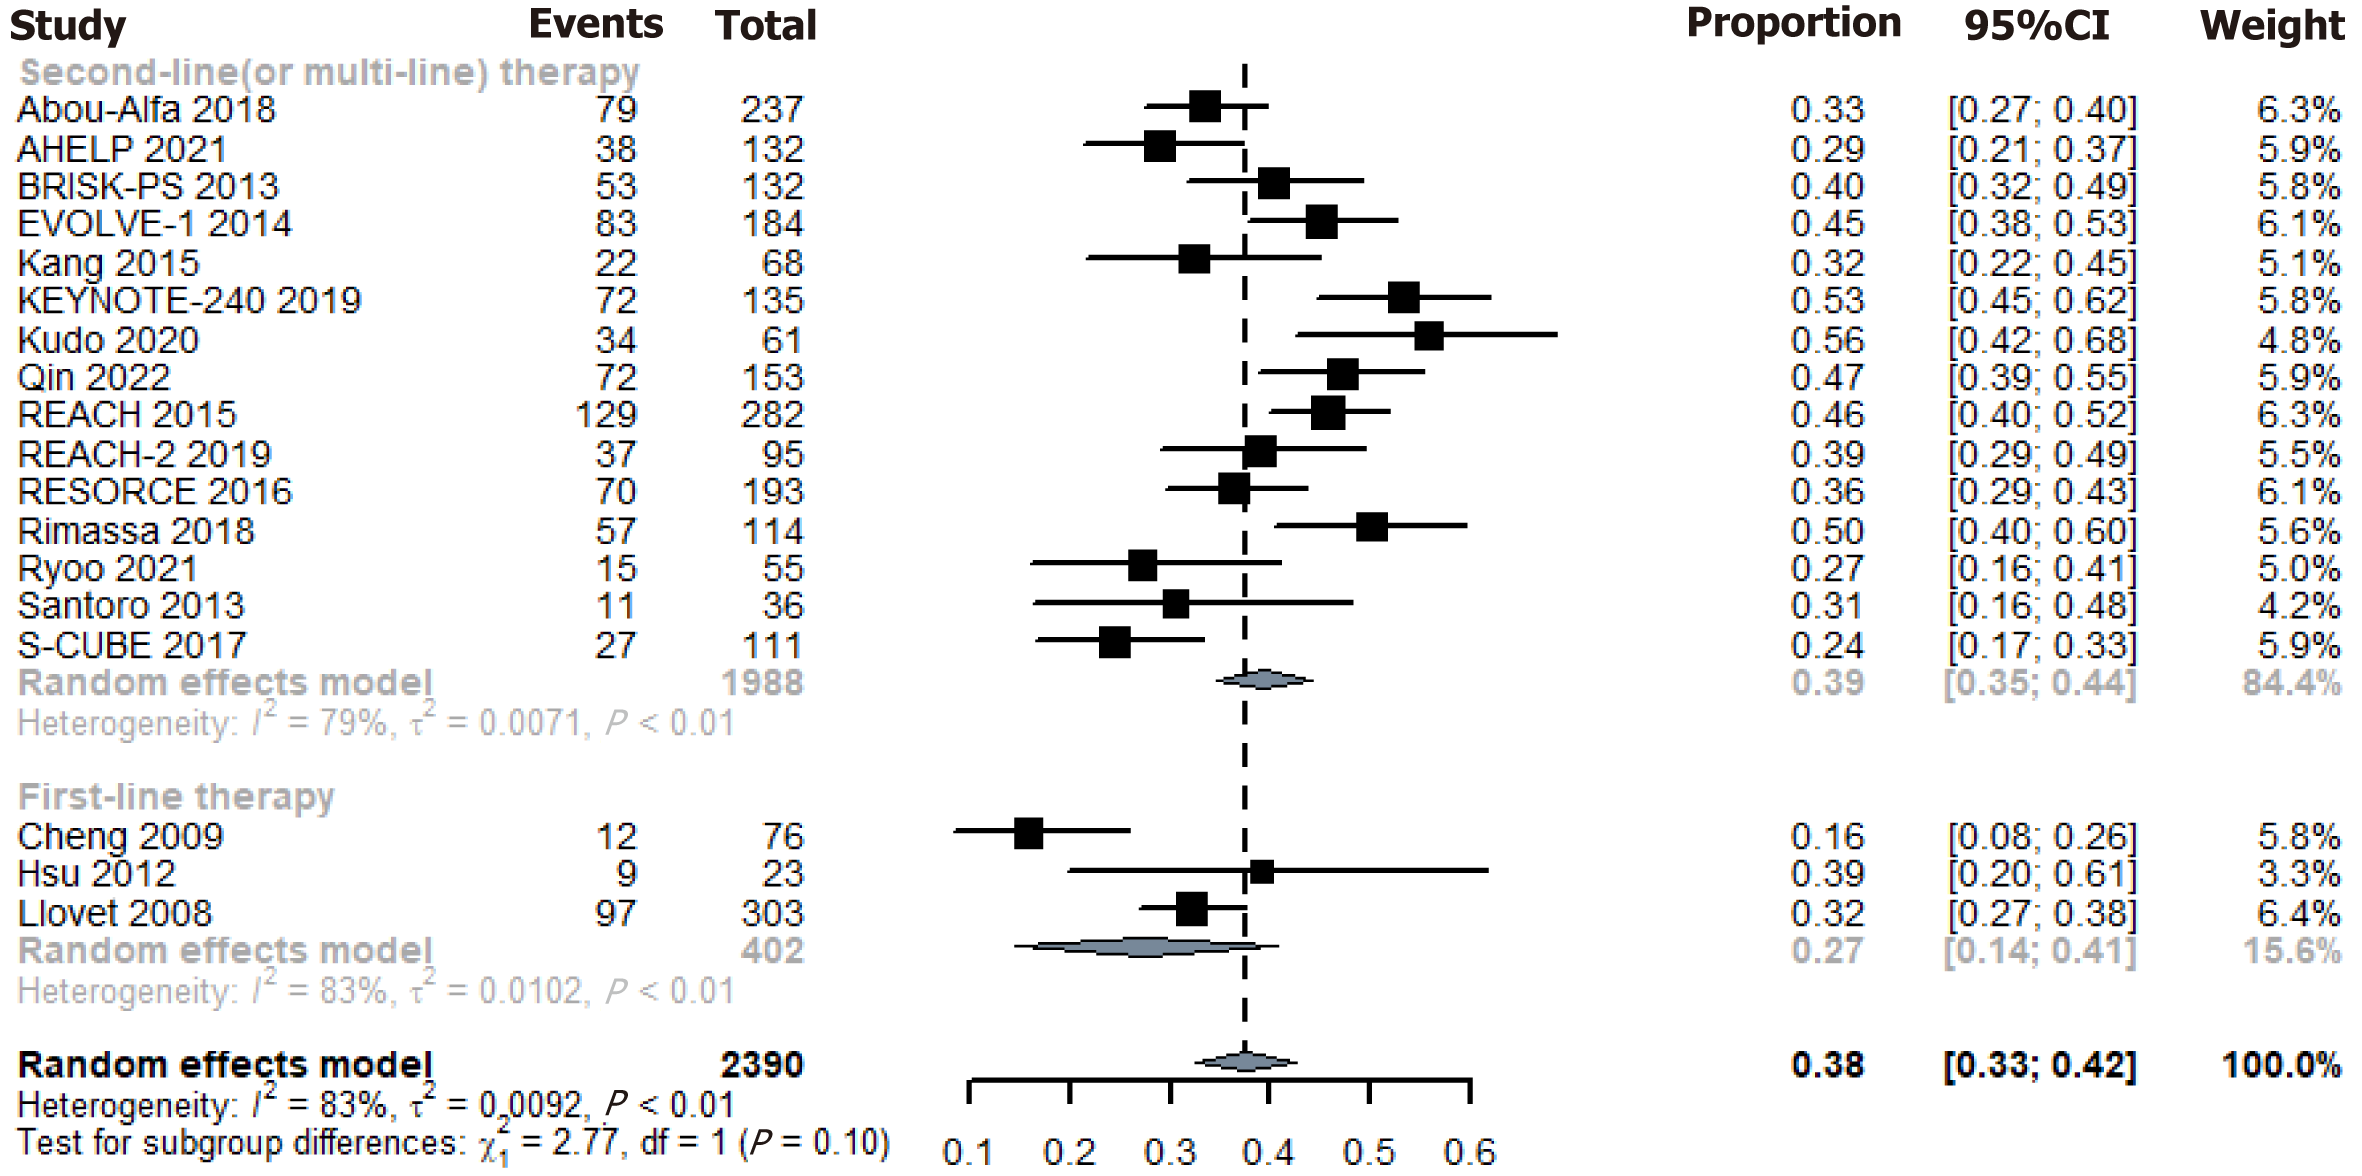
Figure 5 Subgroup analyses based on the treatment lines in placebo disease control rate.
- Citation: Chen WY, Chen Q, Wang CC, Zhang CY, Chen SK, Meng ZQ, Han P, Dong S, Chen QW. Response rates, survival status and adverse events of placebo in randomized control trials for hepatocellular carcinoma: A meta-analysis. World J Hepatol 2025; 17(8): 108533
- URL: https://www.wjgnet.com/1948-5182/full/v17/i8/108533.htm
- DOI: https://dx.doi.org/10.4254/wjh.v17.i8.108533


