Copyright
©The Author(s) 2025.
World J Hepatol. Jul 27, 2025; 17(7): 107666
Published online Jul 27, 2025. doi: 10.4254/wjh.v17.i7.107666
Published online Jul 27, 2025. doi: 10.4254/wjh.v17.i7.107666
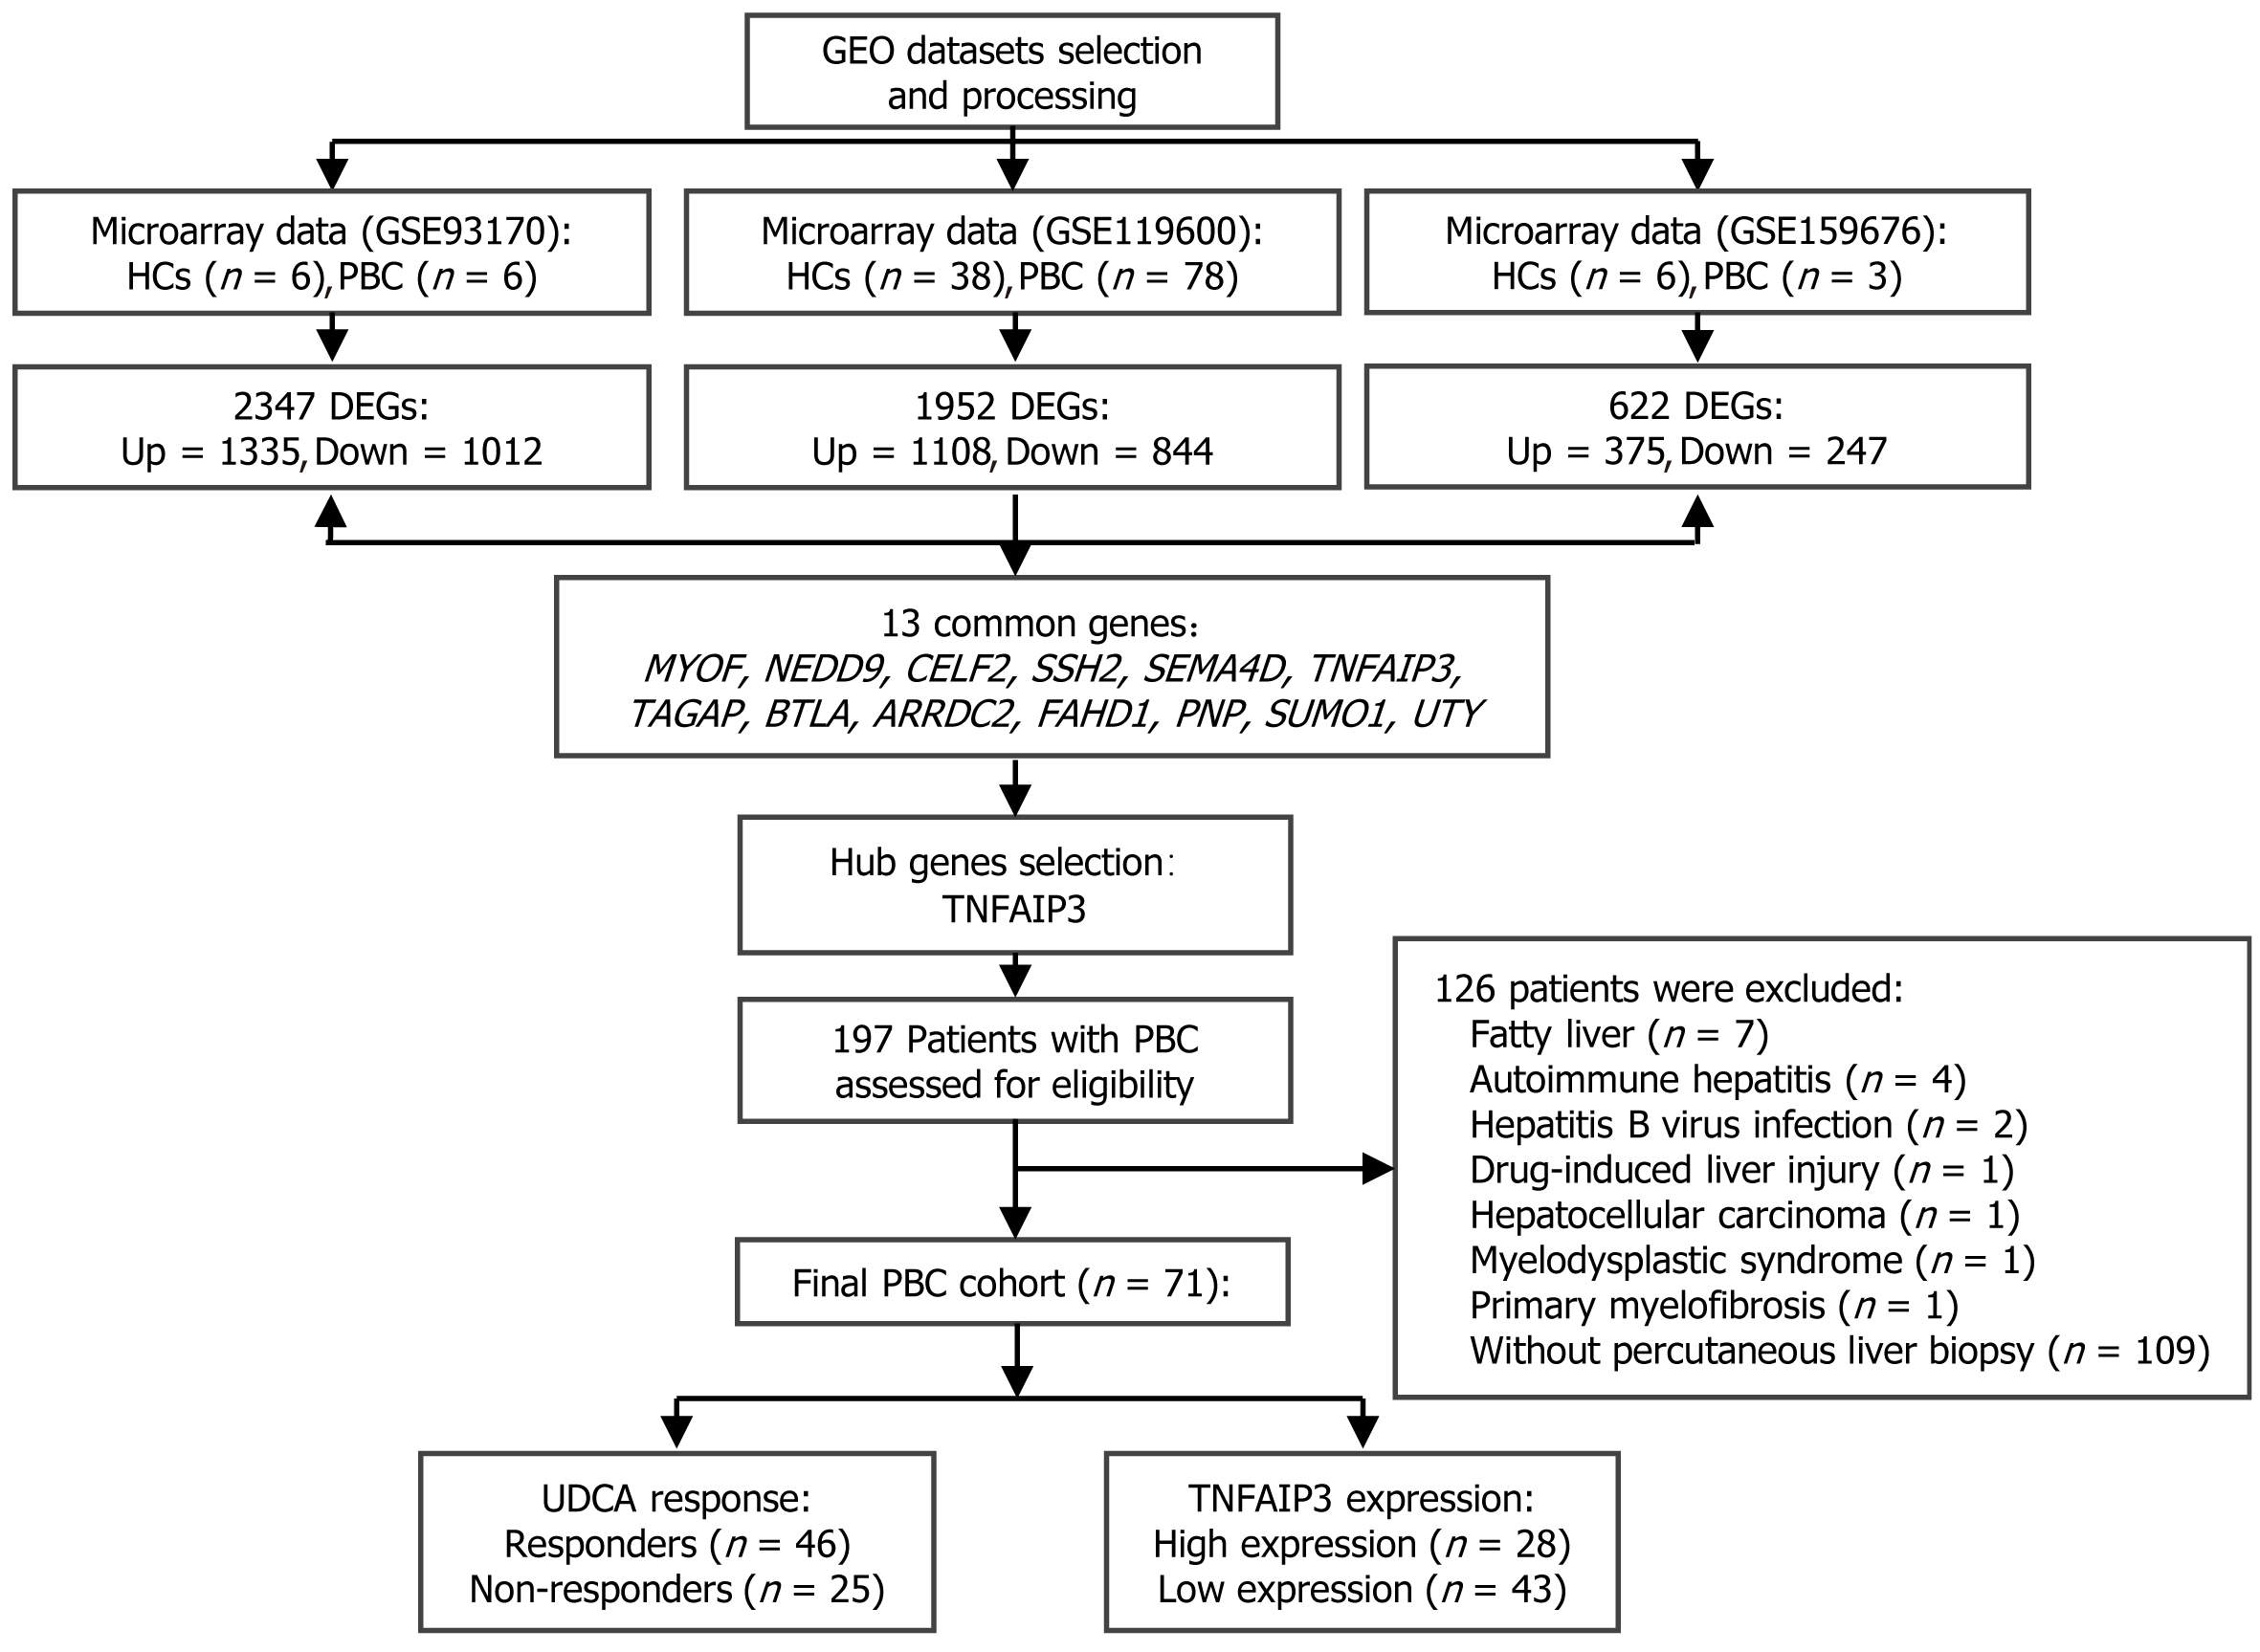
Figure 1 Patient selection and study design.
GEO: Gene Expression Omnibus; HCs: Healthy controls; PBC: Primary biliary cholangitis; UDCA: Ursodeoxycholic acid; TNFAIP3: Tumor necrosis factor alpha-induced protein 3.
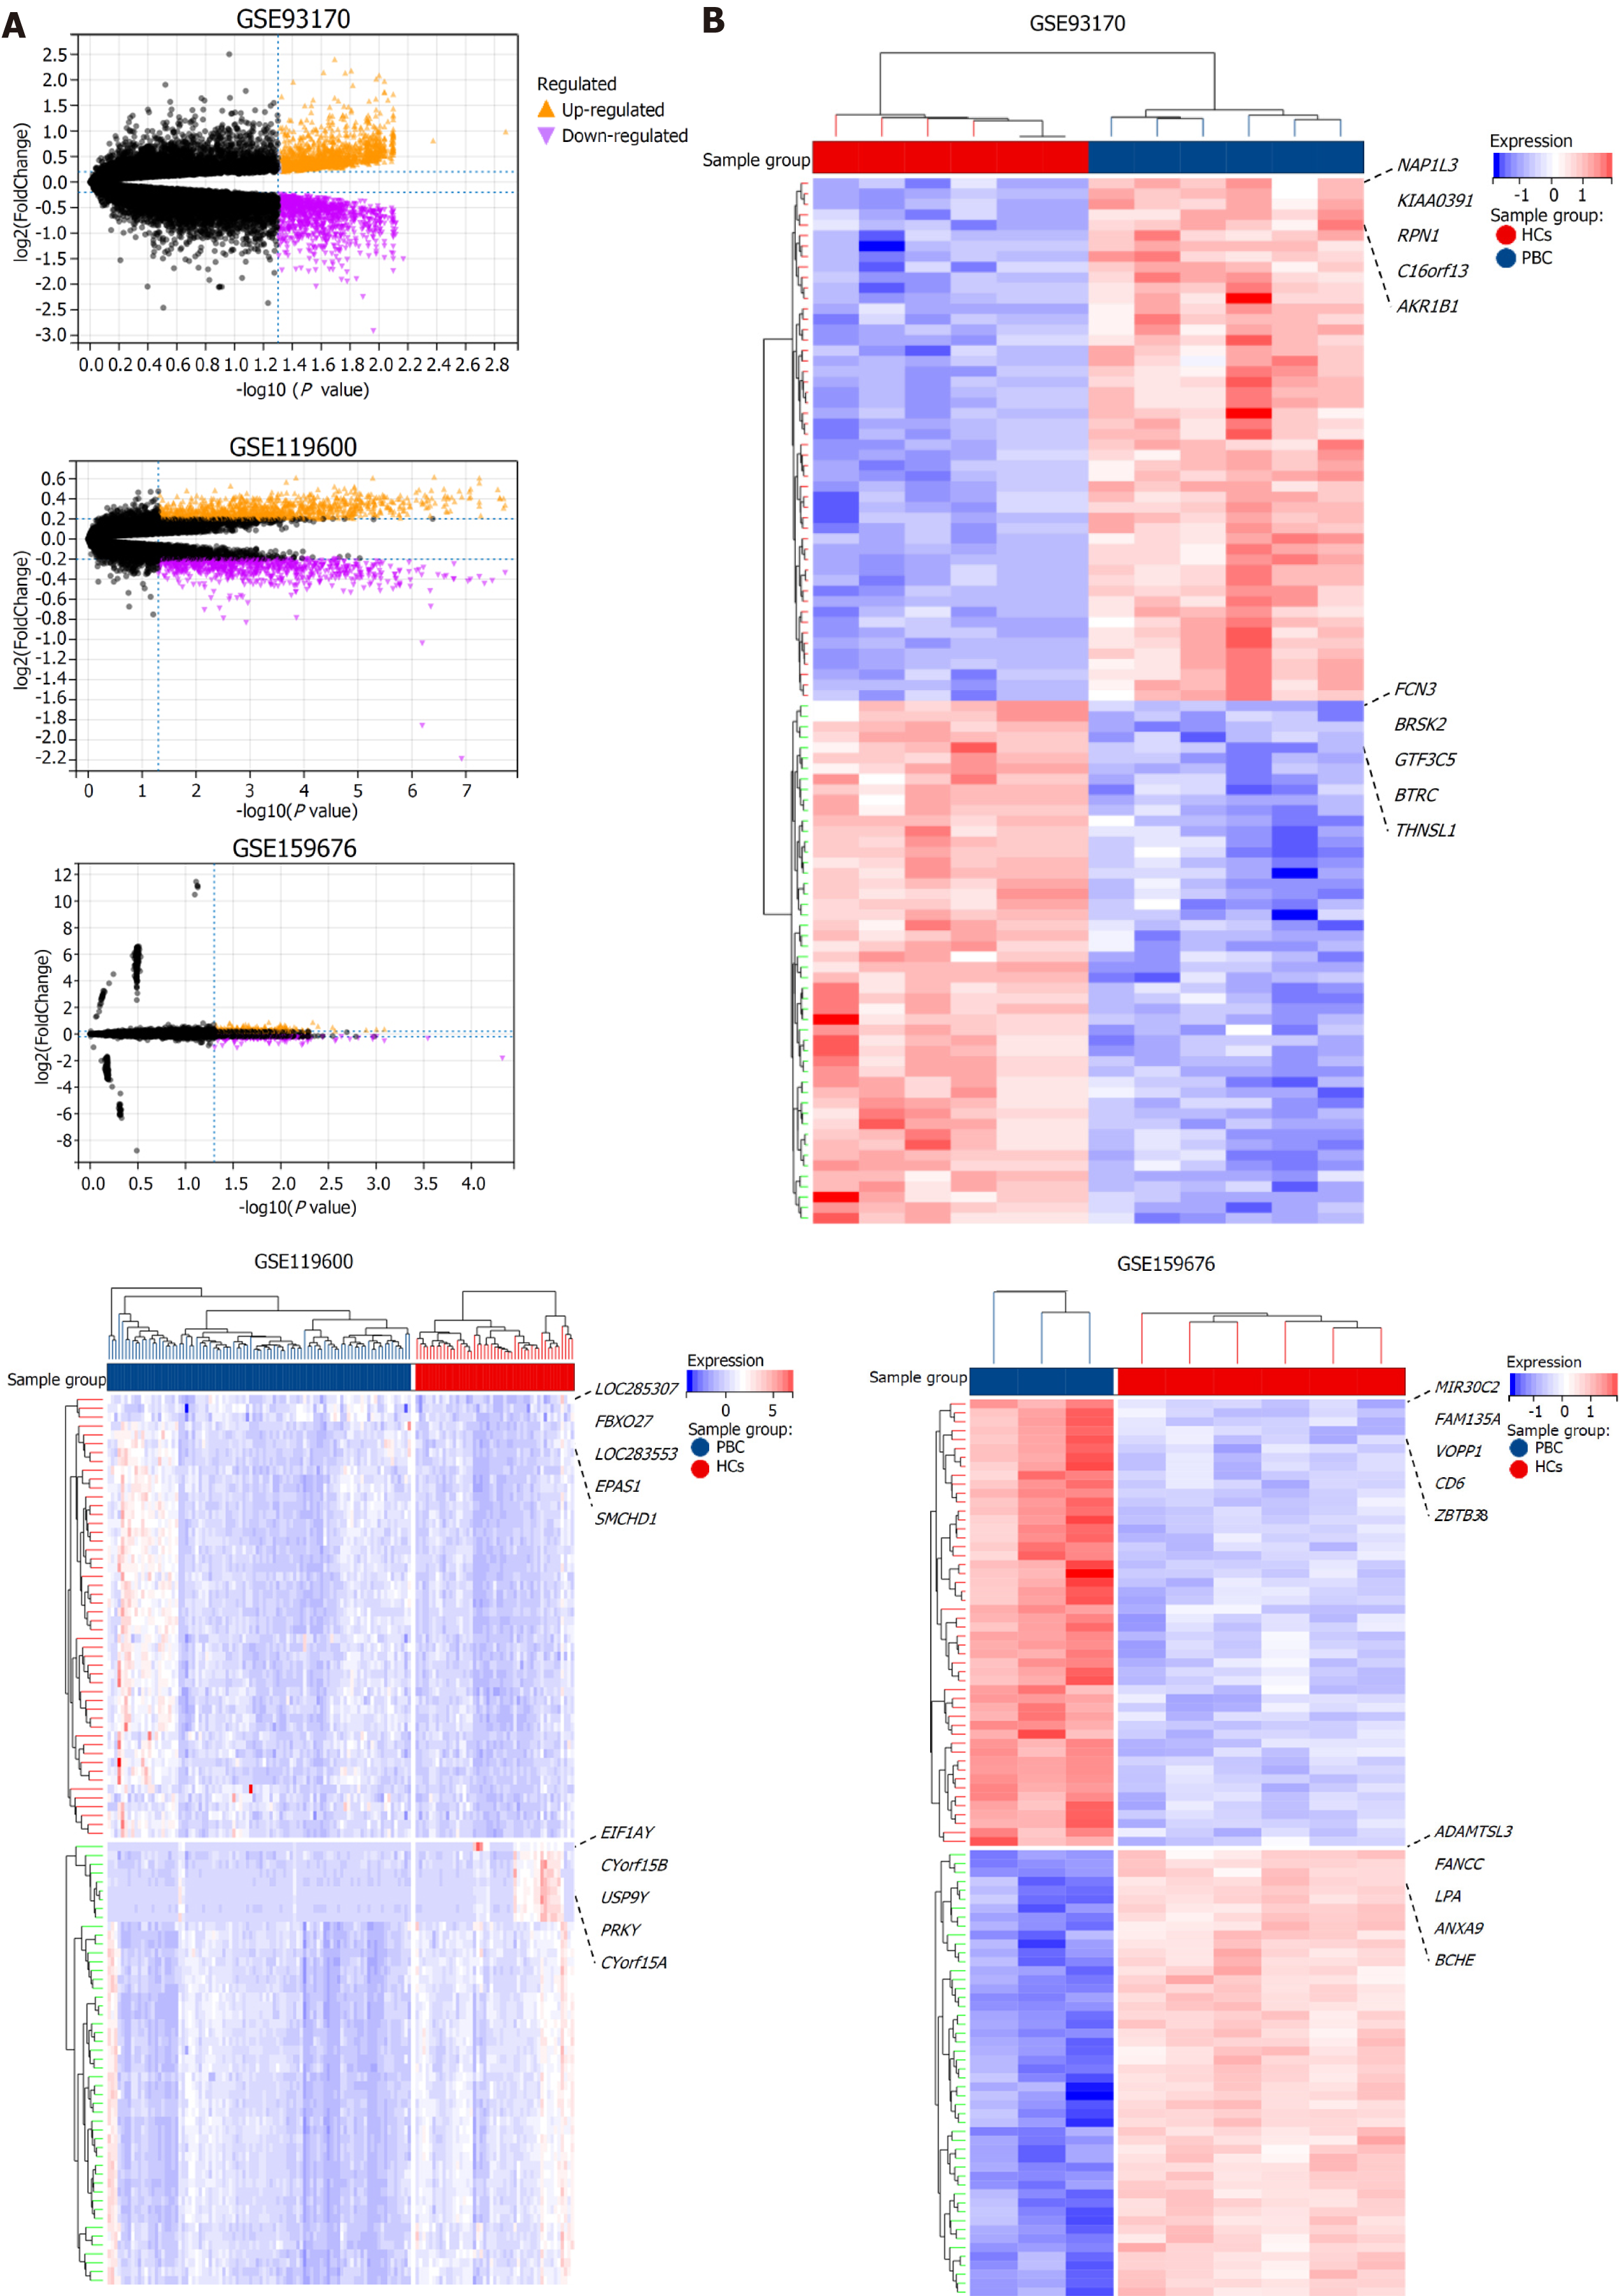
Figure 2 Volcano plots and heatmaps of differentially expressed genes in primary biliary cholangitis datasets.
A: Volcano plots of differentially expressed genes (DEGs) identified in GSE93170, GSE119600, and GSE159676 datasets. A total of 1335 upregulated and 1012 downregulated genes were identified in GSE93170, 1108 upregulated and 844 downregulated genes in GSE119600, and 375 upregulated and 247 downregulated genes in GSE159676 (adjusted P < 0.05; |log2 fold change| ≥ 0.2). Orange and purple points represent upregulated and downregulated genes, respectively; B: Heatmaps of the top 100 DEGs from each dataset, clustered by expression levels. Red and blue colors indicate higher and lower expression levels, respectively. PBC: Primary biliary cholangitis; HCs: Healthy controls.
Figure 3 Identification of common differentially expressed genes and investigation of tumor necrosis factor alpha-induced protein 3 expression in primary biliary cholangitis.
A: Venn diagram illustrated the common differentially expressed genes among three datasets (GSE159676, GSE93170, and GSE119600). A total of 13 differentially expressed genes were identified to be shared across all three datasets, including MYOF, NEDD9, CELF2, SSH2, SEMA4D, tumor necrosis factor alpha-induced protein 3 (TNFAIP3), TAGAP, BTLA, ARRDC2, FAHD1, PNP, SUMO1, and UTY; B: Immunohistochemistry of TNFAIP3 expression in the liver tissues from healthy controls (HCs) and primary biliary cholangitis (PBC) patients. Representative images showed the distinct staining pattern in both groups. Scale bars: 100 μm (upper panel), 20 μm (lower panel); C: Quantification of TNFAIP3 expression in the liver tissue from HCs and PBC patients. The relative TNFAIP3 expression level in the liver tissue of PBC was significantly higher than in HCs (aP < 0.0001). PBC: Primary biliary cholangitis; HCs: Healthy controls; TNFAIP3: Tumor necrosis factor alpha-induced protein 3.
Figure 4 Risk factors and predictive performance of tumor necrosis factor alpha-induced protein 3 and fatigue for response to ursodeoxycholic acid in primary biliary cholangitis patients.
A: Forest plot showed independent risk factors for response to ursodeoxycholic acid (UDCA) in primary biliary cholangitis patients. Fatigue (odds ratio = 5.572; 95%CI: 1.346-23.062, P = 0.018) and tumor necrosis factor alpha-induced protein 3 (TNFAIP3) expression (odds ratio = 0.851; 95%CI: 0.733-0.988, P = 0.035) were both identified as risk factors associated with poor response to UDCA. Variables with statistical significance are marked in orange, while non-significant variables are marked in blue; B: Receiver operating characteristic curve analysis of TNFAIP3 and fatigue for response to UDCA. The area under the curve values are 0691 for TNFAIP3, 0.704 for fatigue, and 0.848 for their combination. The orange, blue, and purple lines represent the combination, TNFAIP3 alone, and fatigue alone, respectively. OR: Odds ratio; ROC: Receiver operating characteristic; CI: Confidence interval; AUC: Area under the curve; TNFAIP3: Tumor necrosis factor alpha-induced protein 3; TBIL: Total bilirubin; ALP: Alkaline phosphatase; GGT: Gamma-glutamyl transpeptidase; ACA: Anti-centromere antibodies.
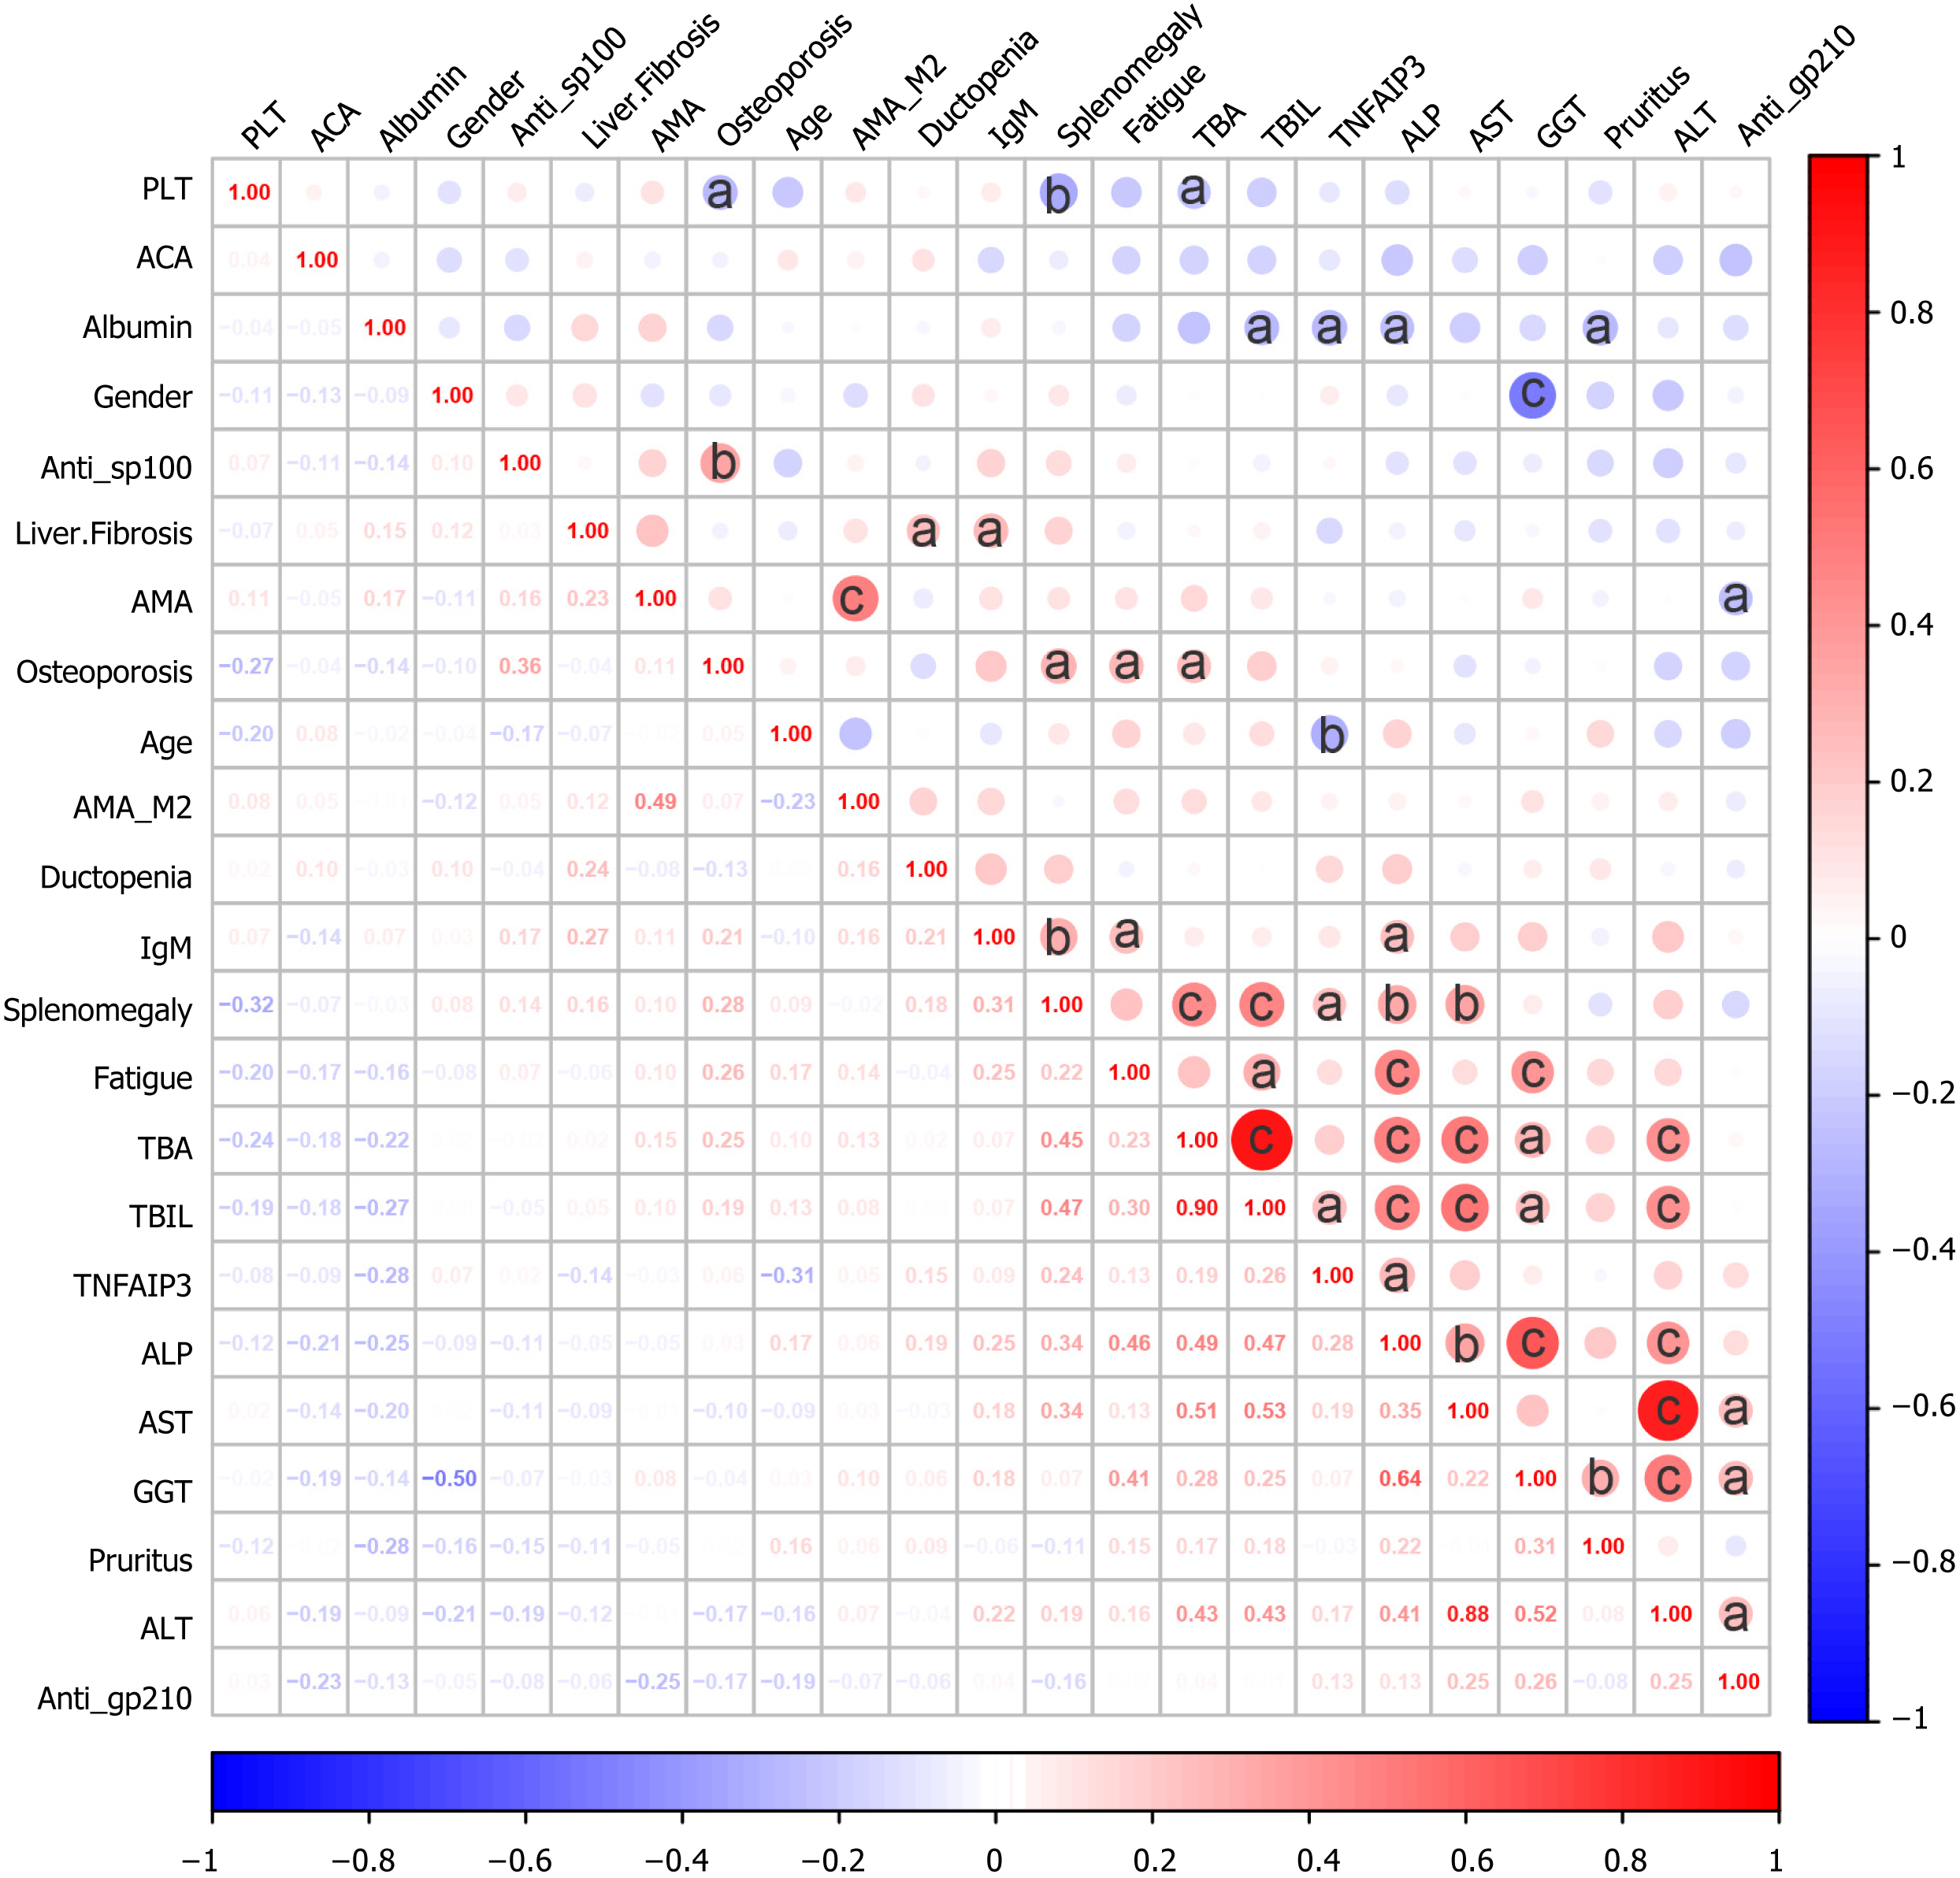
Figure 5 Correlation heatmap.
The heatmap illustrated the correlations between expression of tumor necrosis factor alpha-induced protein 3 and various clinical parameters in primary biliary cholangitis patients. The color of the circles indicates the status of the correlation, with red representing positive correlations and blue representing negative correlations. The size and color depth of the circles represent the strength of the correlation, with larger and darker circles indicating stronger correlations. Asterisks denote statistically significant correlations (aP < 0.05, bP < 0.01, cP < 0.001). TNFAIP3: Tumor necrosis factor alpha-induced protein 3; PLT: Platelets; ACA: Anti-centromere antibodies; AMA: Anti-mitochondrial antibodies; IgM: Immunoglobulin M; TBA: Total bile acid; TBIL: Total bilirubin; ALP: Alkaline phosphatase; AST: Aspartate aminotransferase; GGT: Gamma-glutamyl transpeptidase; ALT: Alanine aminotransferase.
- Citation: Zang B, Li JX, Liu QX, Yao Y, Li H, Wang Y, Wang JG, Yang YF, Liang RW, Xin XR, Liu B. Tumor necrosis factor alpha-induced protein 3: A key biomarker for response to ursodeoxycholic acid in primary biliary cholangitis. World J Hepatol 2025; 17(7): 107666
- URL: https://www.wjgnet.com/1948-5182/full/v17/i7/107666.htm
- DOI: https://dx.doi.org/10.4254/wjh.v17.i7.107666


