Copyright
©The Author(s) 2025.
World J Hepatol. Jul 27, 2025; 17(7): 106991
Published online Jul 27, 2025. doi: 10.4254/wjh.v17.i7.106991
Published online Jul 27, 2025. doi: 10.4254/wjh.v17.i7.106991
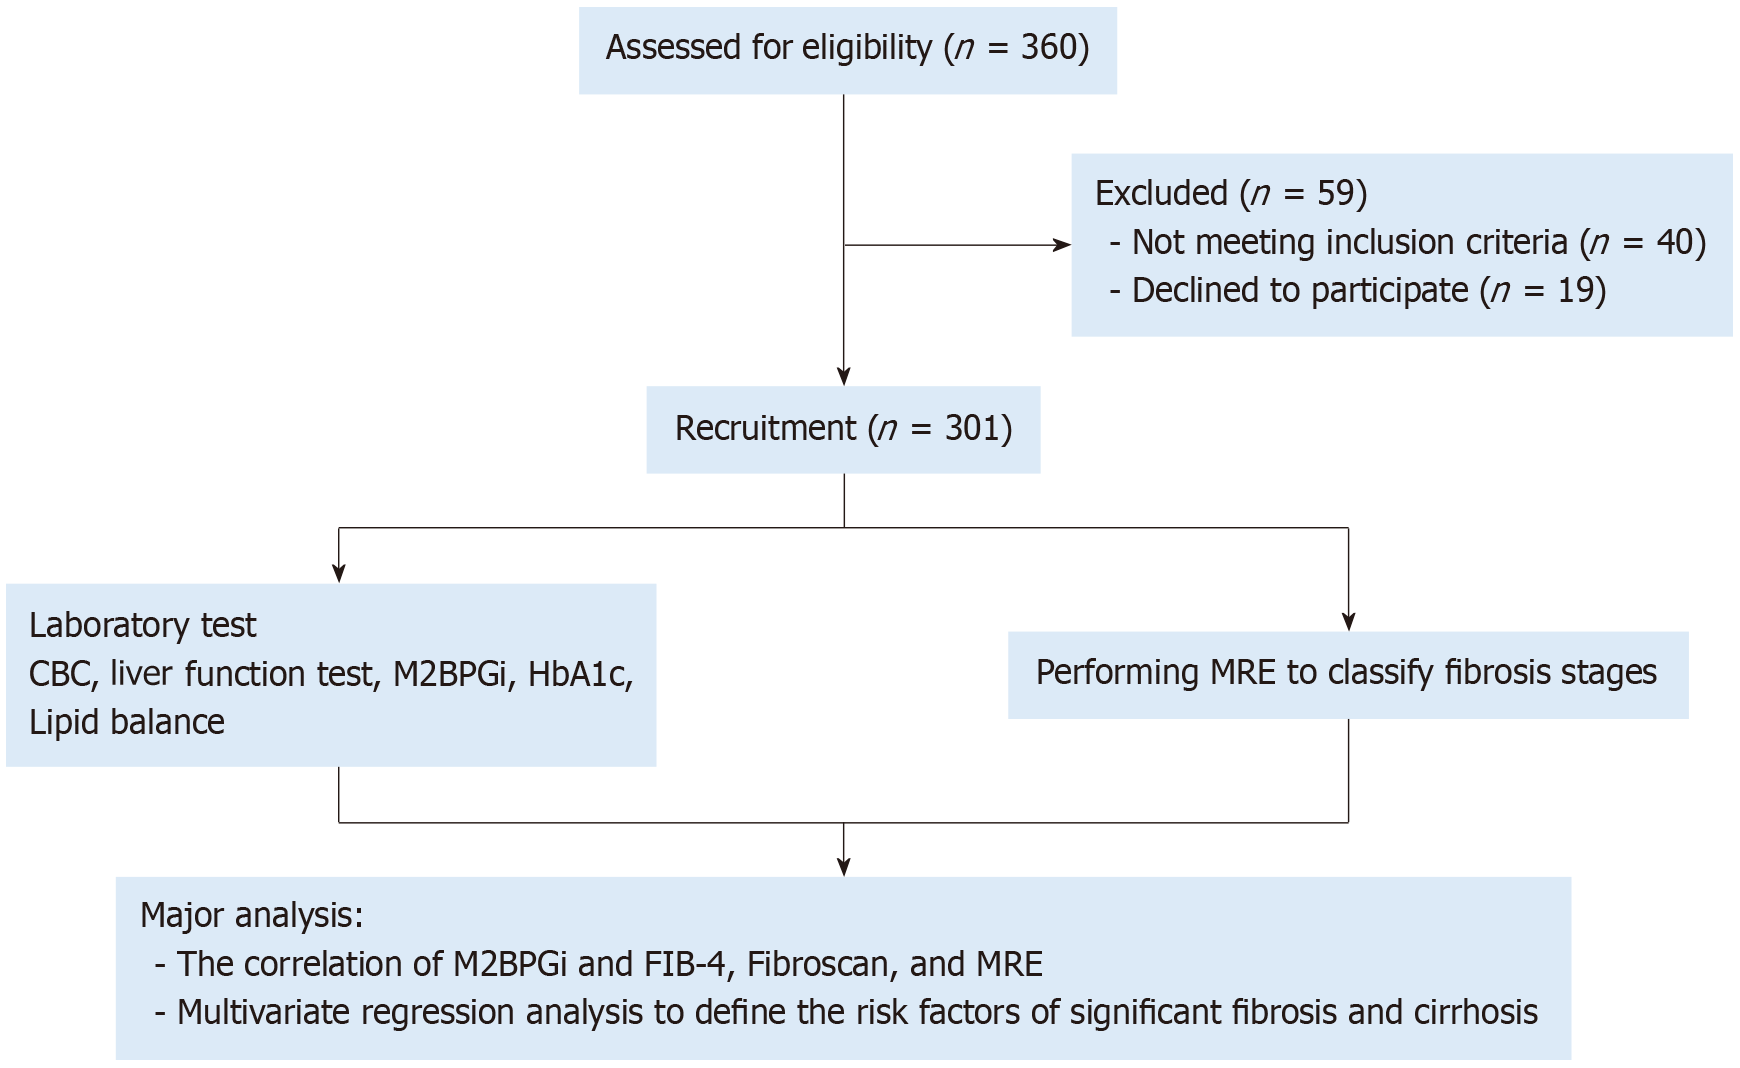
Figure 1 Study flow diagram.
CBC: Complete blood count; FIB-4: Fibrosis-4 Index; HbA1c: Hemoglobin A1c; M2BPGi: Mac-2 binding protein glycosylated isomer; MRE: Magnetic resonance elastography.
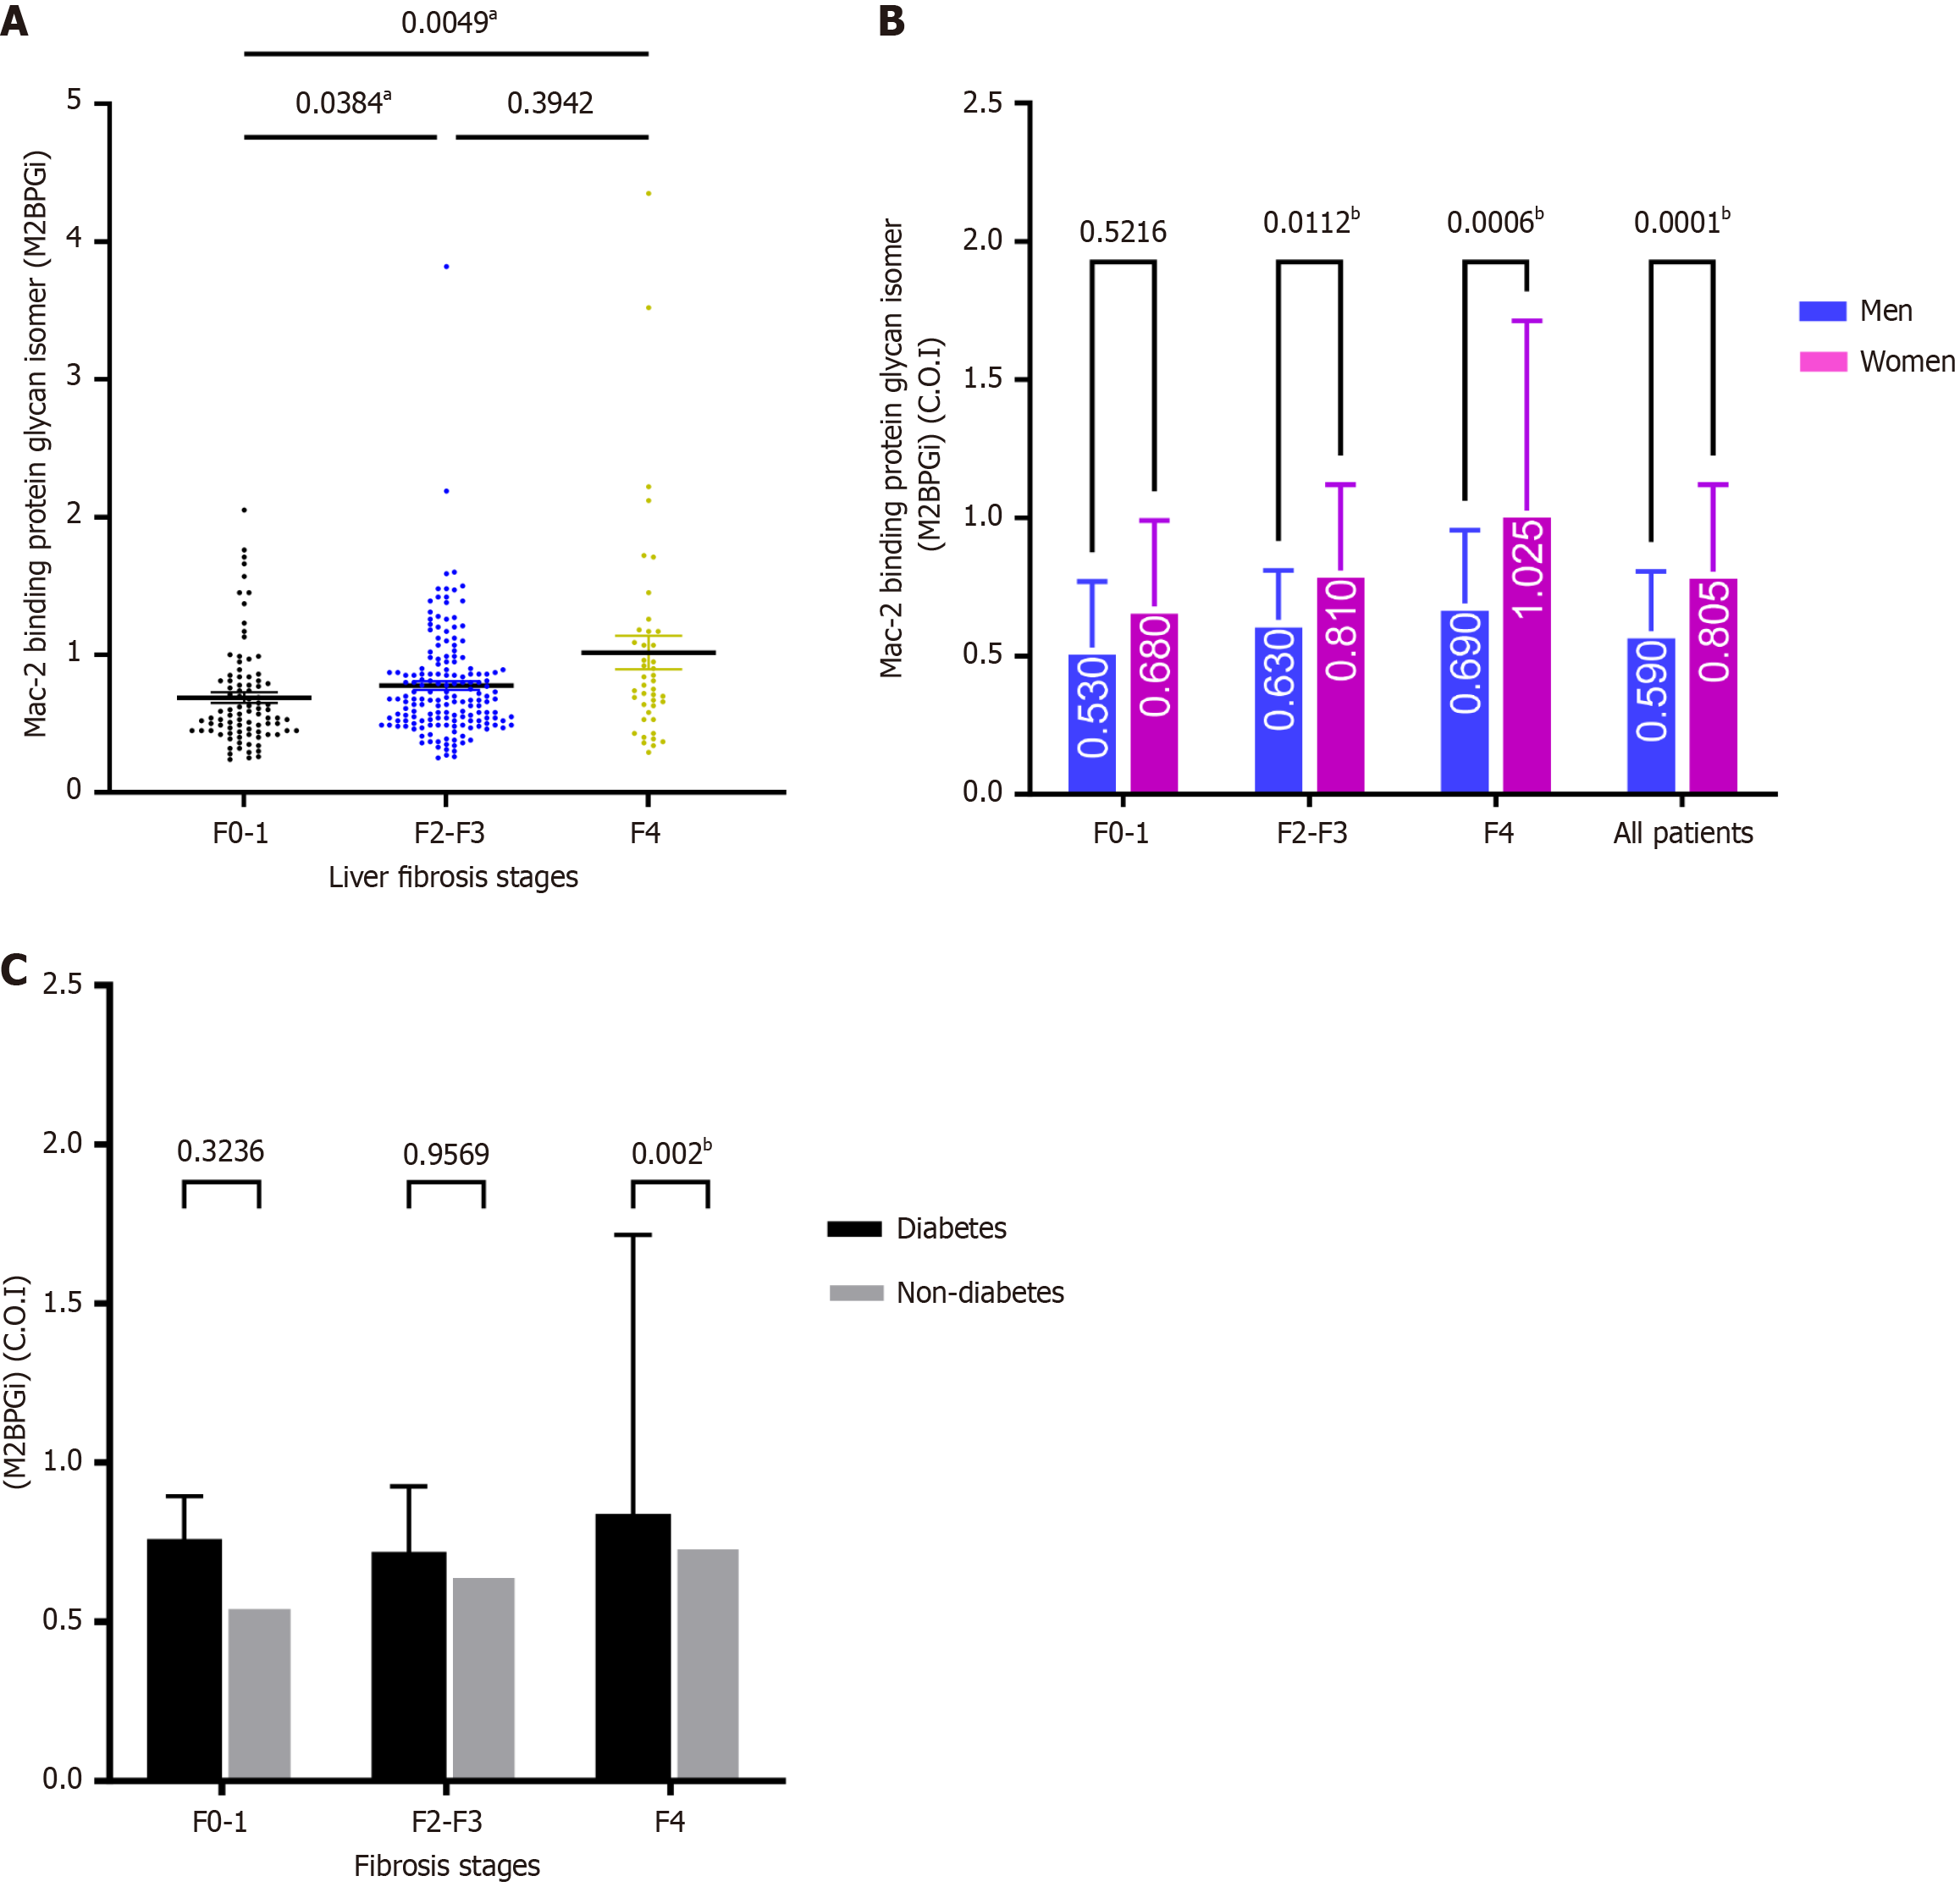
Figure 2 Median of mac-2 binding protein glycosylated isomer levels.
A: Median of mac-2 binding protein glycosylated isomer (M2BPGi) levels between different fibrosis stages; B: M2BPGi distributed in various sex-subgrouped fibrosis stages; C: M2BPGi distribution through diabetes-subgroups fibrosis stages. COI: Cut-off index; M2BPGi: Mac-2 binding protein glycosylated isomer. aKruskal-Wallis test, Dunn's test for post-hoc analysis. bTwo-way analysis of variance, Sidak's test for multiple comparison, P < 0.05.
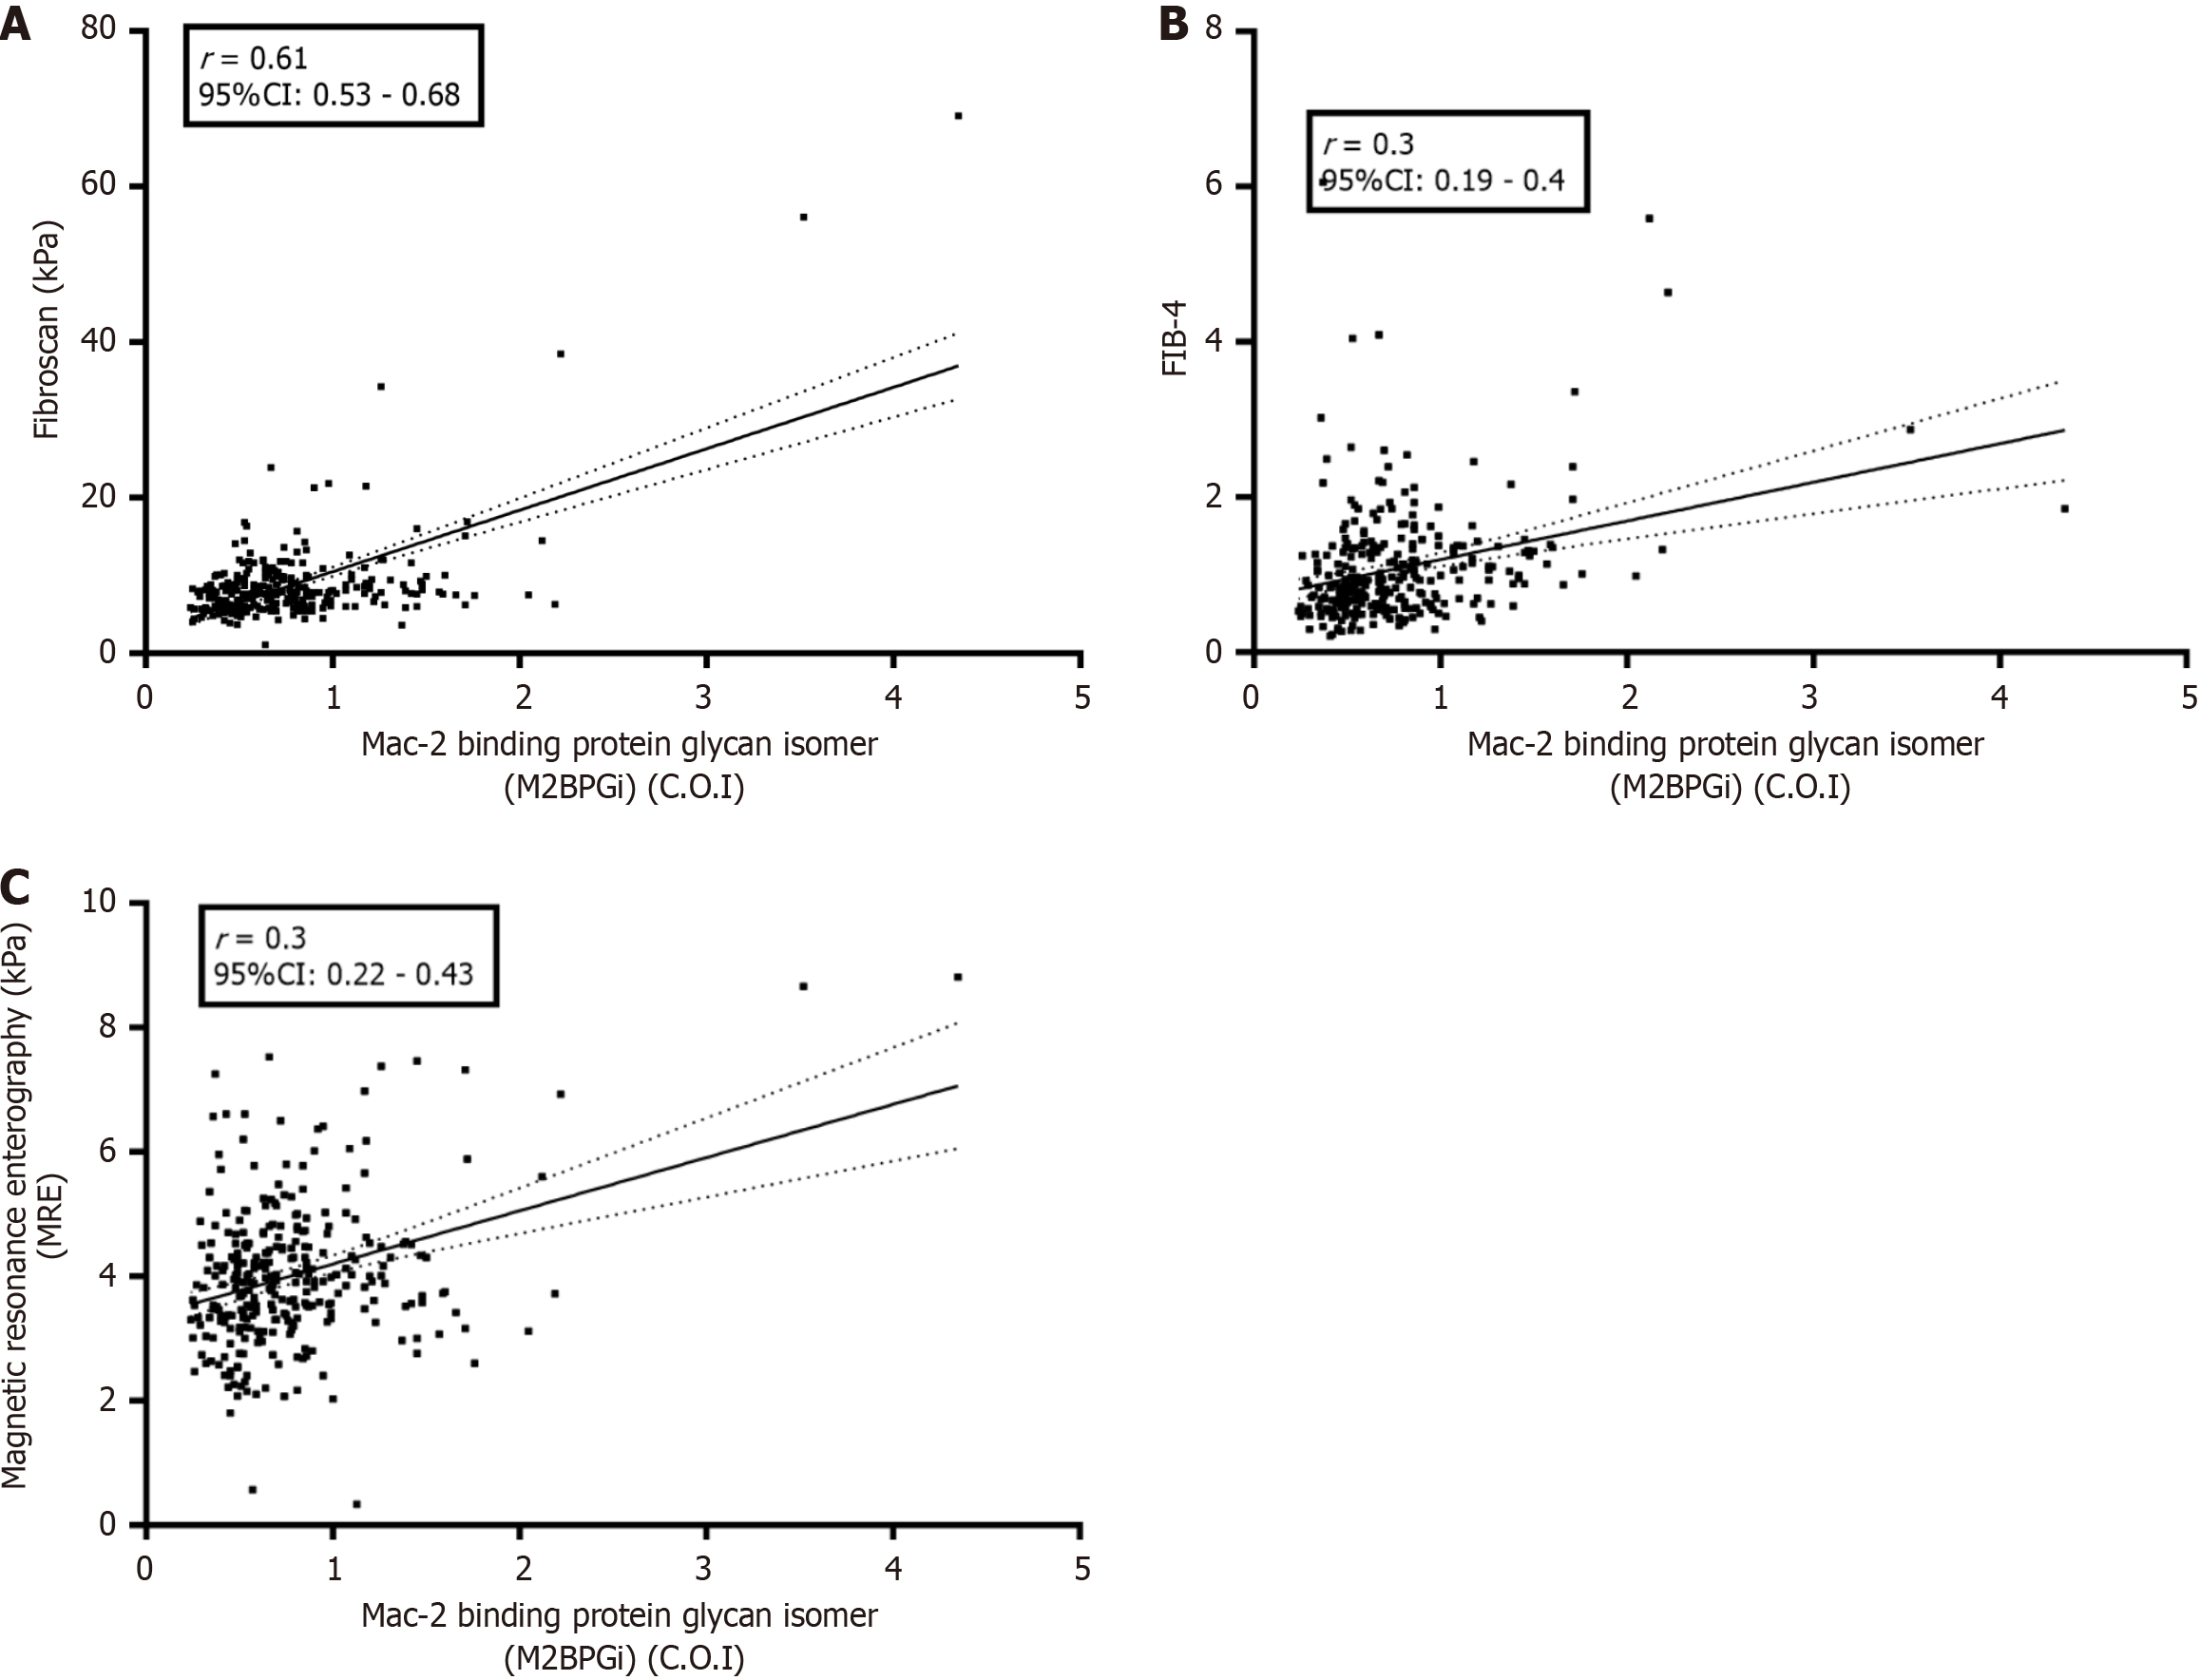
Figure 3 Correlation between mac-2 binding protein glycosylated isomer and major markers of liver fibrosis.
A: The correlation with FibroScan; B: The correlation found between mac-2 binding protein glycosylated isomer (M2BPGi) and the Fibrosis-4 Index score; C: The correlation between M2BPGi and magnetic resonance elastography. COI: Cut-off index; FIB-4: Fibrosis-4 Index; M2BPGi: Mac-2 binding protein glycosylated isomer; MRE: Magnetic resonance elastography.
- Citation: Pham TTT, Ho DT, Pham C, Phan H, Phu B, Nguyen T, Nguyen D, Phan HT, Nguyen KM. Role of mac-2 binding protein glycosylation isomer in predicting fibrosis in patients with metabolic dysfunction-associated steatotic liver disease. World J Hepatol 2025; 17(7): 106991
- URL: https://www.wjgnet.com/1948-5182/full/v17/i7/106991.htm
- DOI: https://dx.doi.org/10.4254/wjh.v17.i7.106991


