Copyright
©The Author(s) 2025.
World J Hepatol. Jul 27, 2025; 17(7): 106151
Published online Jul 27, 2025. doi: 10.4254/wjh.v17.i7.106151
Published online Jul 27, 2025. doi: 10.4254/wjh.v17.i7.106151
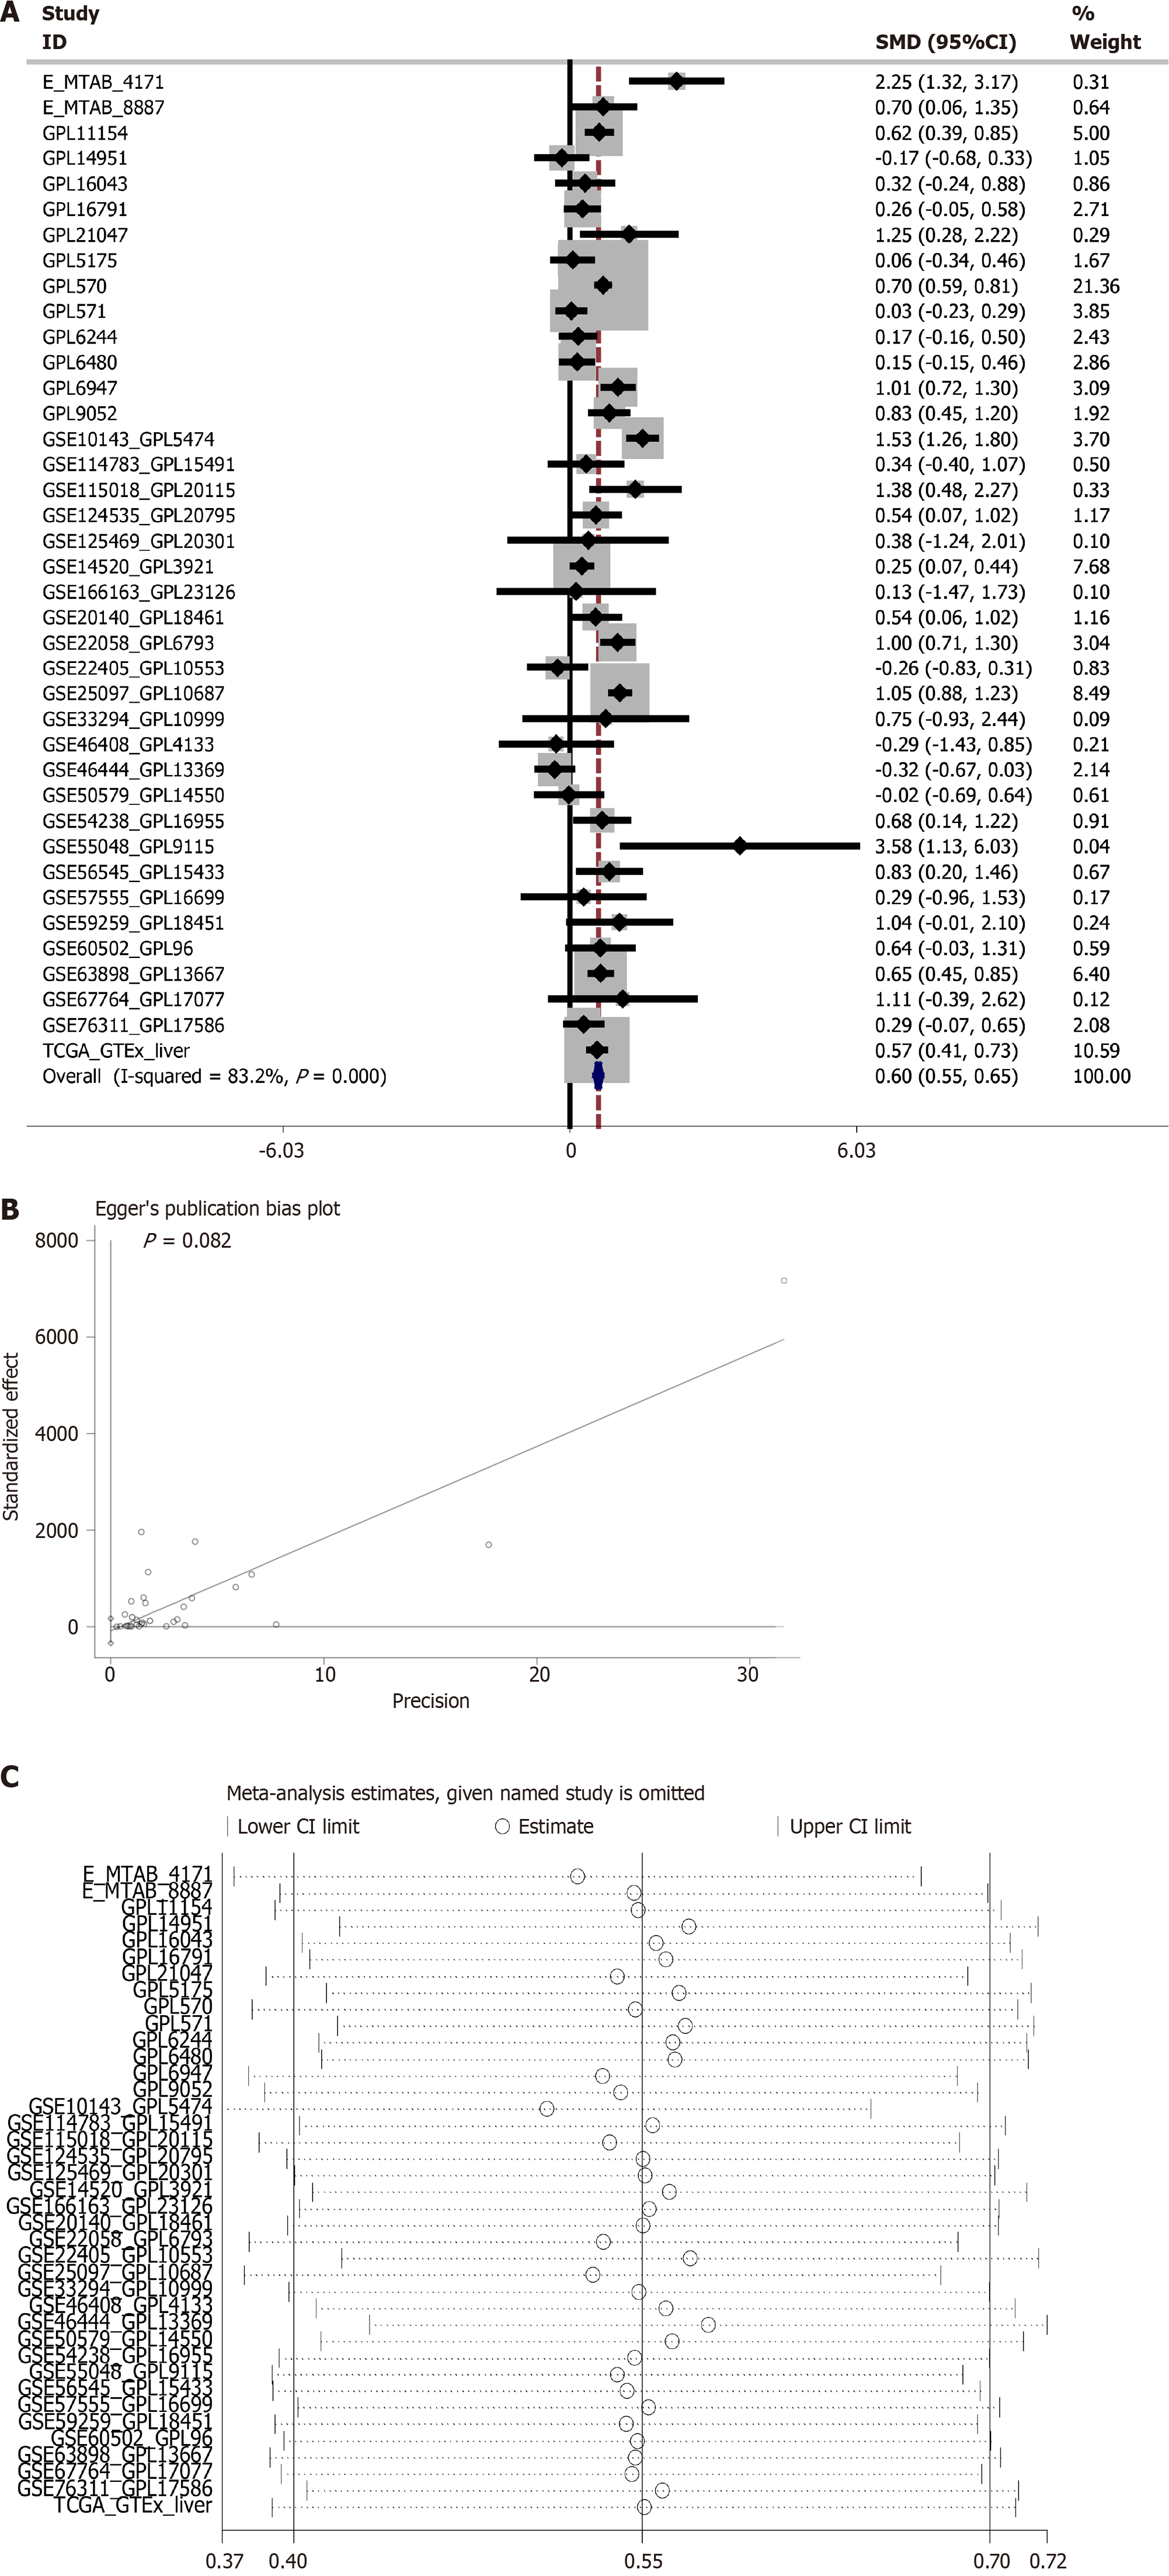
Figure 1 Meta-analysis of Rac family small GTPase 3 dysregulation in hepatocellular carcinoma using standardized mean difference.
A: Forest plot visualizing pooled standardized mean difference estimates across studies; B: Egger’s regression test for publication bias assessment; C: Leave-one-out sensitivity analysis of effect size stability.
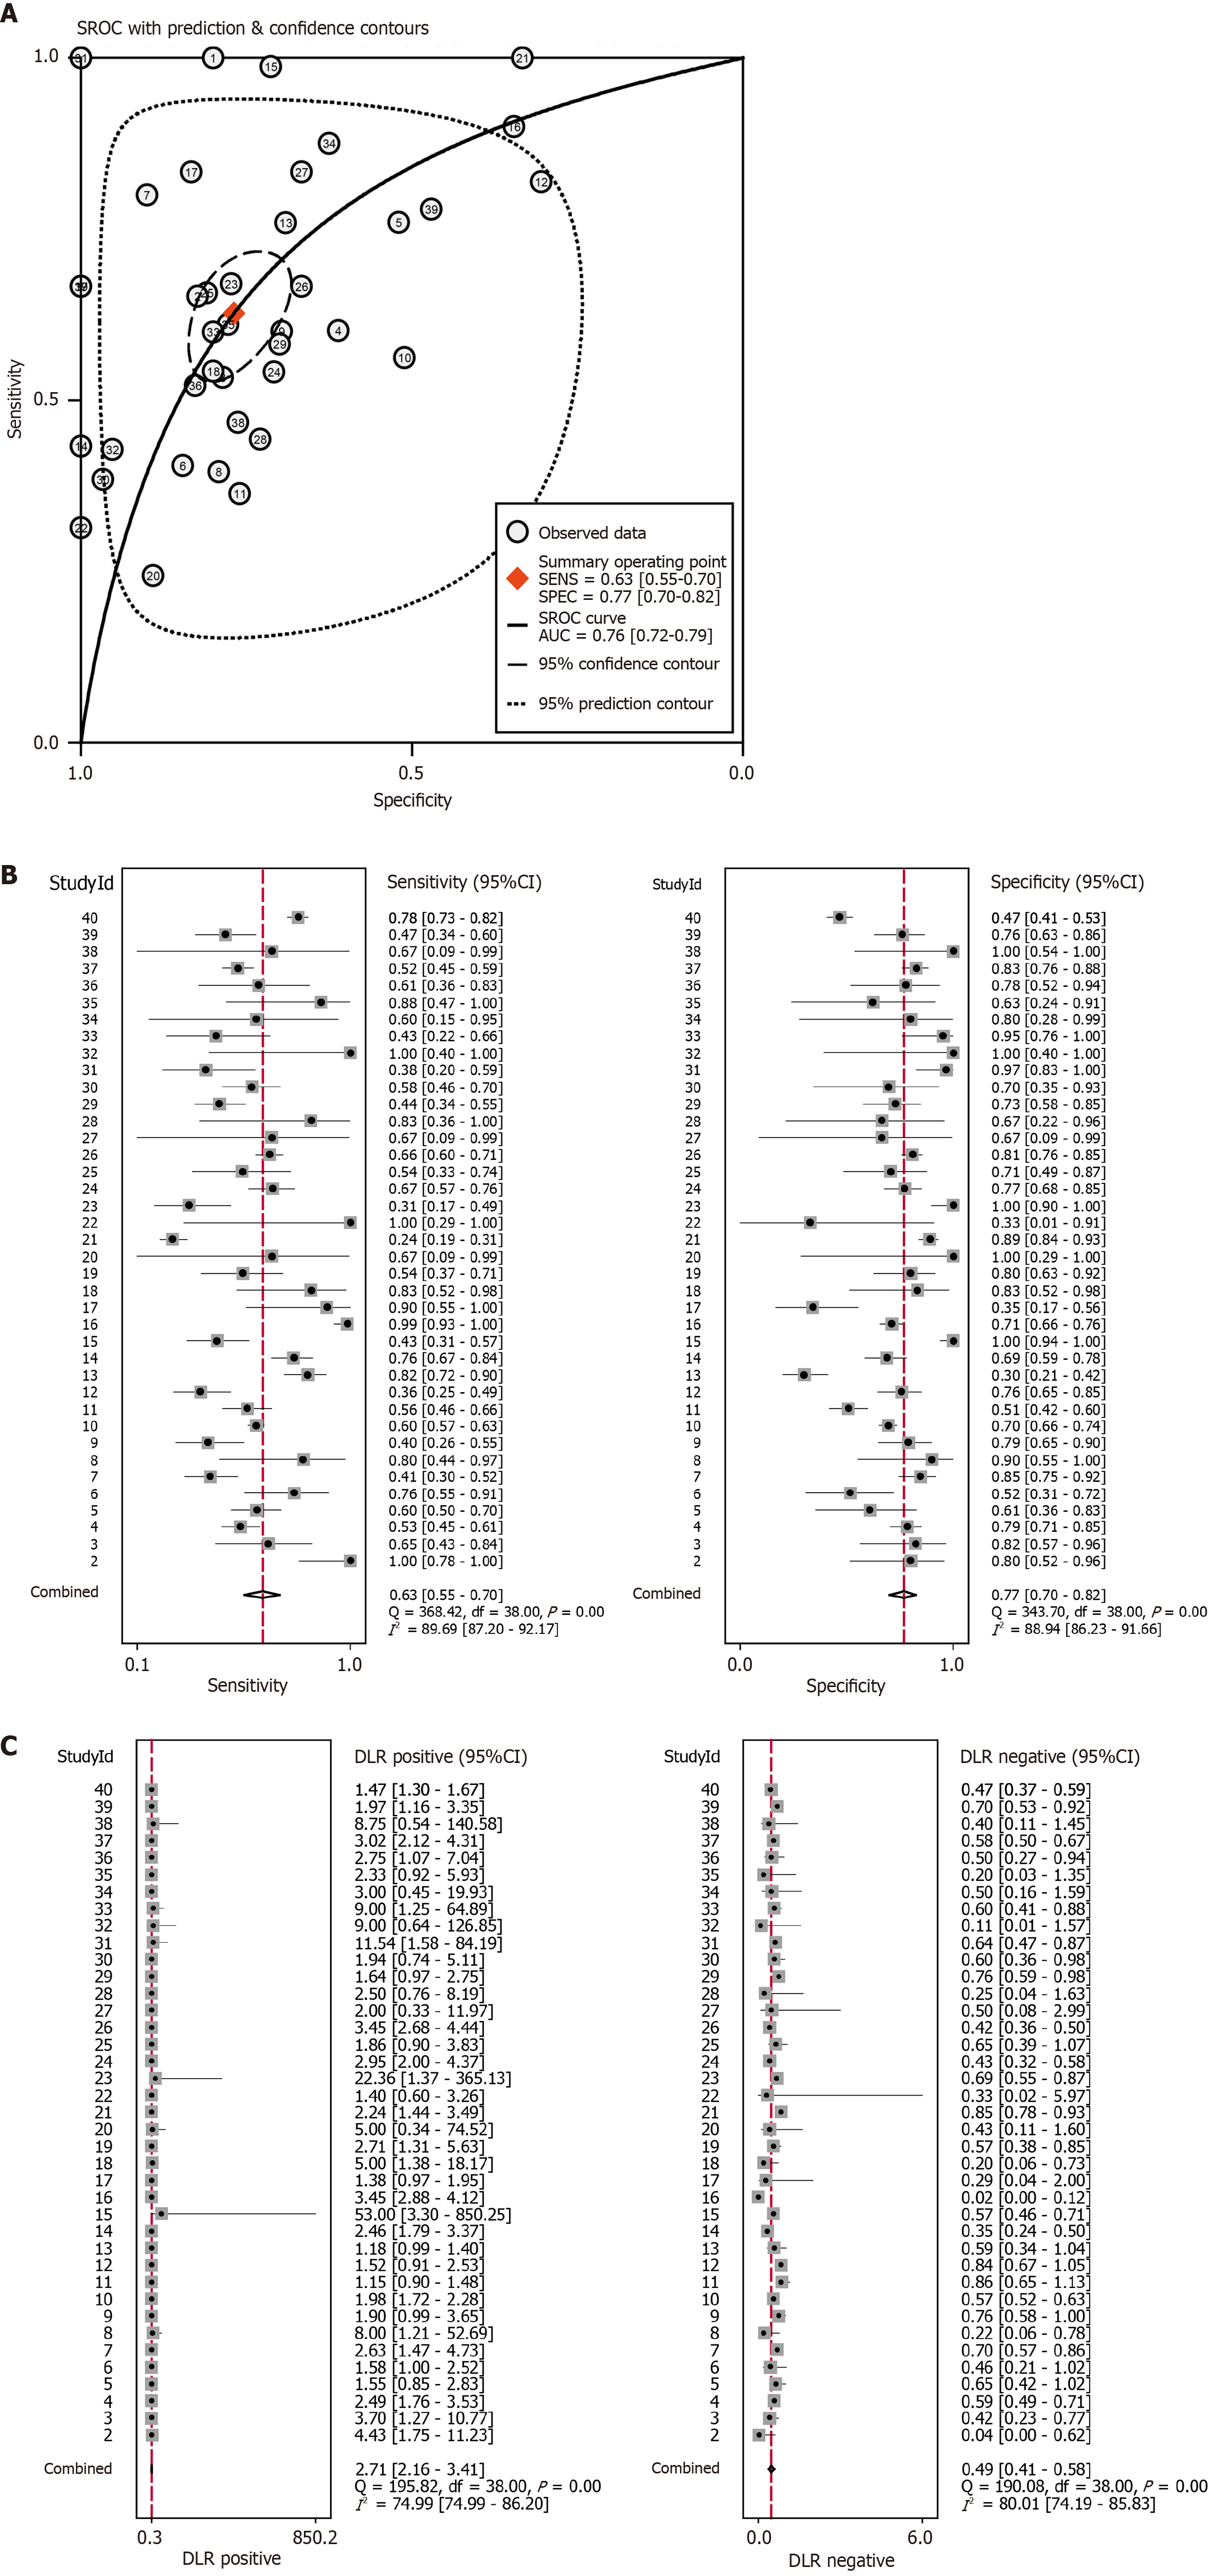
Figure 2 Diagnostic potential of Rac family small GTPase 3 for discriminating hepatocellular carcinoma from non-malignant liver conditions.
A: Summary receiver operating characteristic curve with area under curve estimation; B: Pooled sensitivity and specificity with 95%CI; C: Diagnostic likelihood ratios [positive likelihood ratio (LR) and negative LR] across included studies. AUC: Area under curve; SROC: Summary receiver operating characteristic.
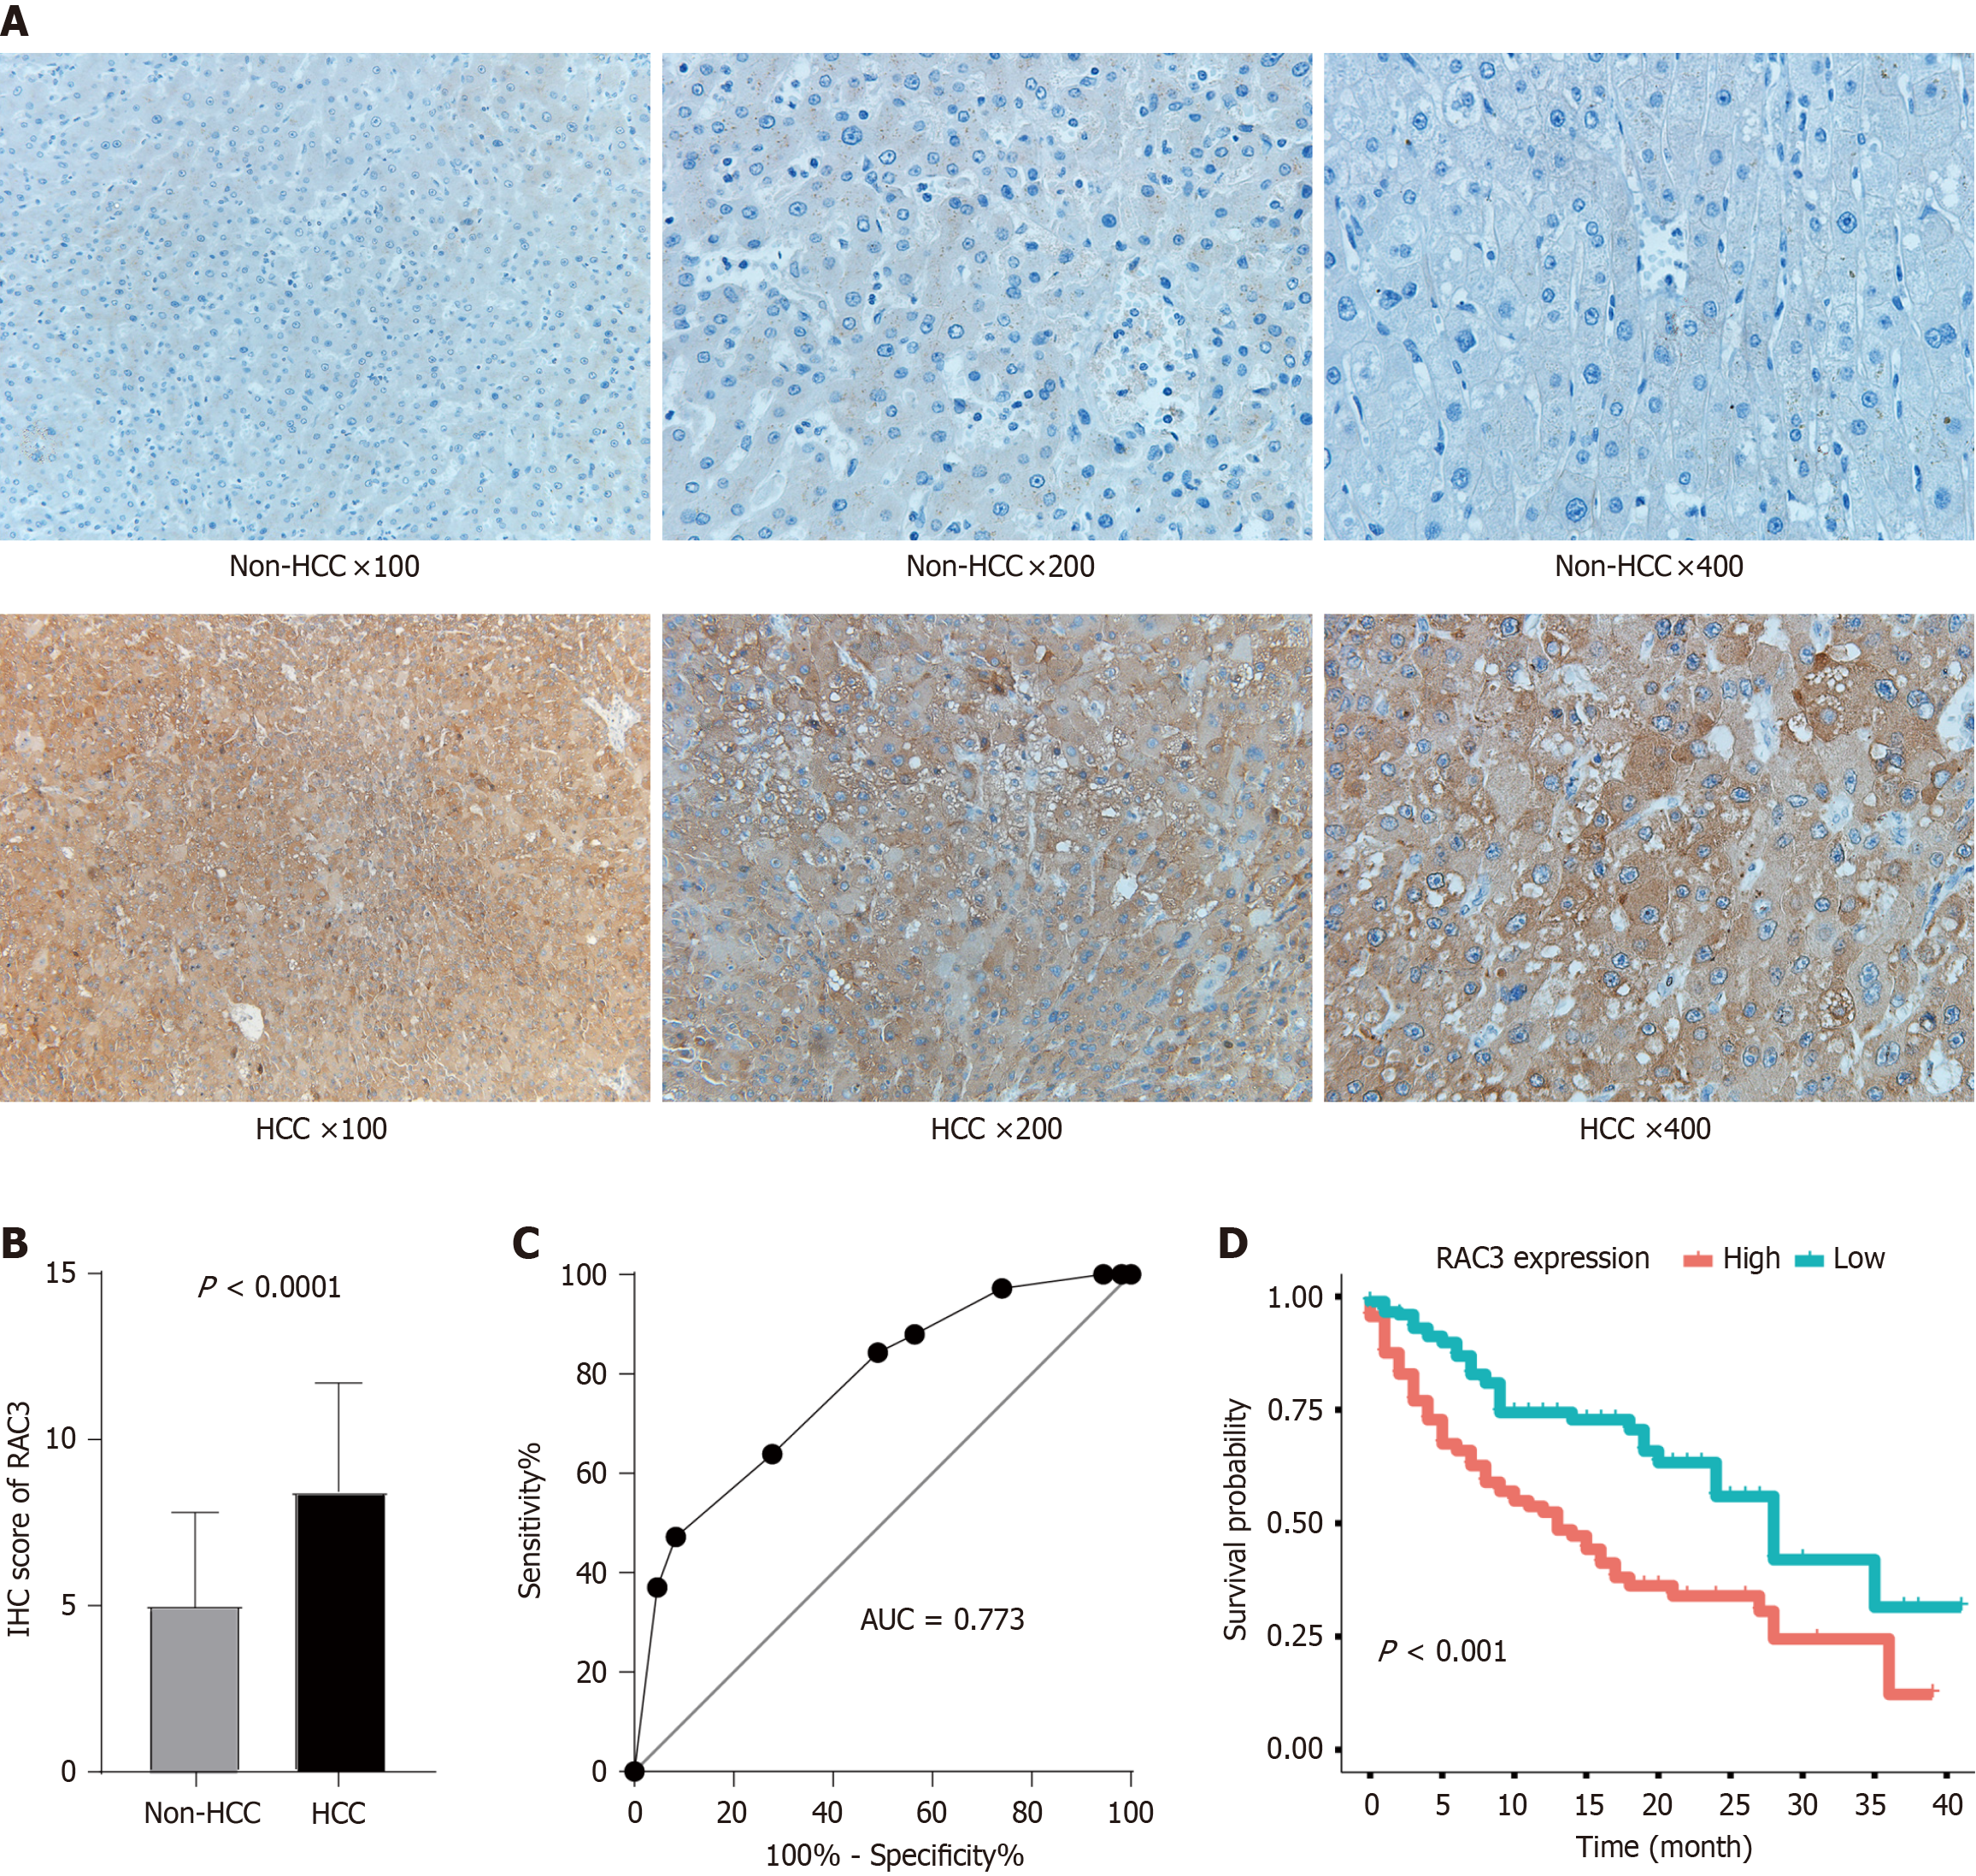
Figure 3 Clinical relevance of Rac family small GTPase 3 dysregulation in hepatocellular carcinoma.
A: Representative immunohistochemical (IHC) staining demonstrating differential Rac family small GTPase 3 (RAC3) expression between hepatocellular carcinoma and adjacent non-tumorous liver tissues; B: Quantitative comparison of IHC H-scores in matched tumor-normal pairs (P < 0.001, paired t-test); C: Diagnostic performance evaluation using receiver operating characteristic curve analysis (area under curve = 0.82, 95%CI: 0.76–0.89); D: Kaplan–Meier survival curves stratified by RAC3 expression levels with clinicopathological correlations. AUC: Area under curve; HCC: Hepatocellular carcinoma; RAC3: Rac family small GTPase 3.
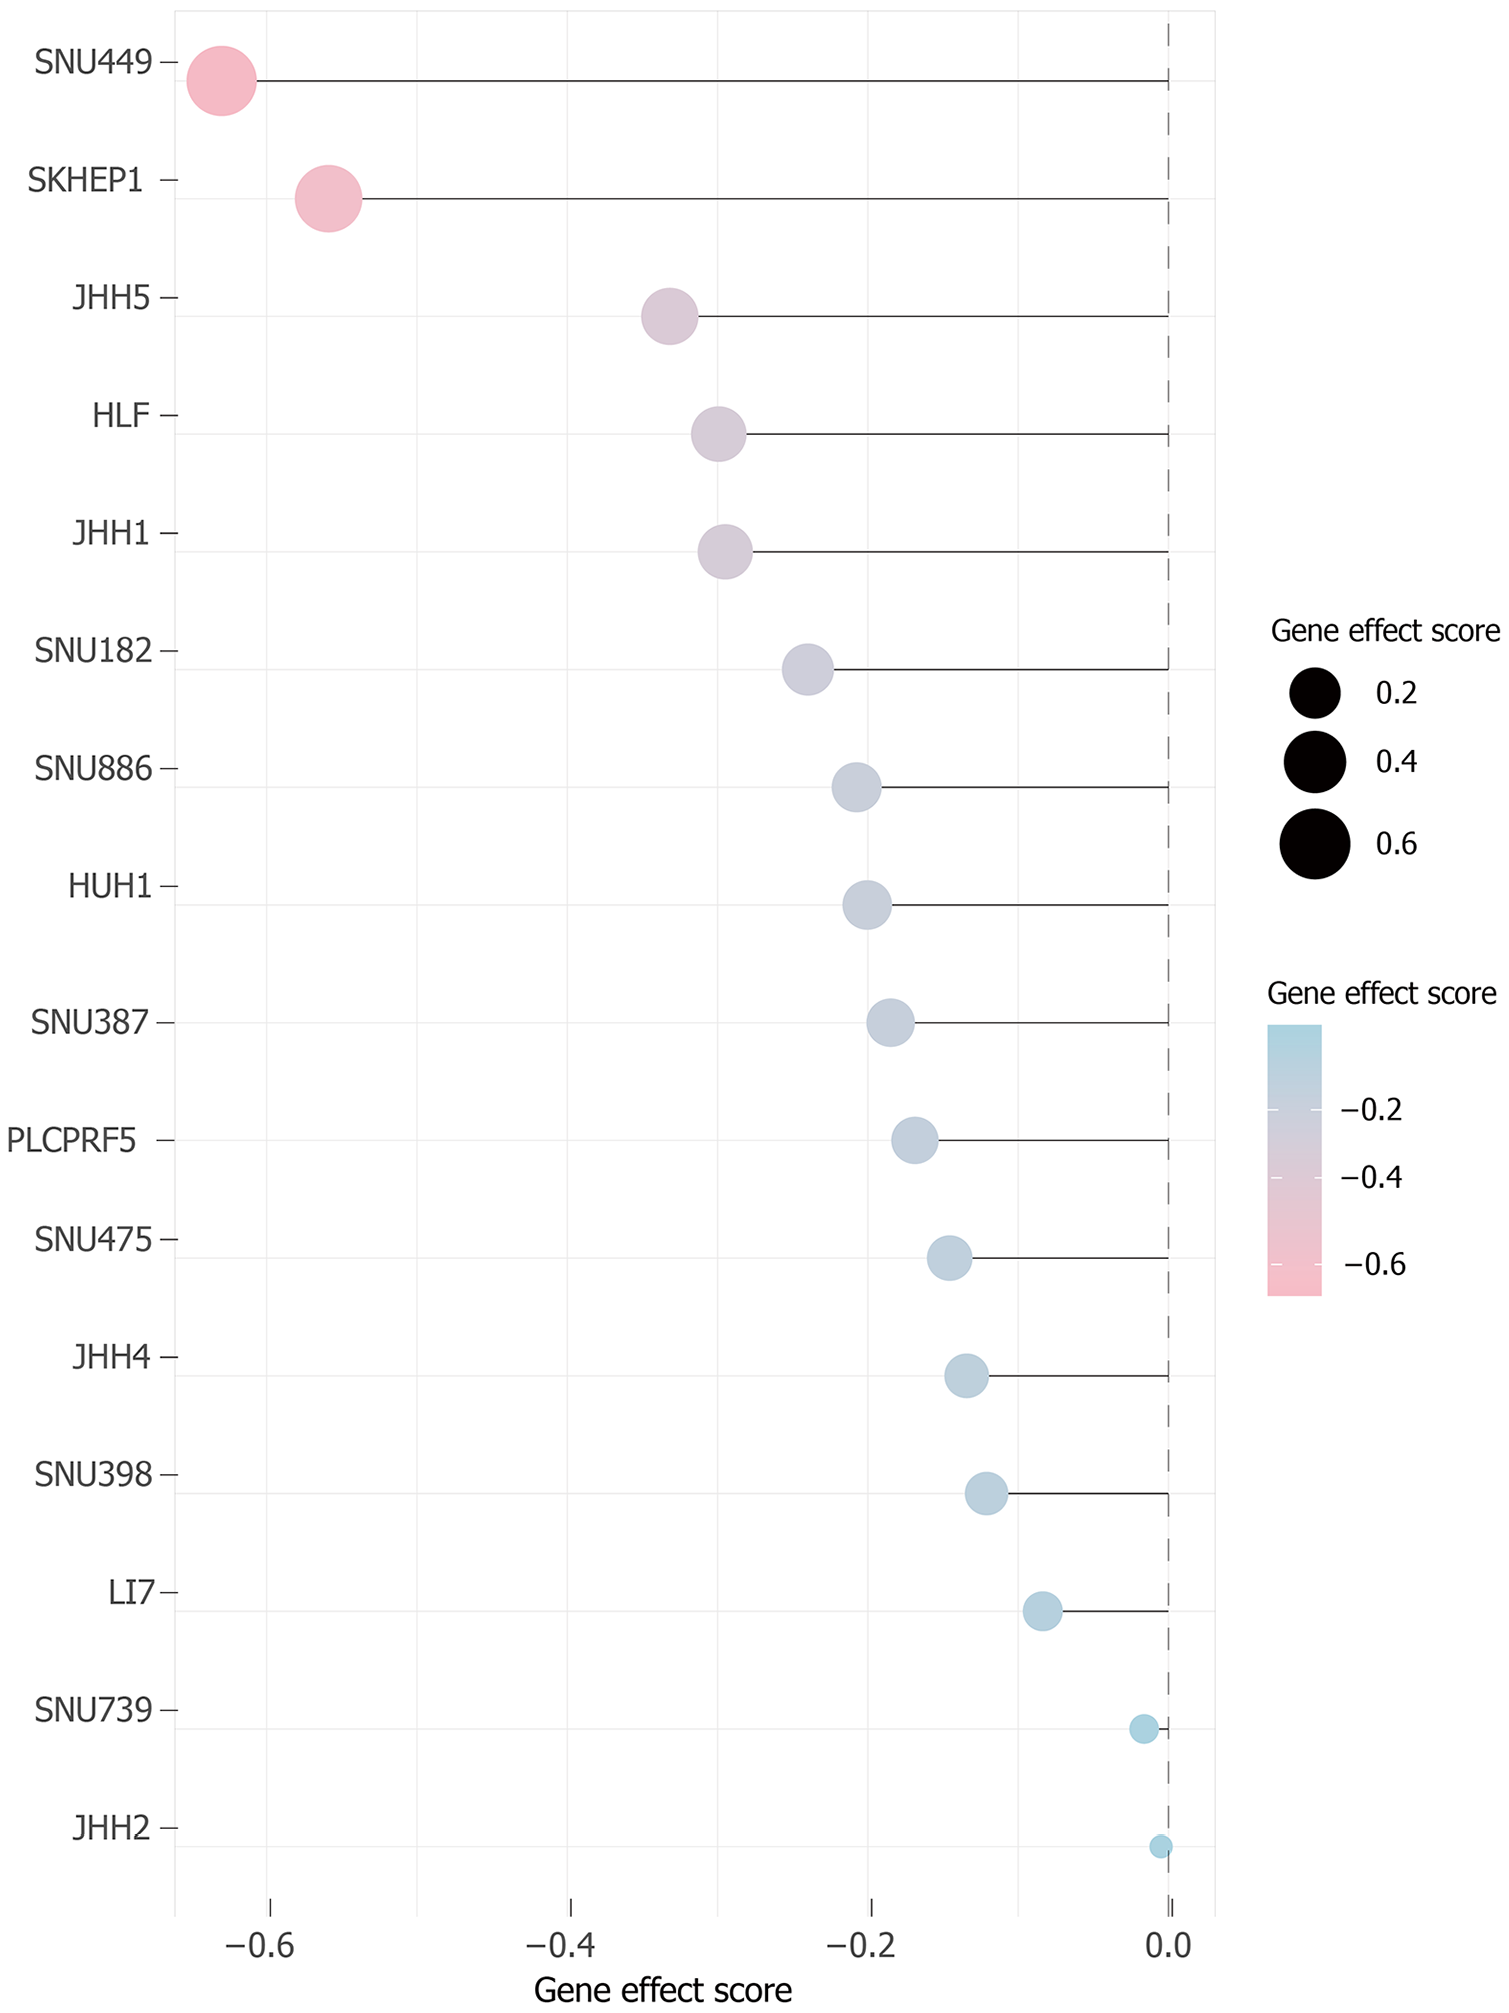
Figure 4
Functional genomic profiling identifies Rac family small GTPase 3 as a pro-growth dependency in hepatocellular carcinoma.
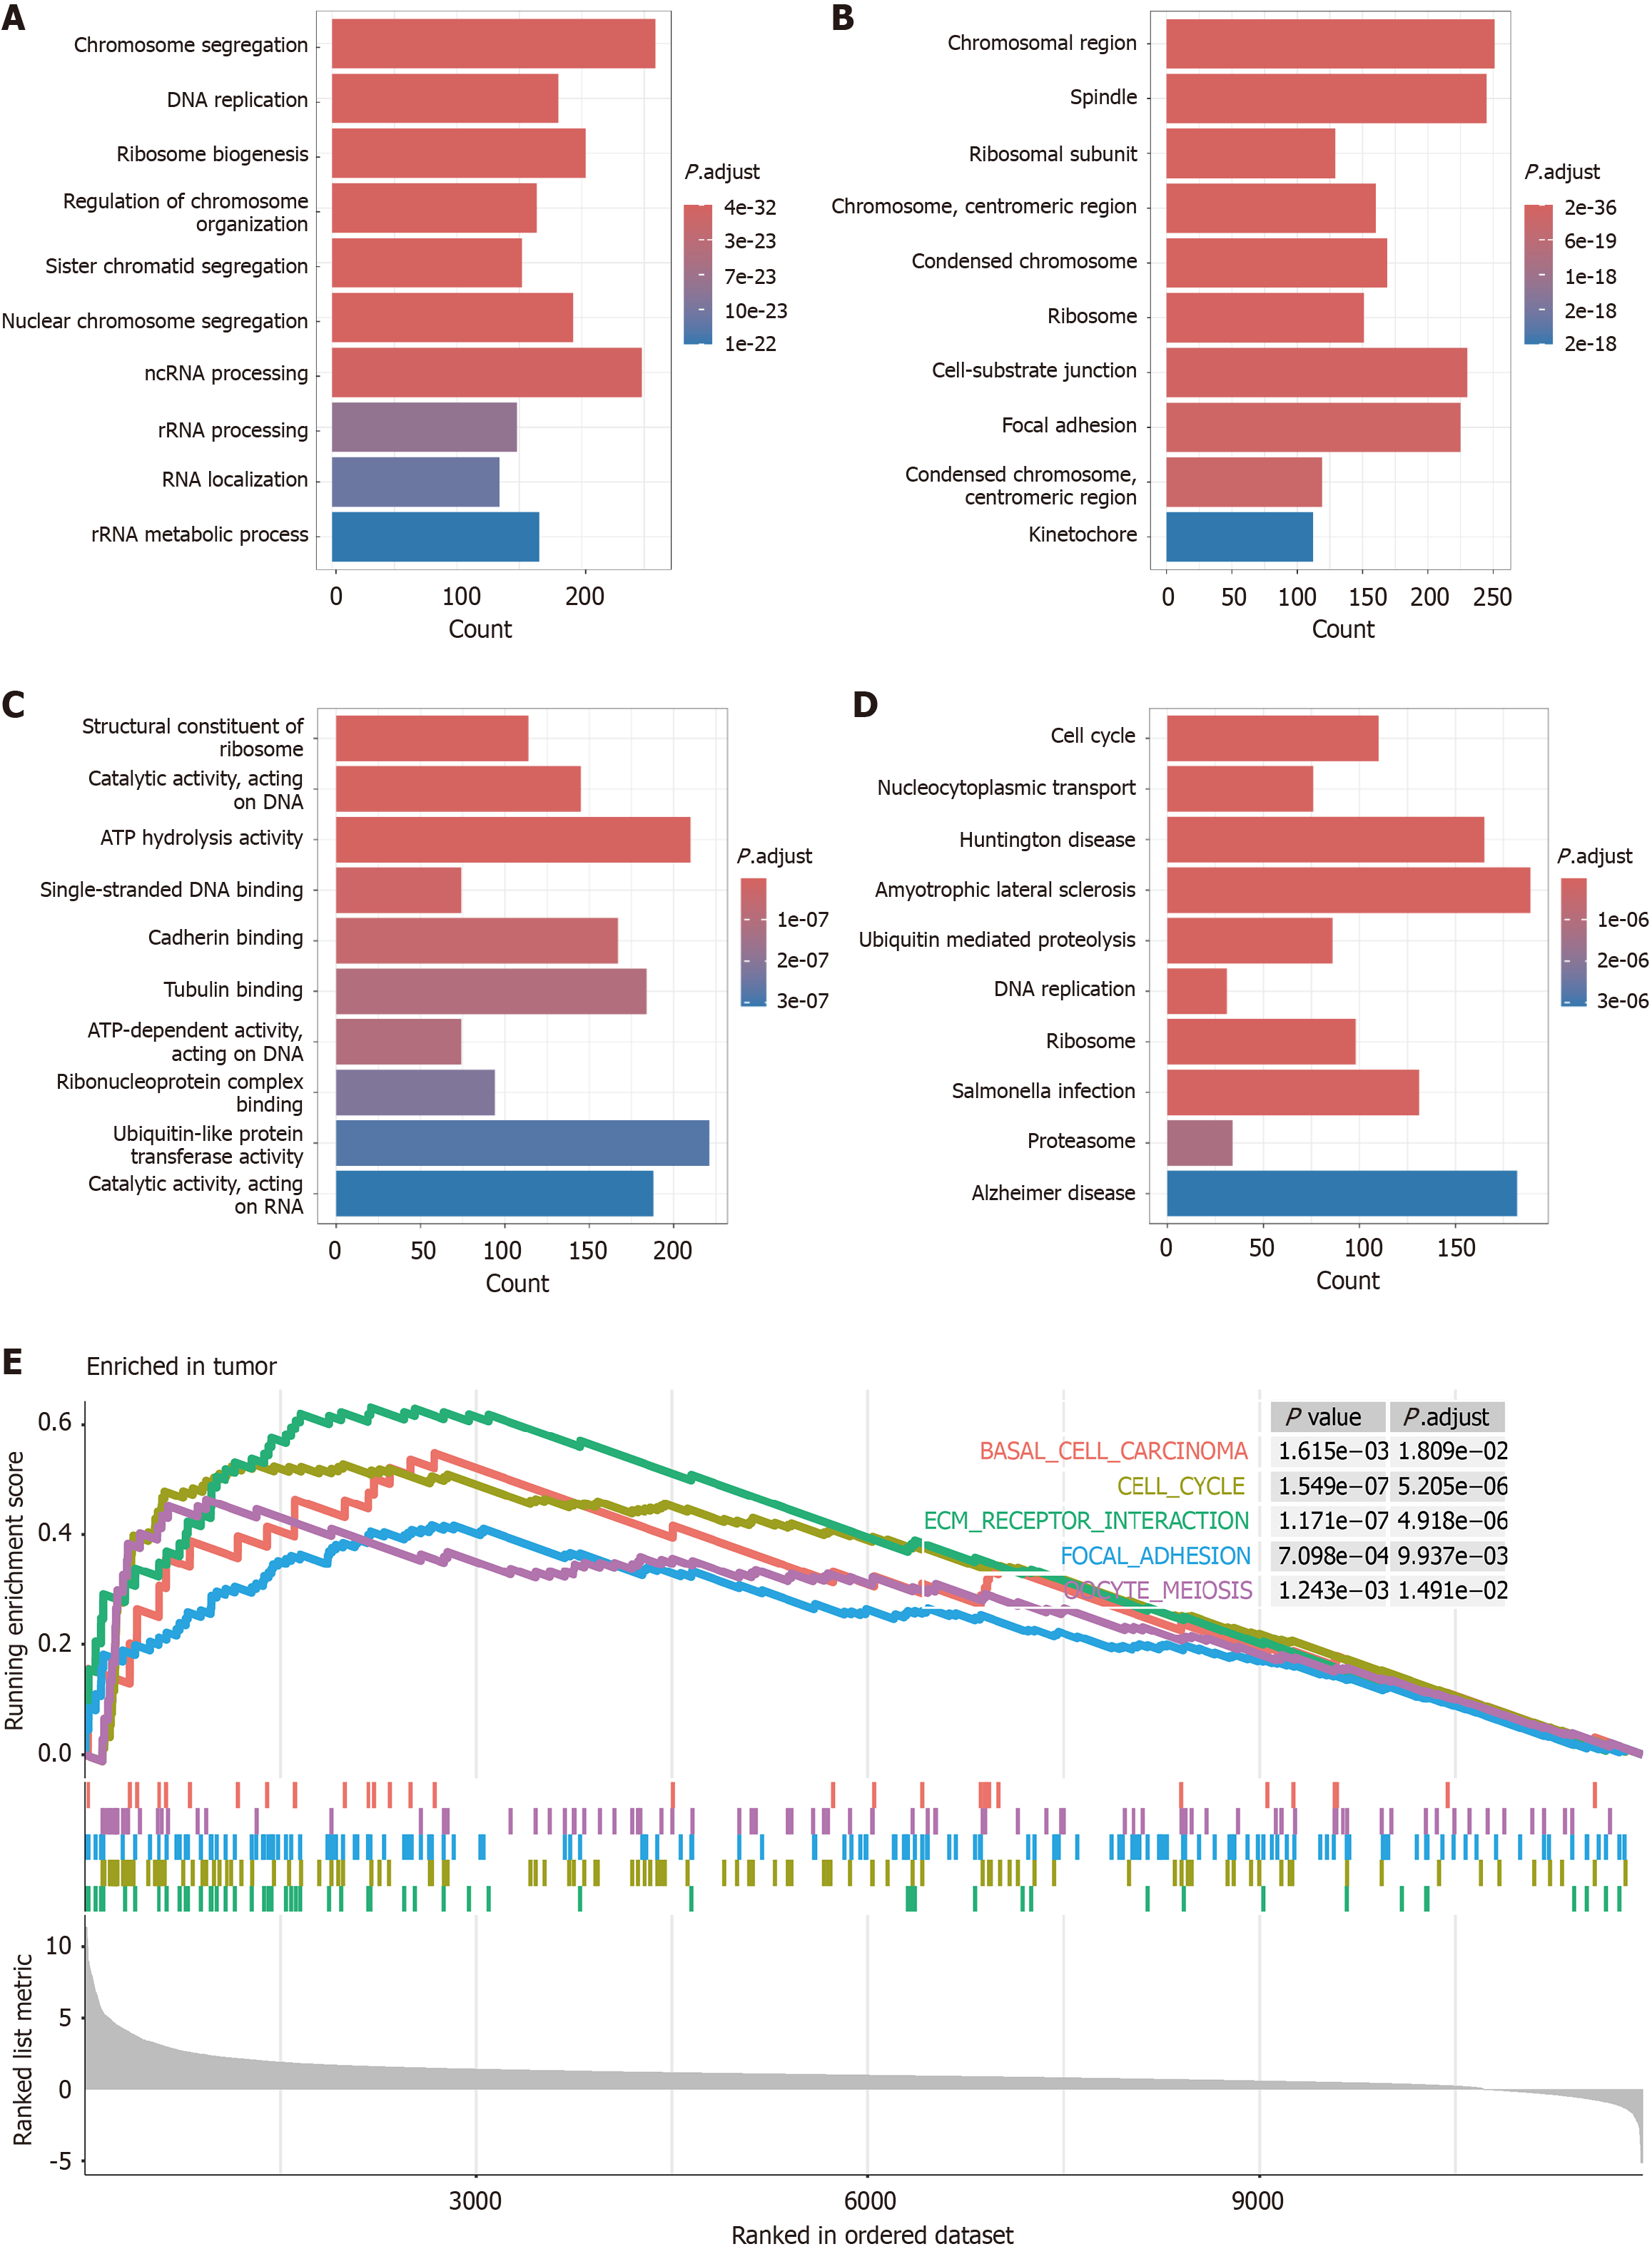
Figure 5 Functional convergence of Rac family small GTPase 3-coexpressed genes with hepatocellular carcinoma-upregulated transcripts: A multi-layer enrichment landscape.
A: Gene Ontology enrichment: Biological processes; B: Cellular component localization; C: Molecular function annotation; D: Kyoto Encyclopedia of Genes and Genomes pathway topology; E: Gene set enrichment analysis of hepatocellular carcinoma-related pathway activation.
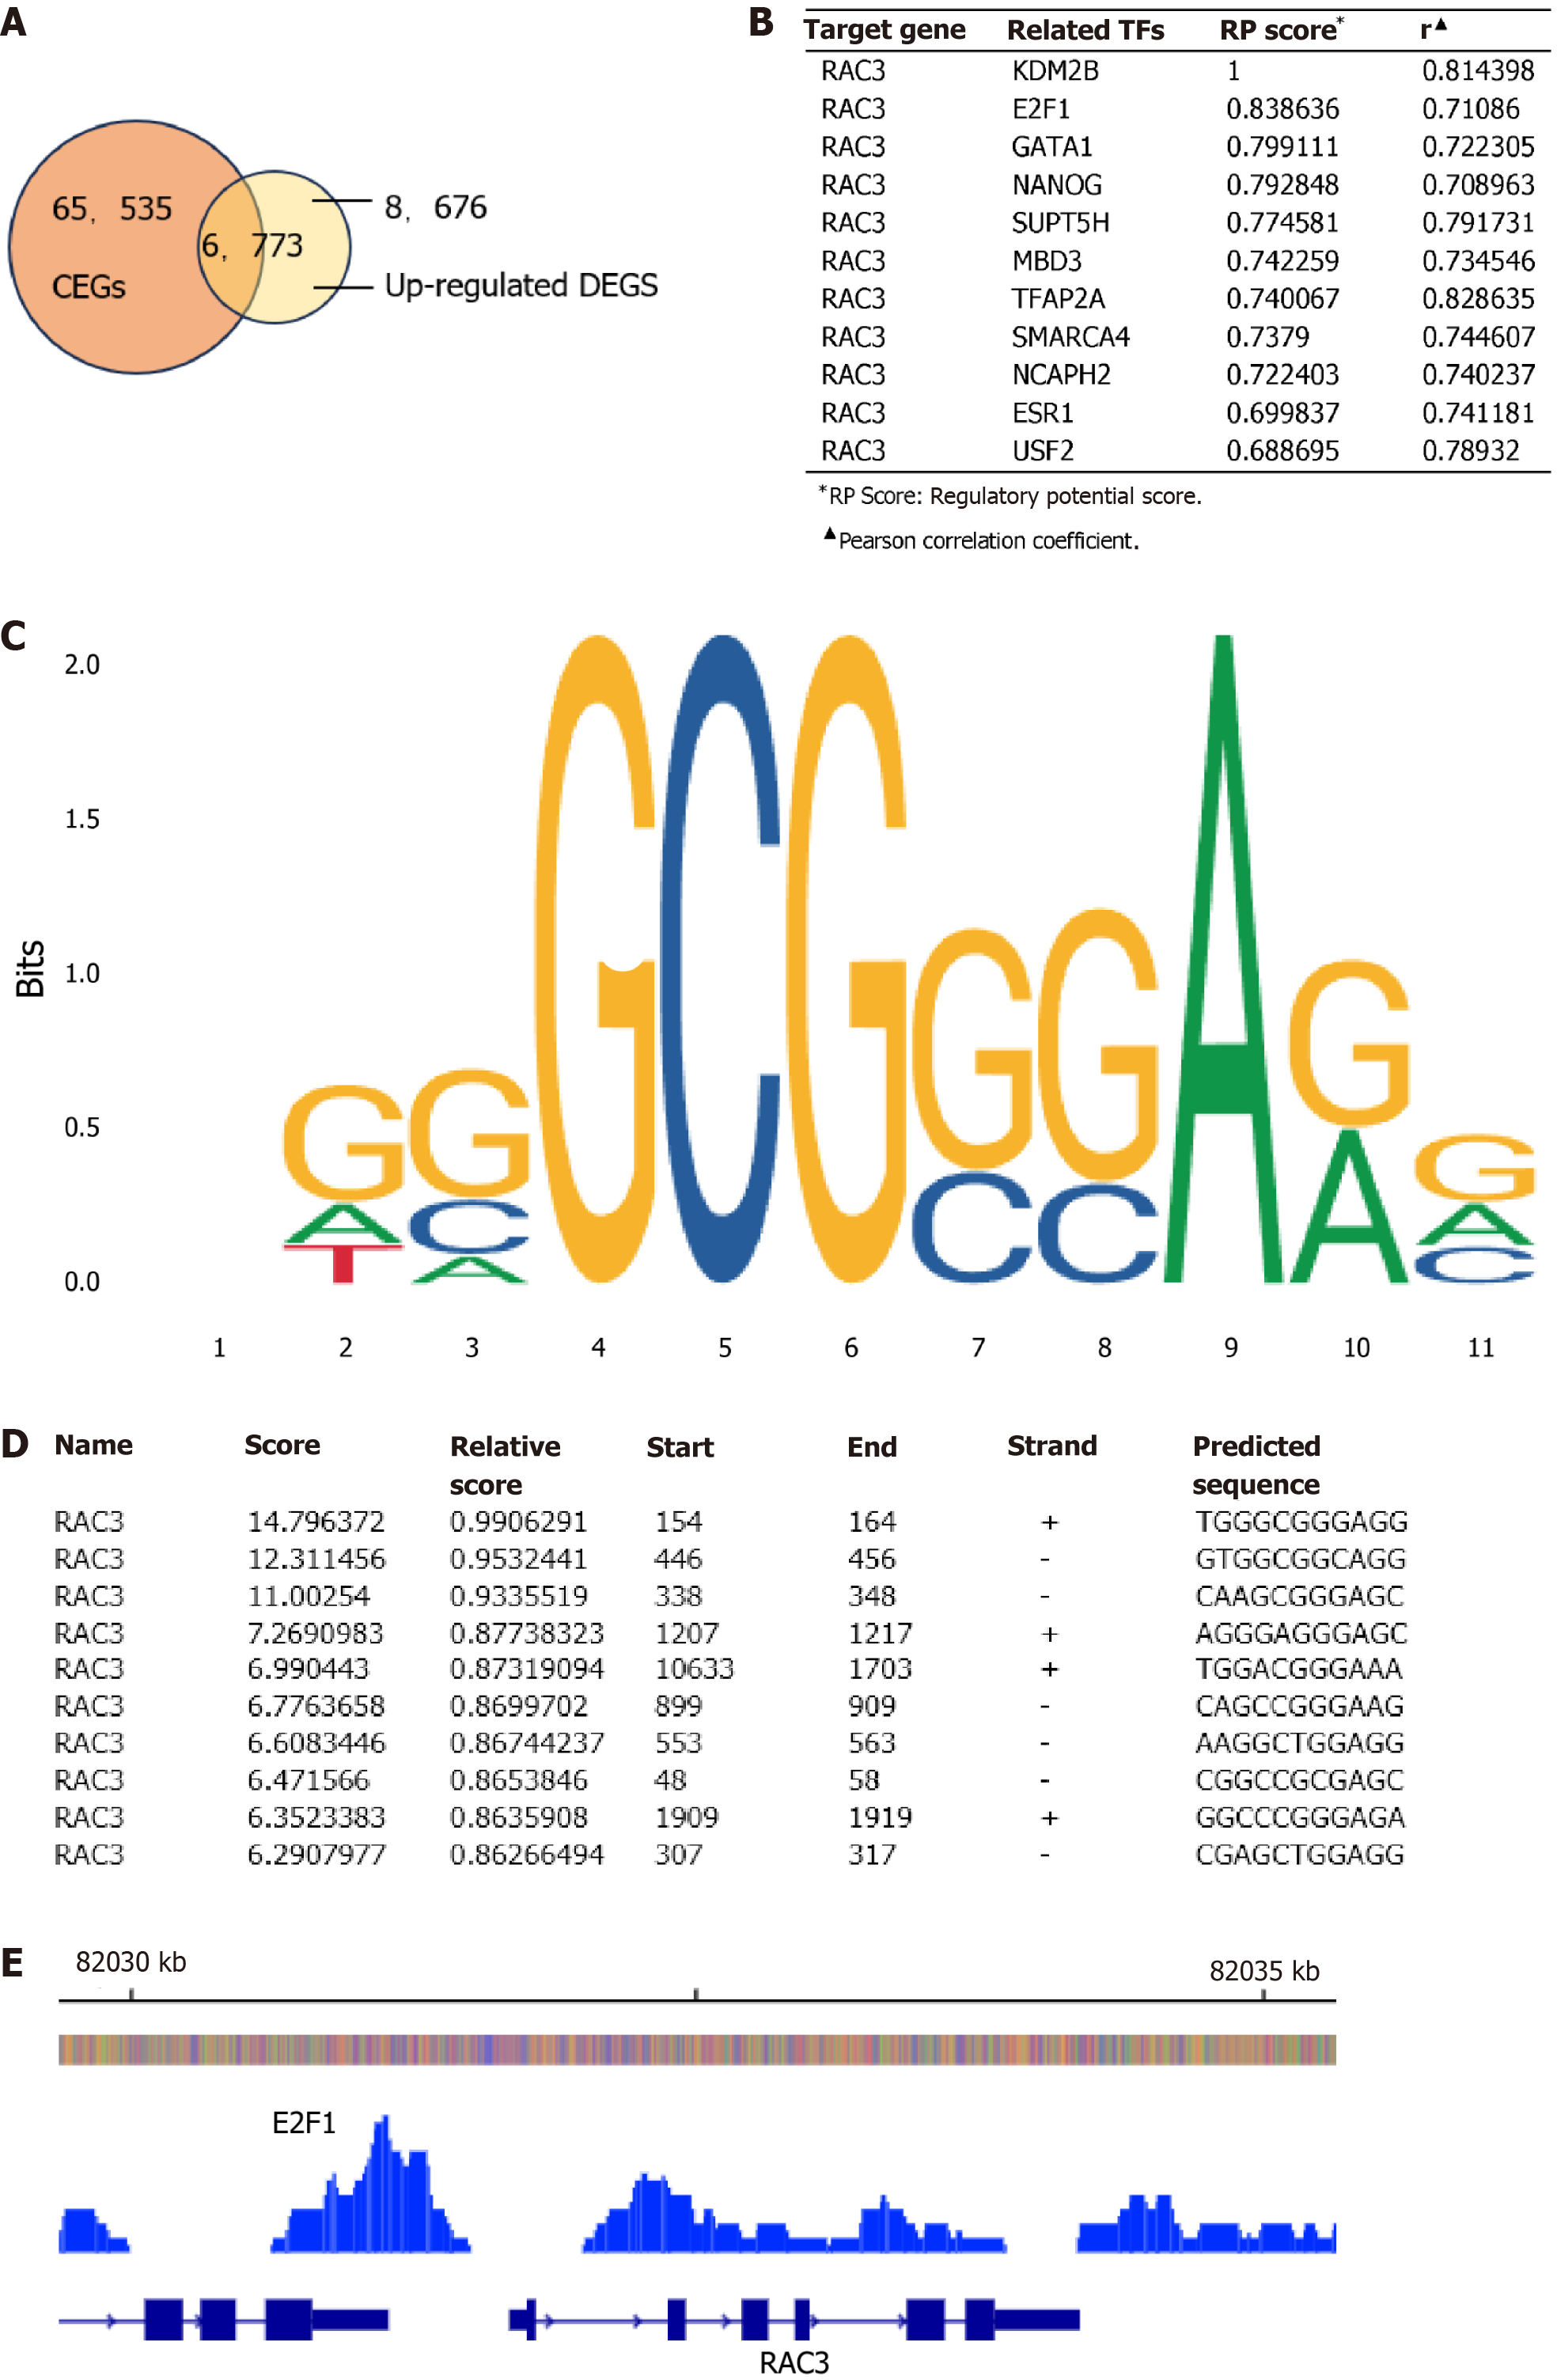
Figure 6 E2F transcription factor 1 activates Rac family small GTPase 3 transcription by binding to the Rac family small GTPase 3 promoter region.
A: Intersection Venn diagram of Rac family small GTPase 3 (RAC3)-associated upregulated genes and related transcription factors (TFs); B: Target gene RAC3 and its related TFs (it was sourced from the hTFtarget database); C and D: The binding site of E2F transcription factor 1 (E2F1) in the promoter region of RAC3 and the ten predominant binding sequences (they were obtained from JASPAR); E: E2F1 binding peak in the translation initiation region of RAC3 [it was derived from integrated analyses using Cistrome DB and Integrative Genomics Viewer (IGV v3.0.1)]. CEGs: Co-expressed genes; RAC3: Rac family small GTPase 3; RP: Regulatory potential.
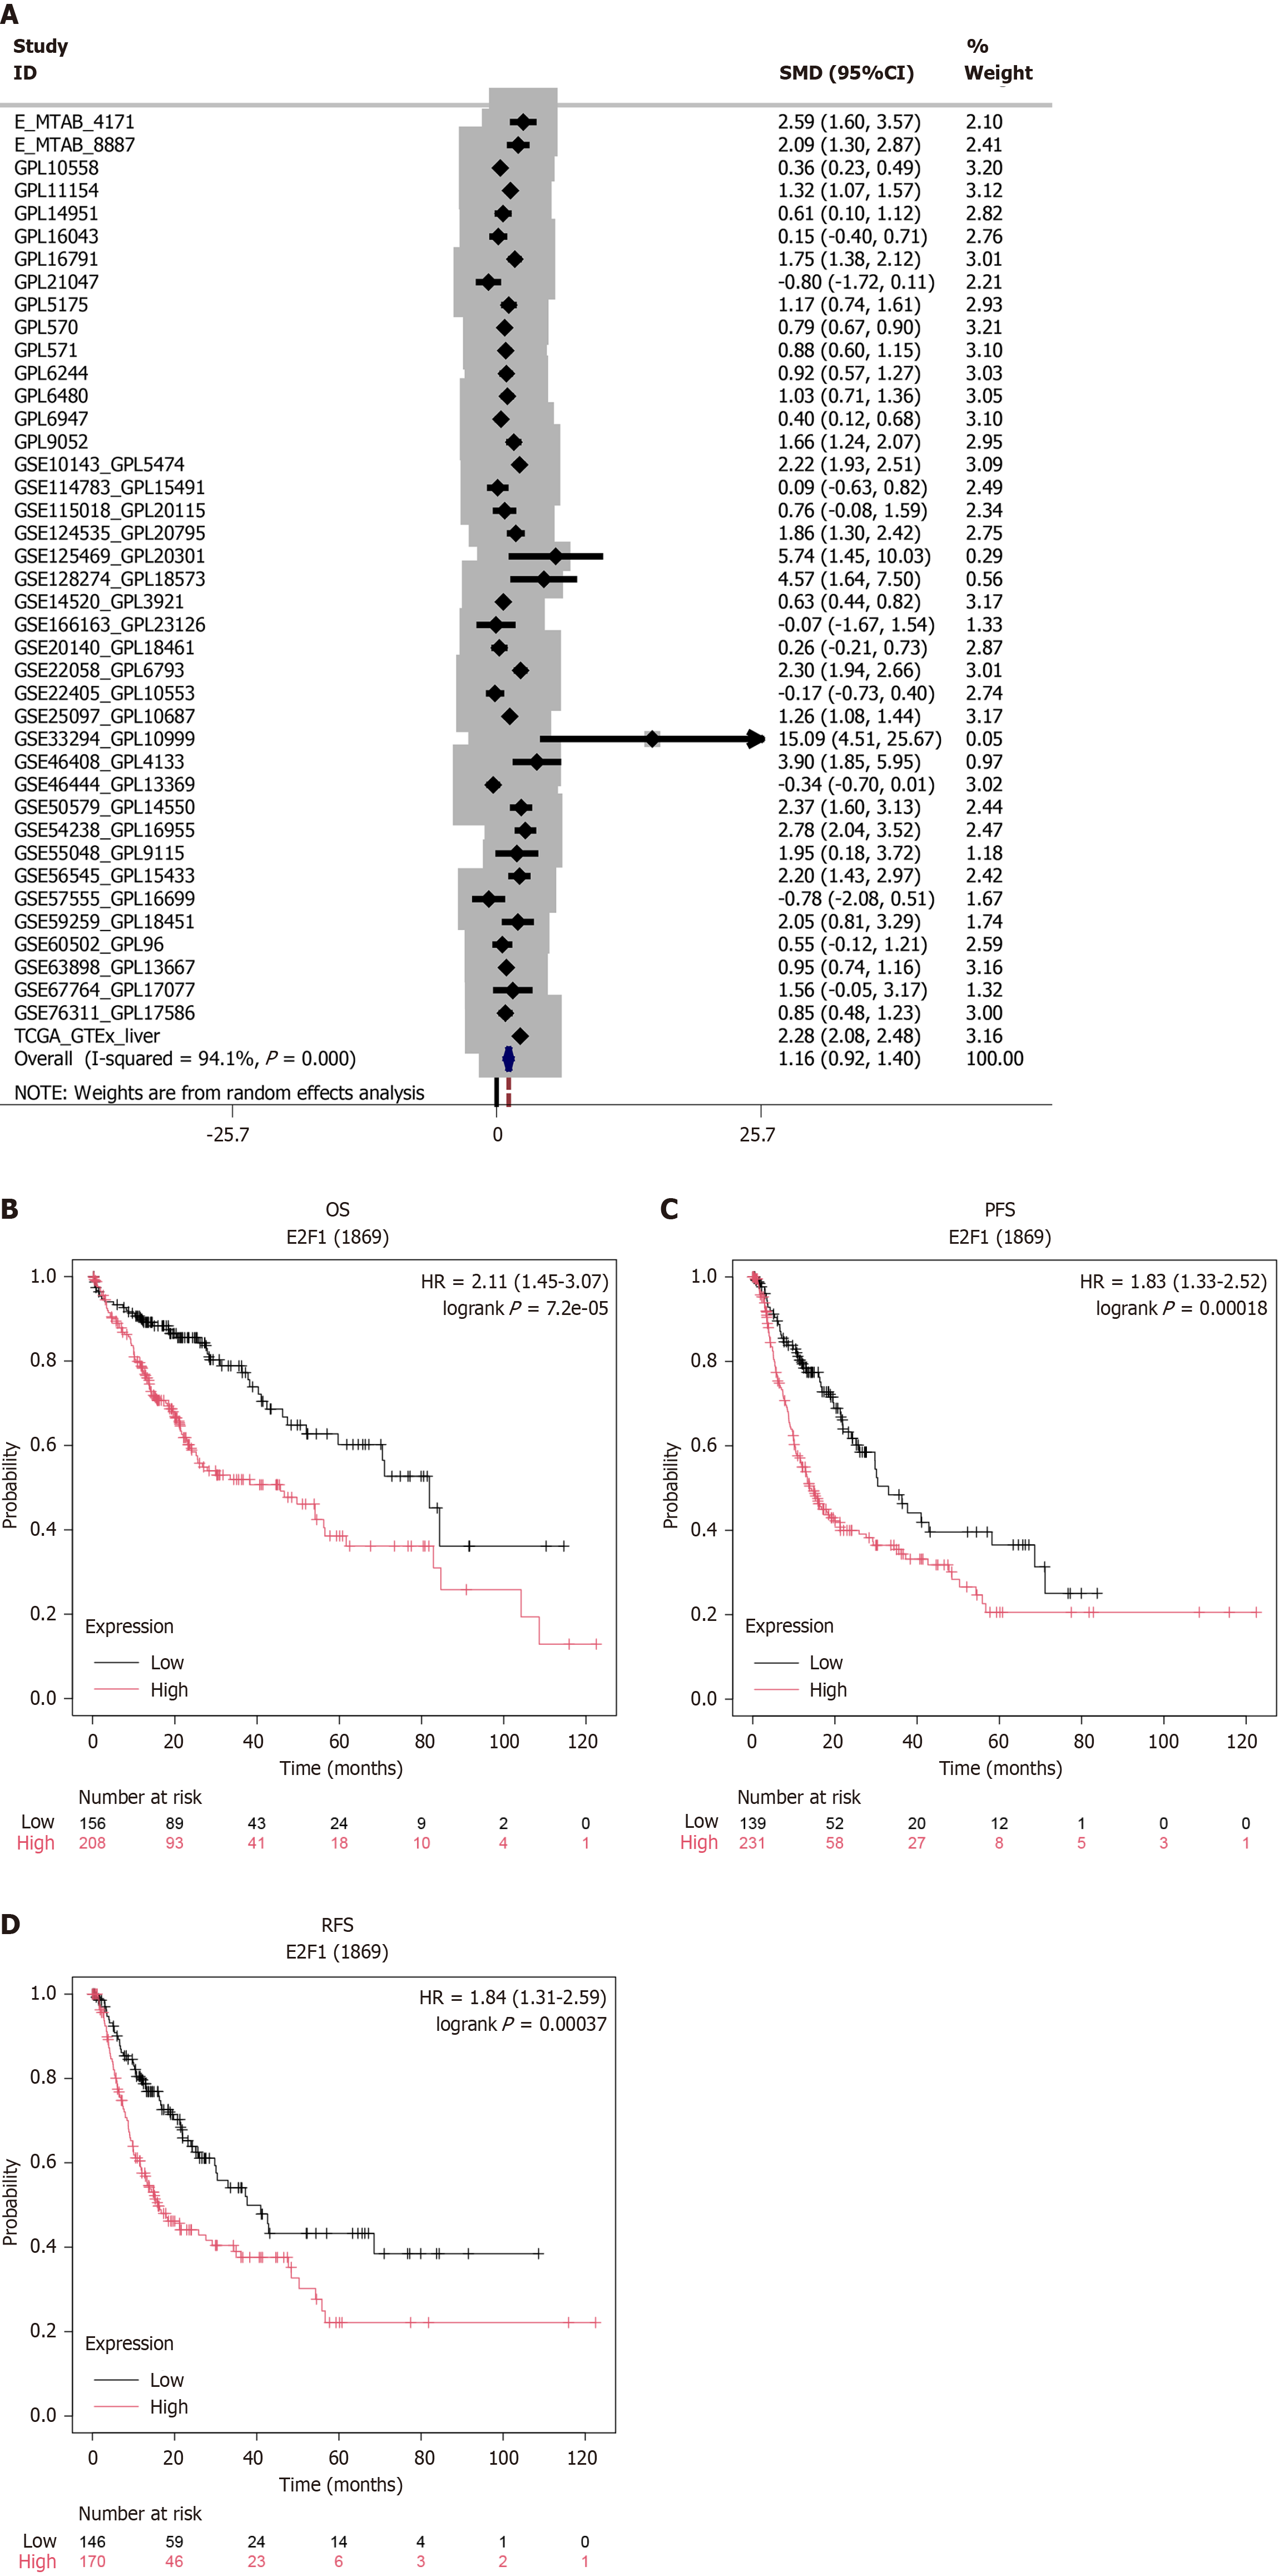
Figure 7 Clinical significance of E2F transcription factor 1 dysregulation in hepatocellular carcinoma: Expression patterns and survival implications.
A: Transcriptional overexpression of E2F transcription factor 1 (E2F1) mRNA in hepatocellular carcinoma vs non-tumorous liver tissues; B–D: Prognostic stratification using Kaplan–Meier Plotter survival analytics including overall survival, progression-free survival, recurrence-free survival (log-rank P < 0.01). E2F1: E2F transcription factor 1; OS: Overall survival; PFS: Progression-free survival; RFS: Recurrence-free survival.
- Citation: Liu R, Li JC, Li SD, Li JD, He RQ, Chen G, Feng ZB, Wei JL. Deciphering the oncogenic role of Rac family small GTPase 3 in hepatocellular carcinoma through multiomics integration. World J Hepatol 2025; 17(7): 106151
- URL: https://www.wjgnet.com/1948-5182/full/v17/i7/106151.htm
- DOI: https://dx.doi.org/10.4254/wjh.v17.i7.106151


