Copyright
©The Author(s) 2025.
World J Hepatol. Feb 27, 2025; 17(2): 99292
Published online Feb 27, 2025. doi: 10.4254/wjh.v17.i2.99292
Published online Feb 27, 2025. doi: 10.4254/wjh.v17.i2.99292
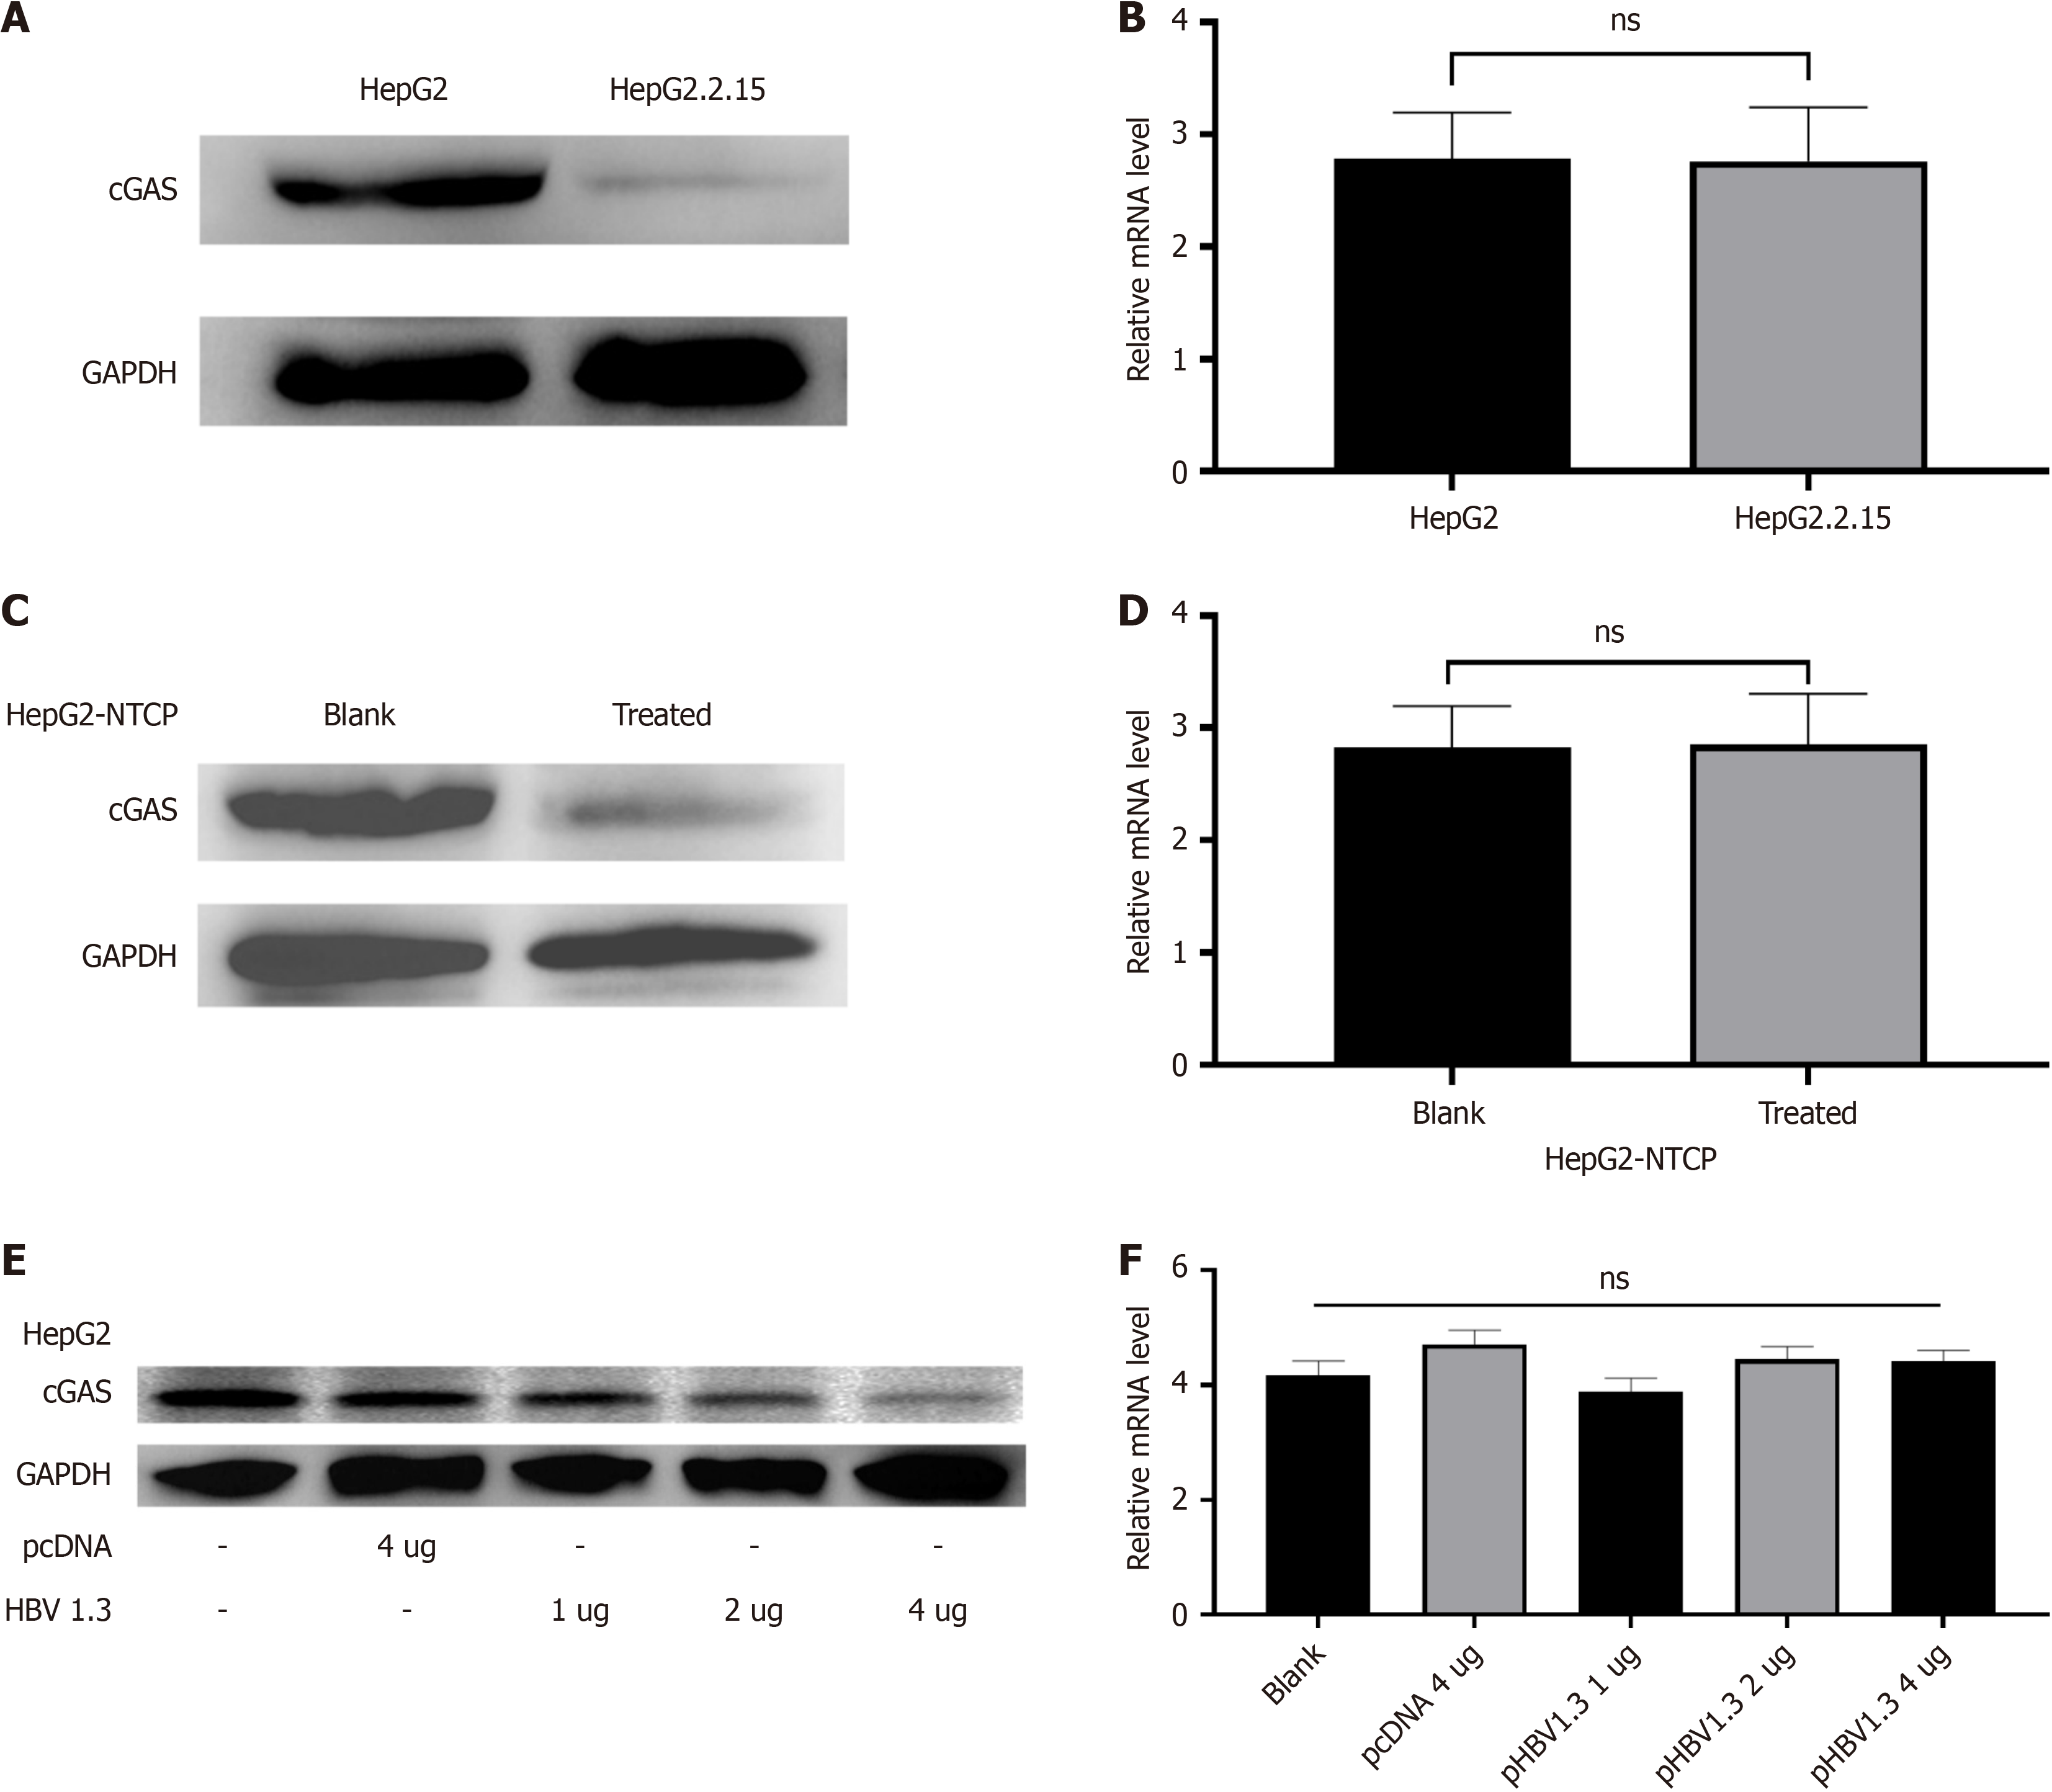
Figure 1 CGAS protein expression in presence of hepatitis B virus.
A: CGAS protein expression in HepG2.2.15 cells vs HepG2 cells; B: CGAS mRNA levels in HepG2.2.15 cells vs HepG2 cells; C: CGAS protein expression in HepG2-NTCP cells treated with hepatitis B virus (HBV) from HepG2.2.15 cells supernatant after 72 hours; D: CGAS mRNA levels in HepG2-NTCP cells treated with HBV from HepG2.2.15 cells supernatant after 72 hours; E: CGAS protein expression in HepG2 cells transfected with different doses of pHBV1.3; F: CGAS mRNA levels in HepG2 cells transfected with different doses of pHBV1.3. Each experiment was repeated three times. Data are presented as mean ± SD.
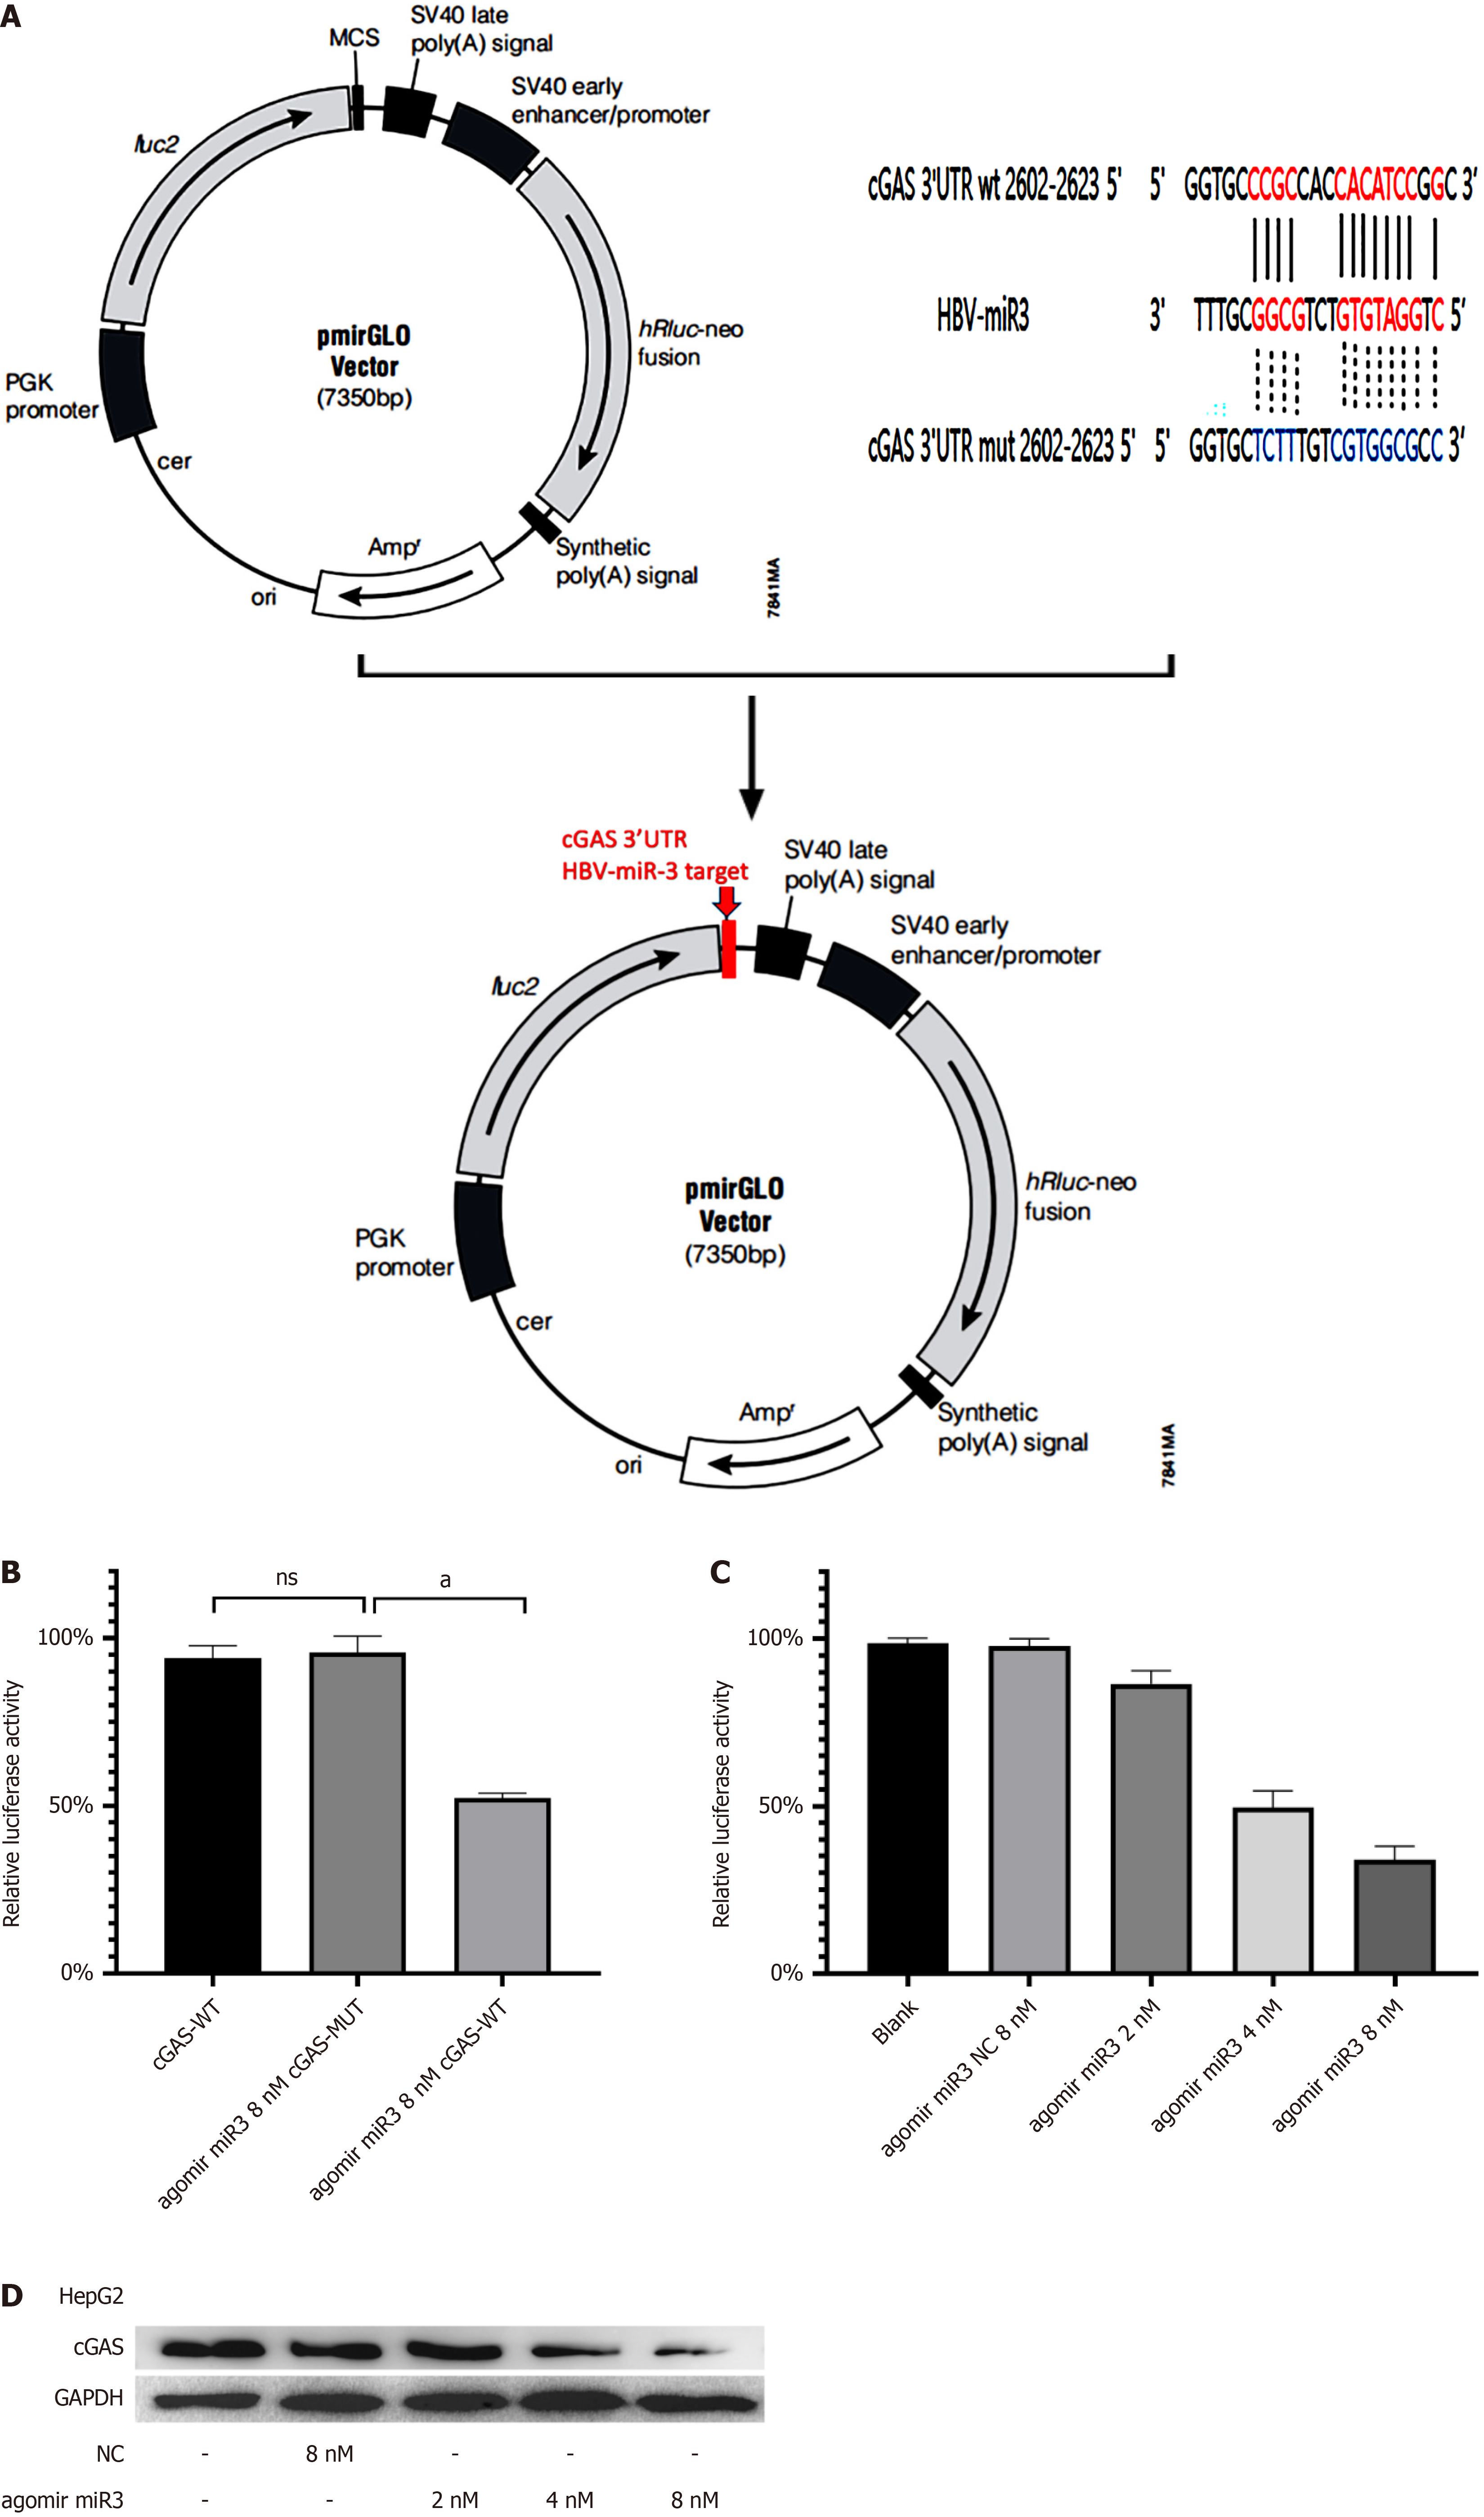
Figure 2 Hepatitis B virus-miR-3 inhibits cGAS protein expression by binding cGAS 3'-untranslated region binding.
A: Schematic of the fluorescent reporter construct designed for the study; B: Relative luciferase activity in HepG2 cells transfected with pmirGLO cGAS wild-type or mutant fluorescent plasmids, and HBV-miR-3 agomir; C: Gradual decline in luciferase activity induced by HBV-miR-3 agomir after 72 hours; D: Dose-dependent repression of cGAS protein mediated by hepatitis B virus-miR-3 agomir after 72 hours. Each experiment was repeated three times. Data are presented as mean ± SD. P < 0.01. WT: Wild-type; MUT: Mutant; NC: Negative control.
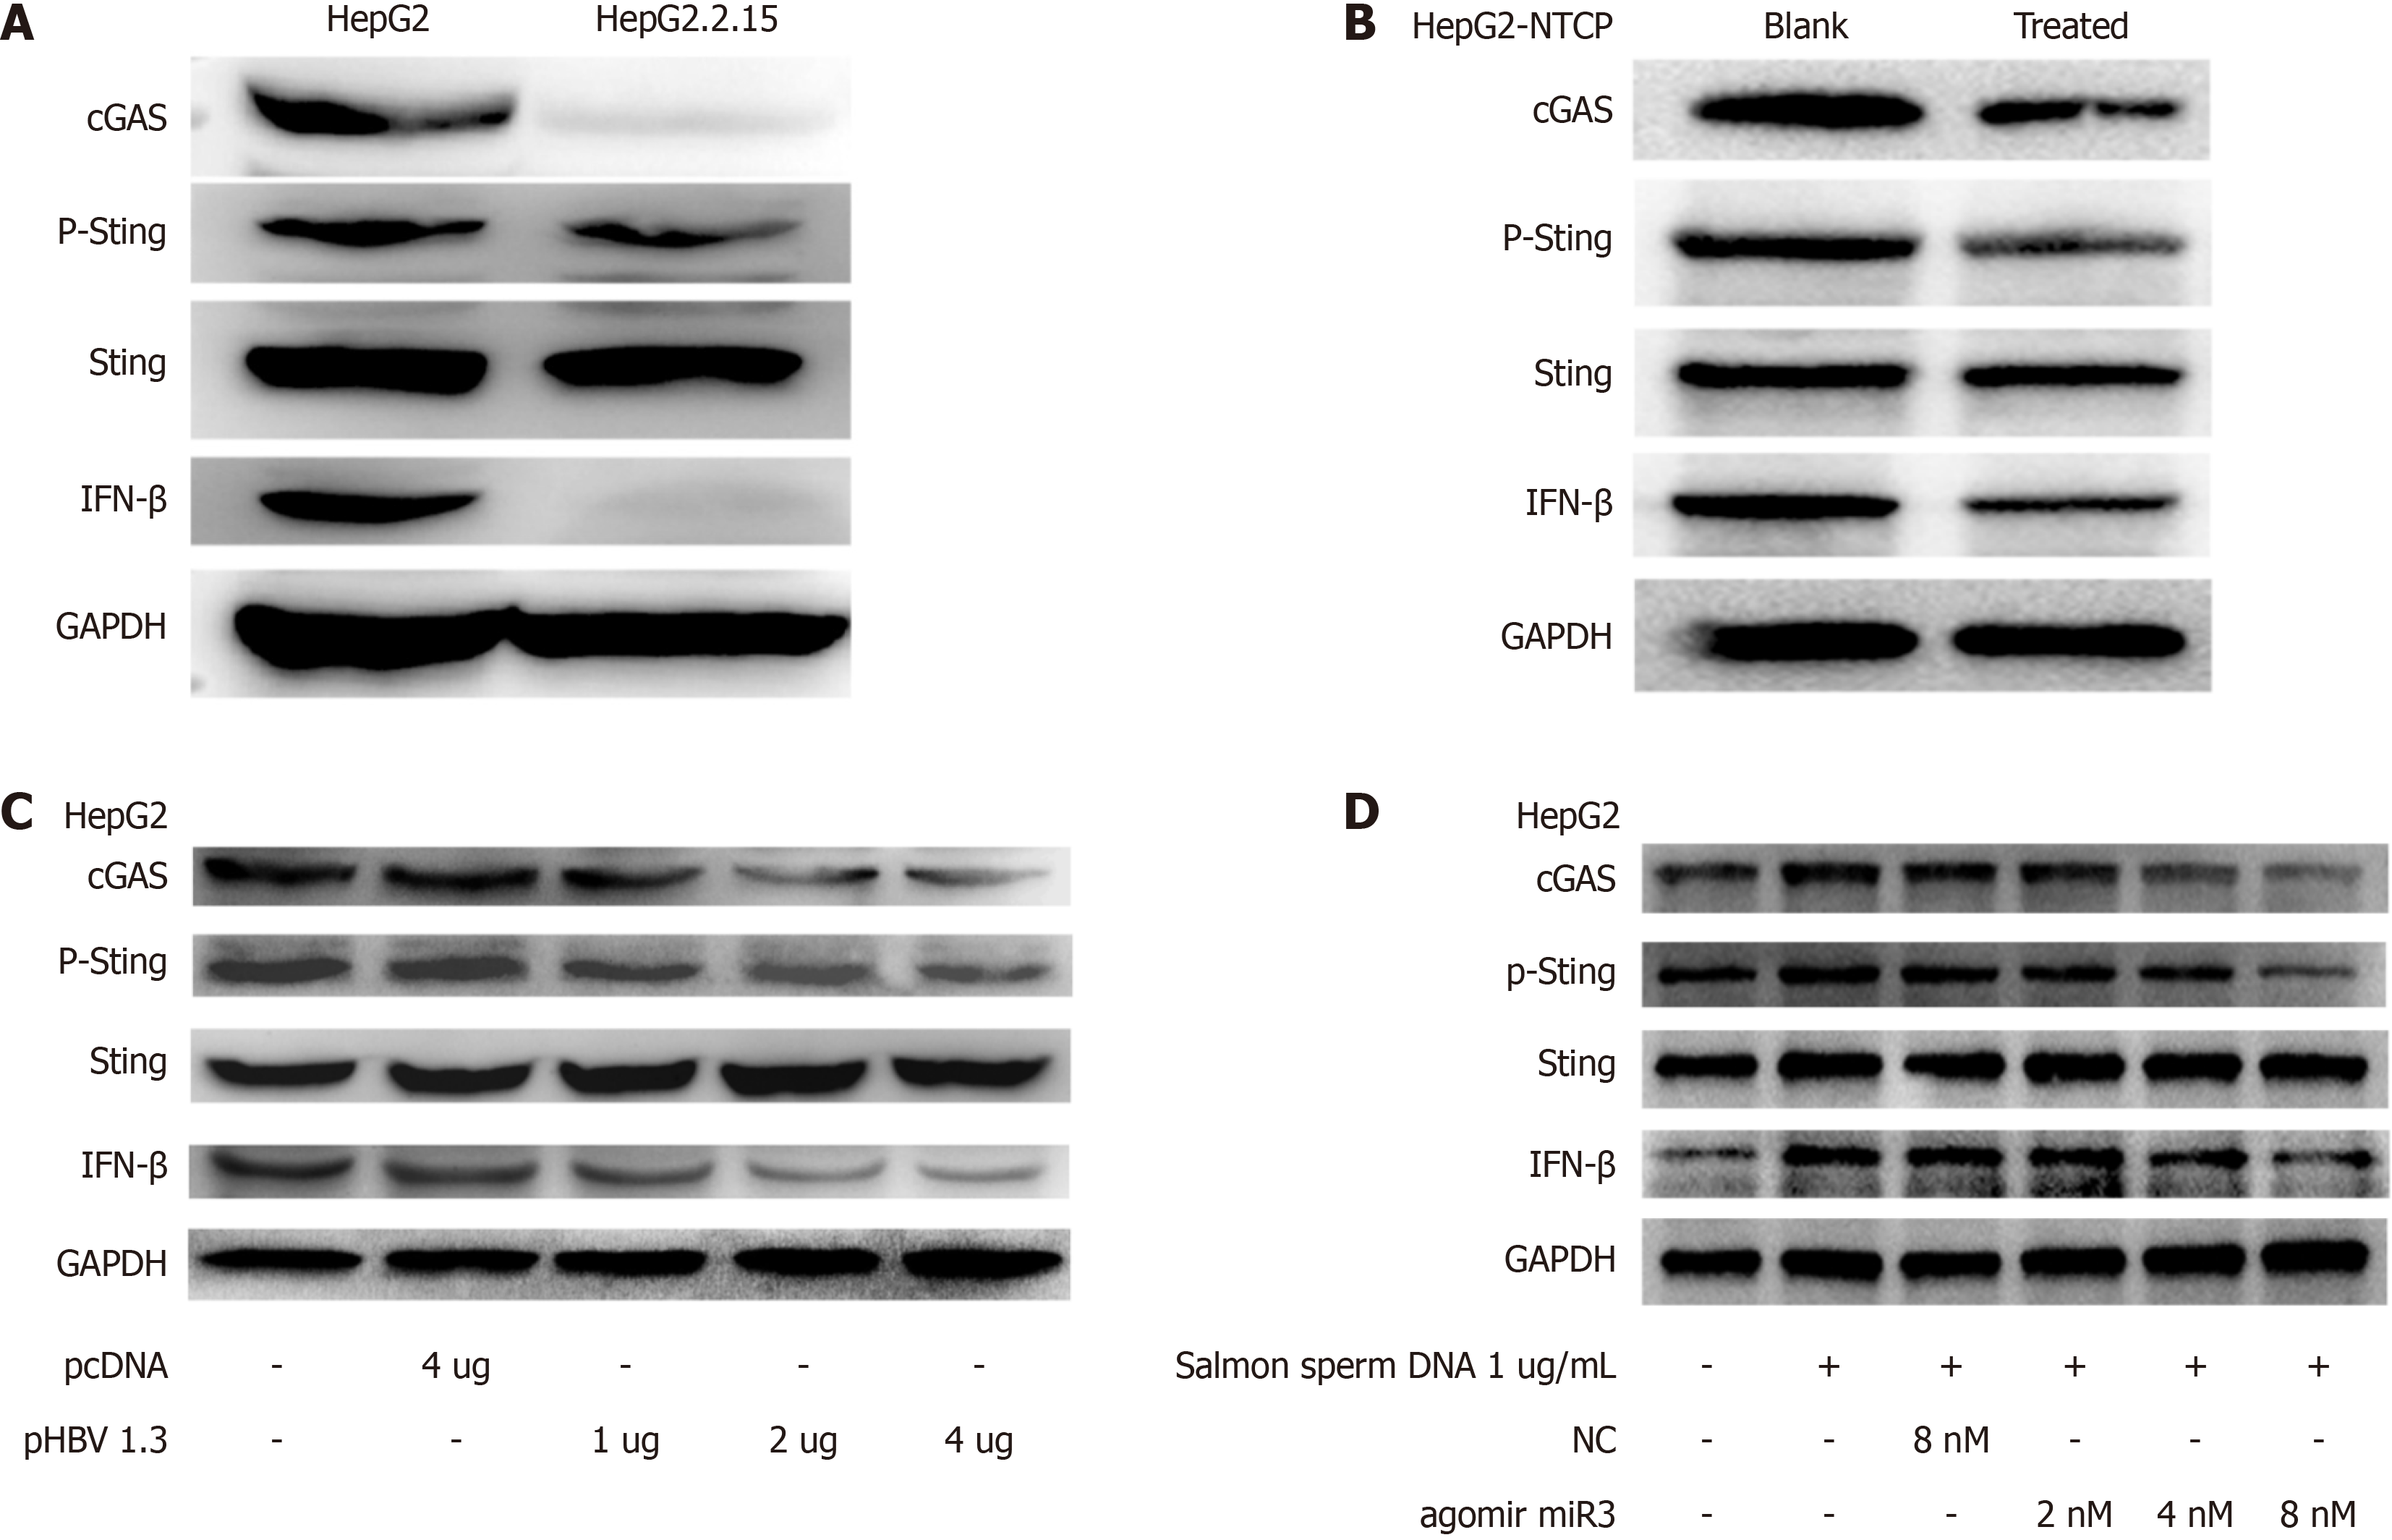
Figure 3 Impact of hepatitis B virus-miR-3 on Sting phosphorylation and IFN-β production.
A: CGAS protein expression, Sting phosphorylation, and IFN-β production in HepG2.2.15 cells compared to HepG2 cells; B: CGAS protein expression, Sting phosphorylation, and IFN-β production in HepG2-NTCP cells treated with hepatitis B virus (HBV) from HepG2.2.15 cell supernatant; C: CGAS protein expression, Sting phosphorylation, and IFN-β production in HepG2-NTCP cells treated with HBV from HepG2.2.15 cell supernatant; D: Co-treatment with HBV-miR-3 agonist and salmon sperm DNA increased cGAS protein expression, Sting phosphorylation, and IFN-β production in HepG2 cells. Each experiment was repeated three times. Data are presented as mean ± SD.
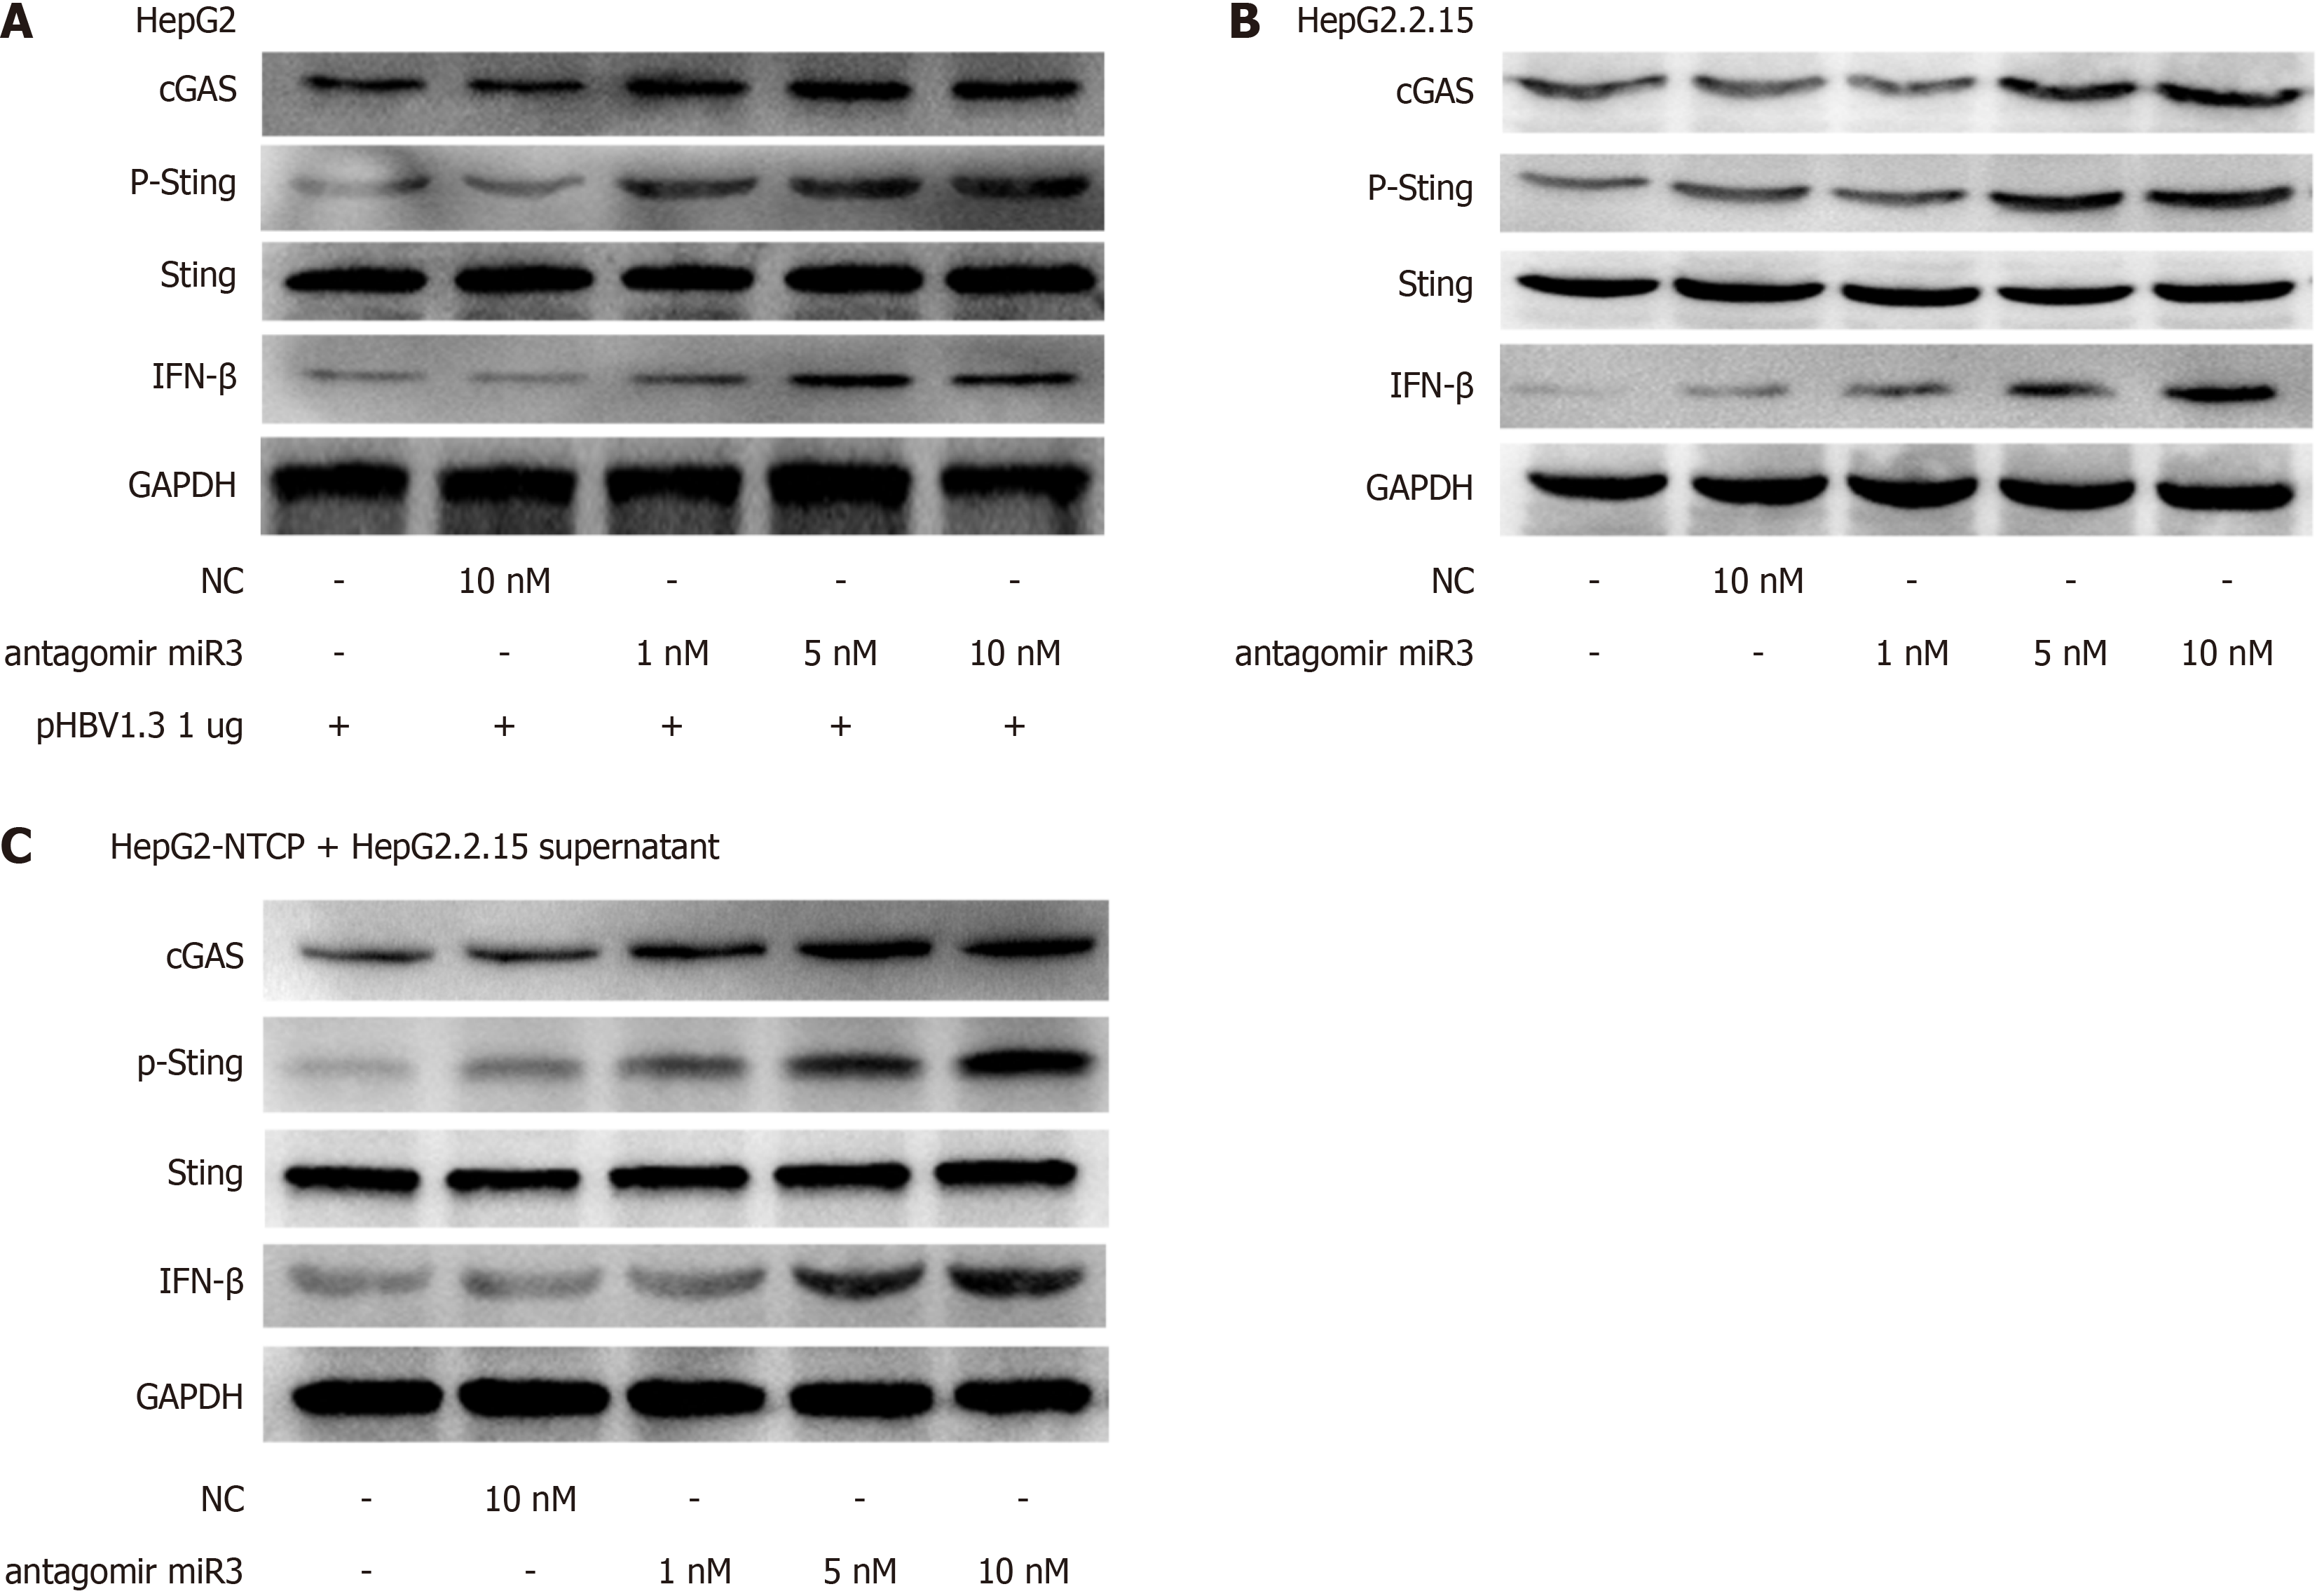
Figure 4 Hepatitis B virus-miR-3 antagomir resued cGAS-Sting pathway activity.
A: Effect of 72-hour HBV-miR-3 antagomir treatment on the cGAS-Sting pathway in HepG2 cells transfected with various dosages of pHBV1.3; B: Expression of the cGAS-Sting pathway in HepG2.2.15 cells after a 72-hour treatment with HBV-miR-3 antagomir; C: Expression of the cGAS-Sting pathway in HepG2-NTCP cells infected with hepatitis B virus from HepG2.2.15 supernatant after 72 hours of HBV-miR-3 inhibitor treatment. Each experiment was conducted three times. Data are presented as mean ± SD.
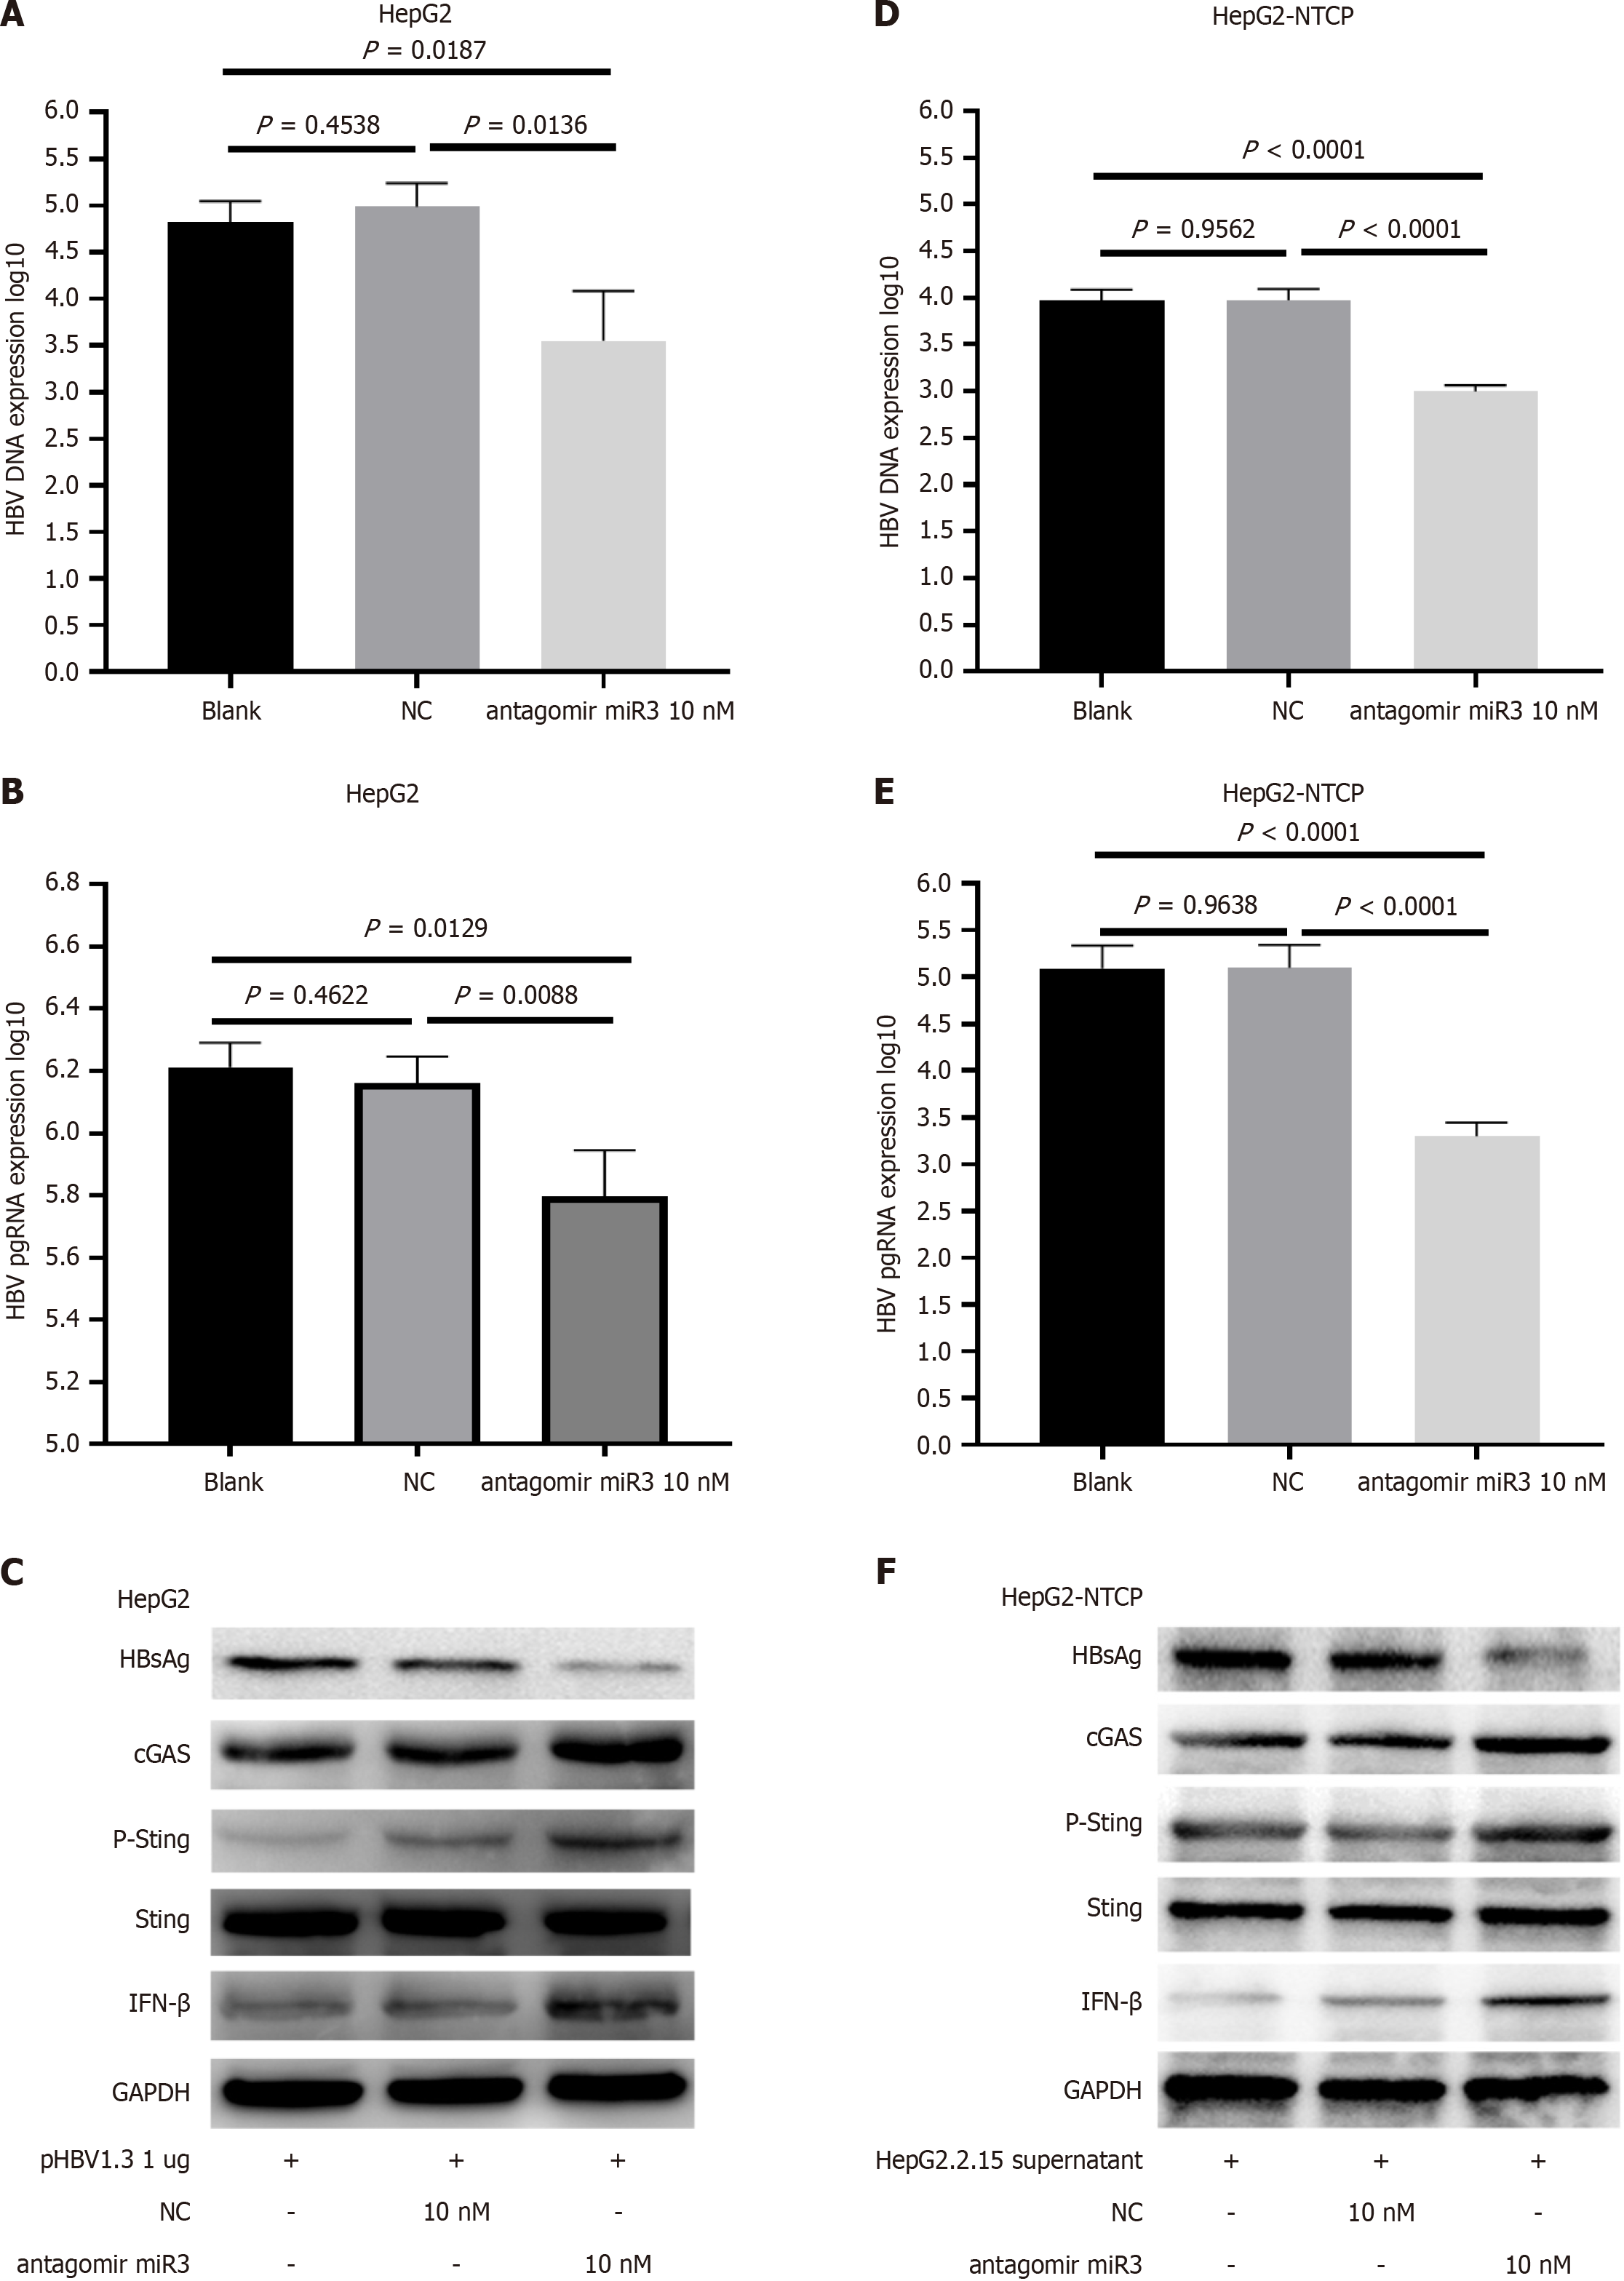
Figure 5 Hepatitis B virus-miR-3 antagomir inhibited hepatitis B virus replication.
A-C: HepG2 cells transfected with pHBV1.3 were treated with an HBV-miR-3 inhibitor for 72 hours, resulting in alterations in hepatitis B virus (HBV) DNA (A), HBV pgRNA (B), and HBsAg (C); D-F: HepG2-NTCP cells were infected with HBV from HepG2.2.15 cell supernatant and treated with an HBV-miR-3 antagomir for 72 hours, resulting in alterations in HBV DNA (D), HBV pgRNA levels (E), and HBsAg (F). Each experiment was repeated three times. The data are presented as mean ± SD. NC: Negative control; HBV: Hepatitis B virus.
- Citation: Xu ZY, Gao JS, He Y, Xiao XQ, Gong GZ, Zhang M. Hepatitis B virus confers innate immunity evasion through hepatitis B virus-miR-3 down-regulation of cGAS-Sting-IFN signaling. World J Hepatol 2025; 17(2): 99292
- URL: https://www.wjgnet.com/1948-5182/full/v17/i2/99292.htm
- DOI: https://dx.doi.org/10.4254/wjh.v17.i2.99292


