Copyright
©The Author(s) 2025.
World J Hepatol. Feb 27, 2025; 17(2): 99046
Published online Feb 27, 2025. doi: 10.4254/wjh.v17.i2.99046
Published online Feb 27, 2025. doi: 10.4254/wjh.v17.i2.99046
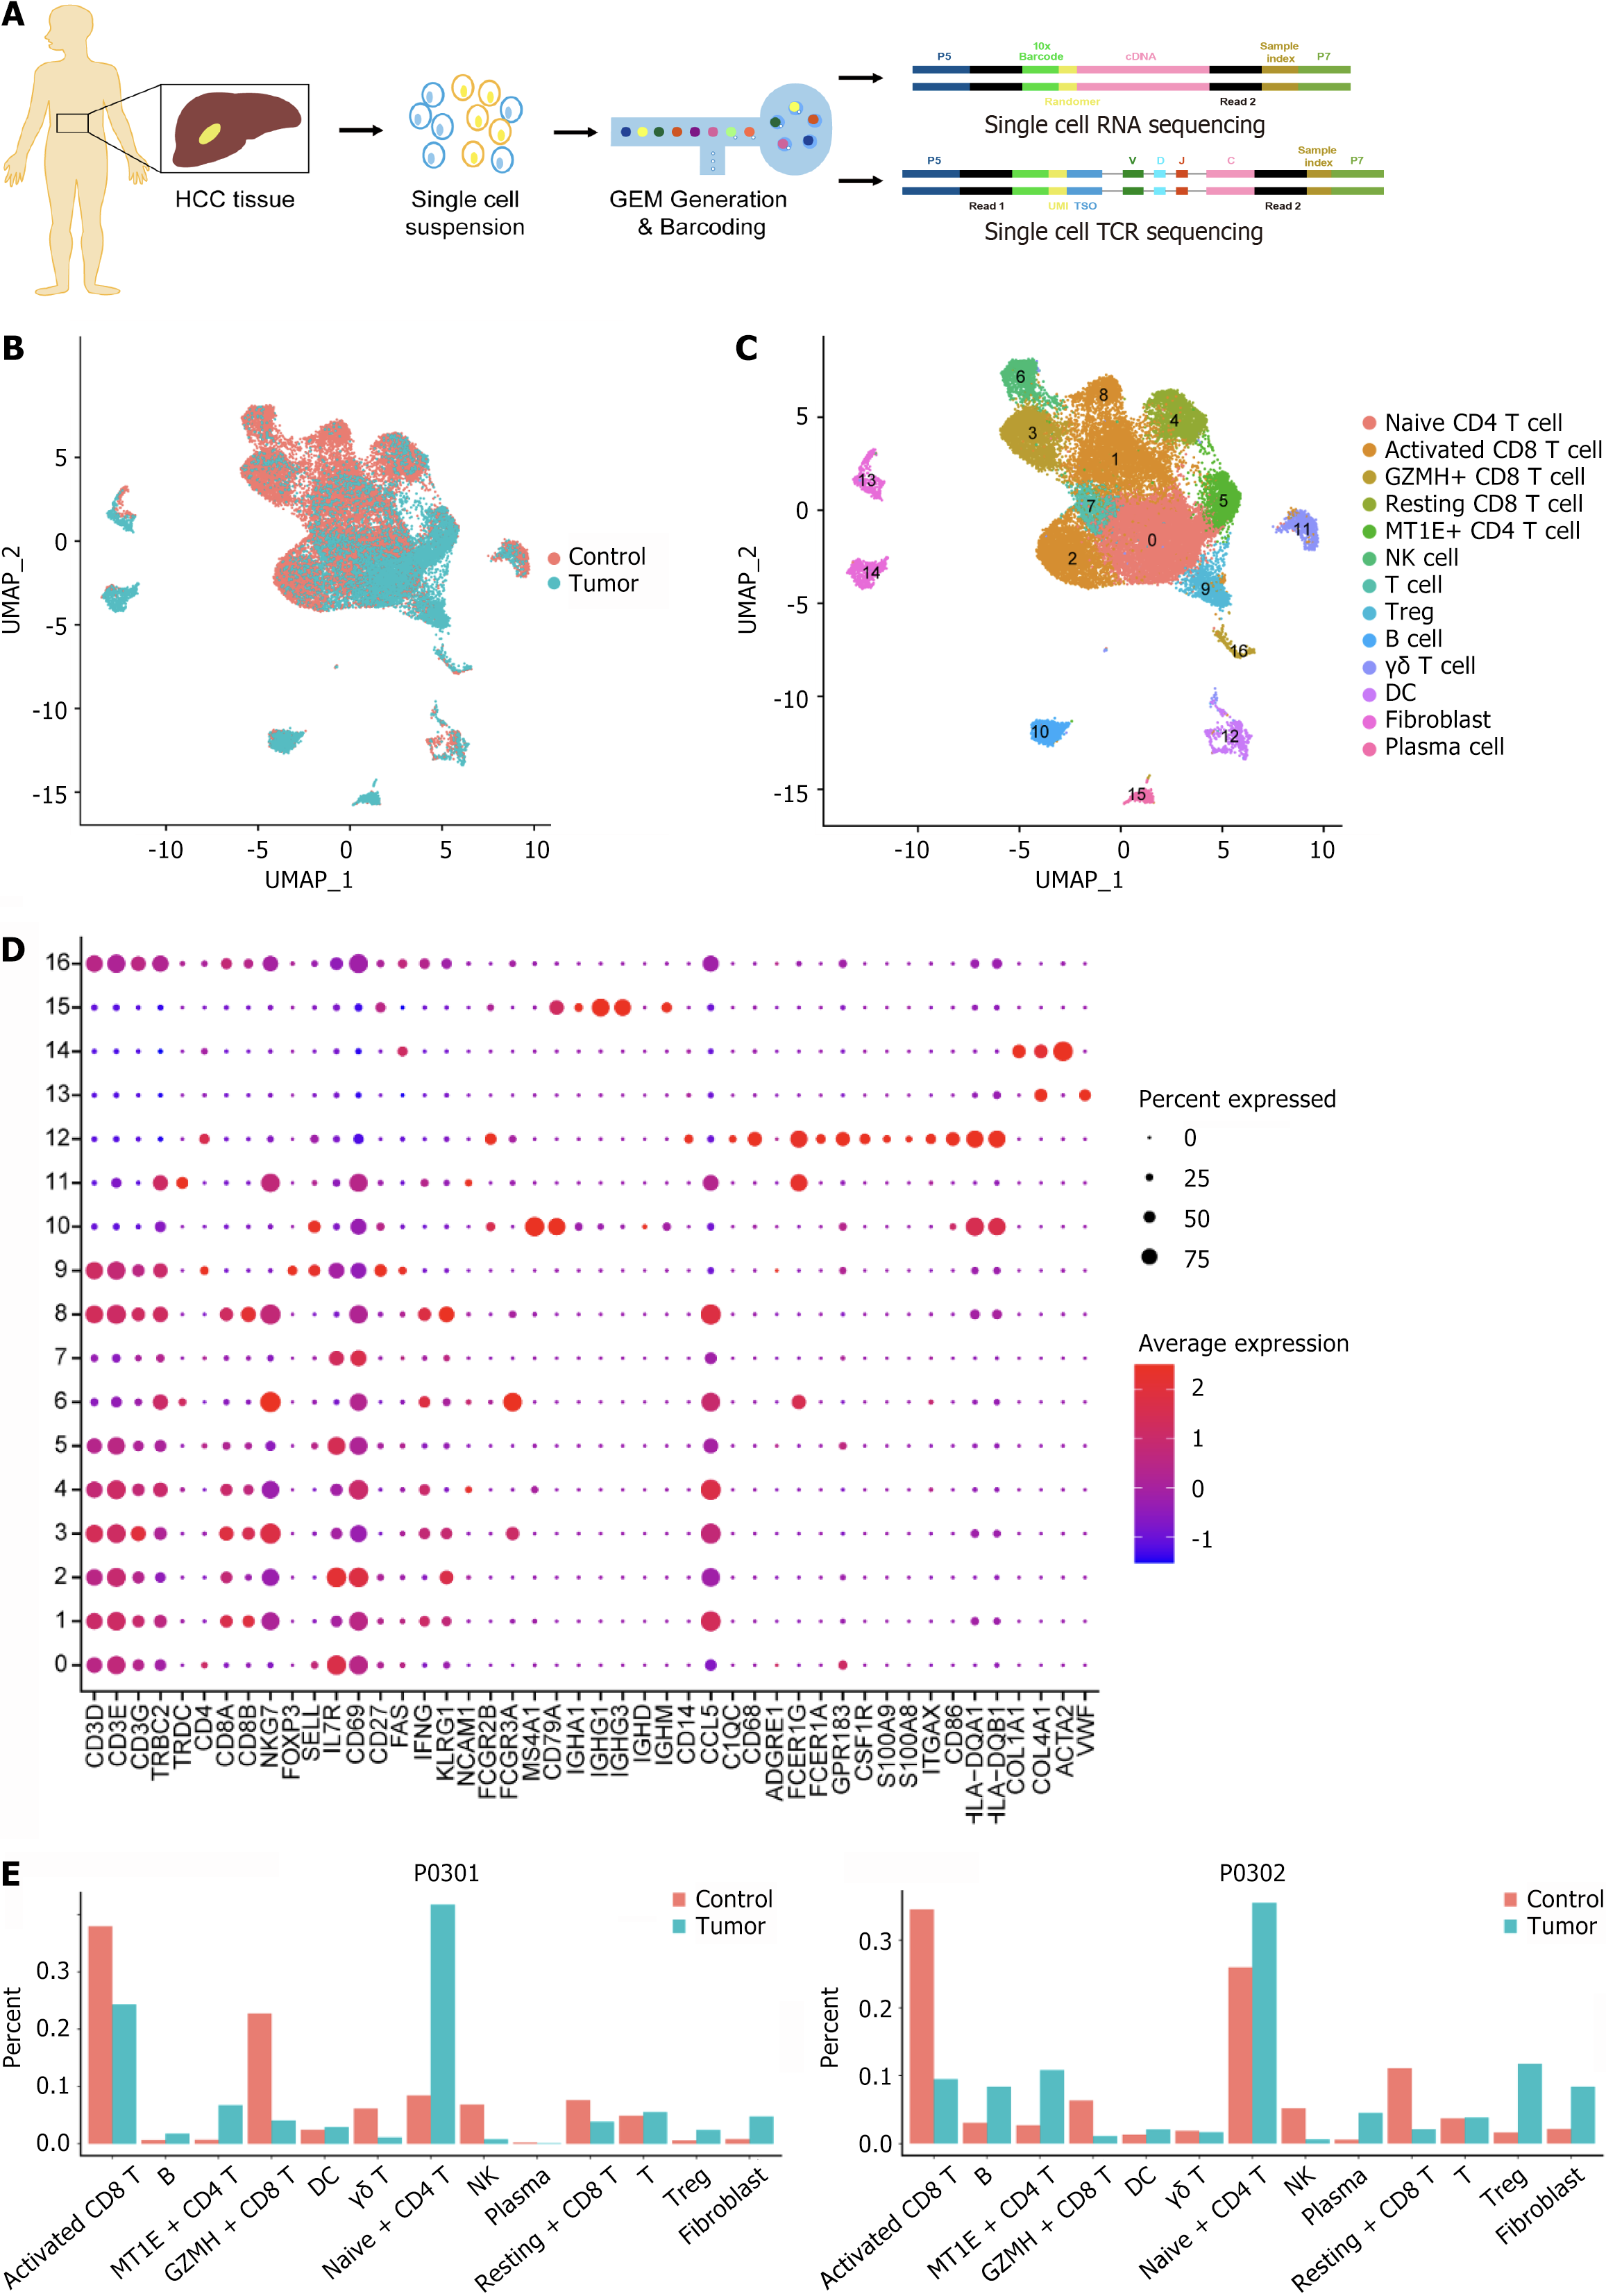
Figure 1 Single-cell transcriptome clustering of all cells from hepatocellular carcinoma patients.
A: Schematic diagram of the single-cell RNA sequencing experimental design; B: Uniform manifold approximation and projections of the combined single-cell RNA sequencing profiles of immune cells from control and tumor samples are plotted and colored according to samples; C: Cells are plotted and colored according to cell clusters. Each point corresponds to a single cell colored according to the cell cluster; D: A bubble plot of typical marker genes in each cluster is displayed. Darker colors indicate higher average expression; larger bubbles indicate a greater percentage of genes; E: Histogram of the abundance distribution of each cell subpopulation in the hepatocellular carcinoma and control groups. HCC: Hepatocellular carcinoma; TCR: T-cell receptor; UMAP: Uniform manifold approximation and projections; GZMH: Granzyme H; MT1E: Metallothionein 1E; NK: Natural killer; Treg: Regulatory T cells; DC: Dendritic cell.
Figure 2 Comprehensive analysis of cancer and paracancerous T cells in hepatocellular carcinoma patients.
A: Cluster distribution of T-cell subsets on uniform manifold approximation and projections after subdivision; B: Marker gene heatmap of the subpopulations. The horizontal line represents the marker gene name, with the cells listed vertically and the upper color bar representing different subpopulations; C: Histogram showing the difference in the proportions of T-cell subsets between cancer patients and paracancerous patients; D: Scatter plot of differential expressed genes showing genes highly expressed in tumor 1_Activated CD8+ T cells, 2_TRM, 4_Activated CD8+ T cells and 5_Activated CD8+ T cells at P0301. Each dot represents a gene; E: Gene ontology (GO) enrichment analysis results showing the functional enrichment of upregulated differential expressed genes s in tumor tissues. The vertical axis is the GO entry, and the horizontal axis is the number of genes enriched in the GO entry. The redder color indicates greater significance. UMAP: Uniform manifold approximation and projections; TRM: Tissue-resident memory T cells; NK: Natural killer; Treg: Regulatory T cells; FCER1G: Fc epsilon receptor 1G; MT1E: Metallothionein 1E; BP: Biological process; CC: Cellular composition; MF: Molecular function.
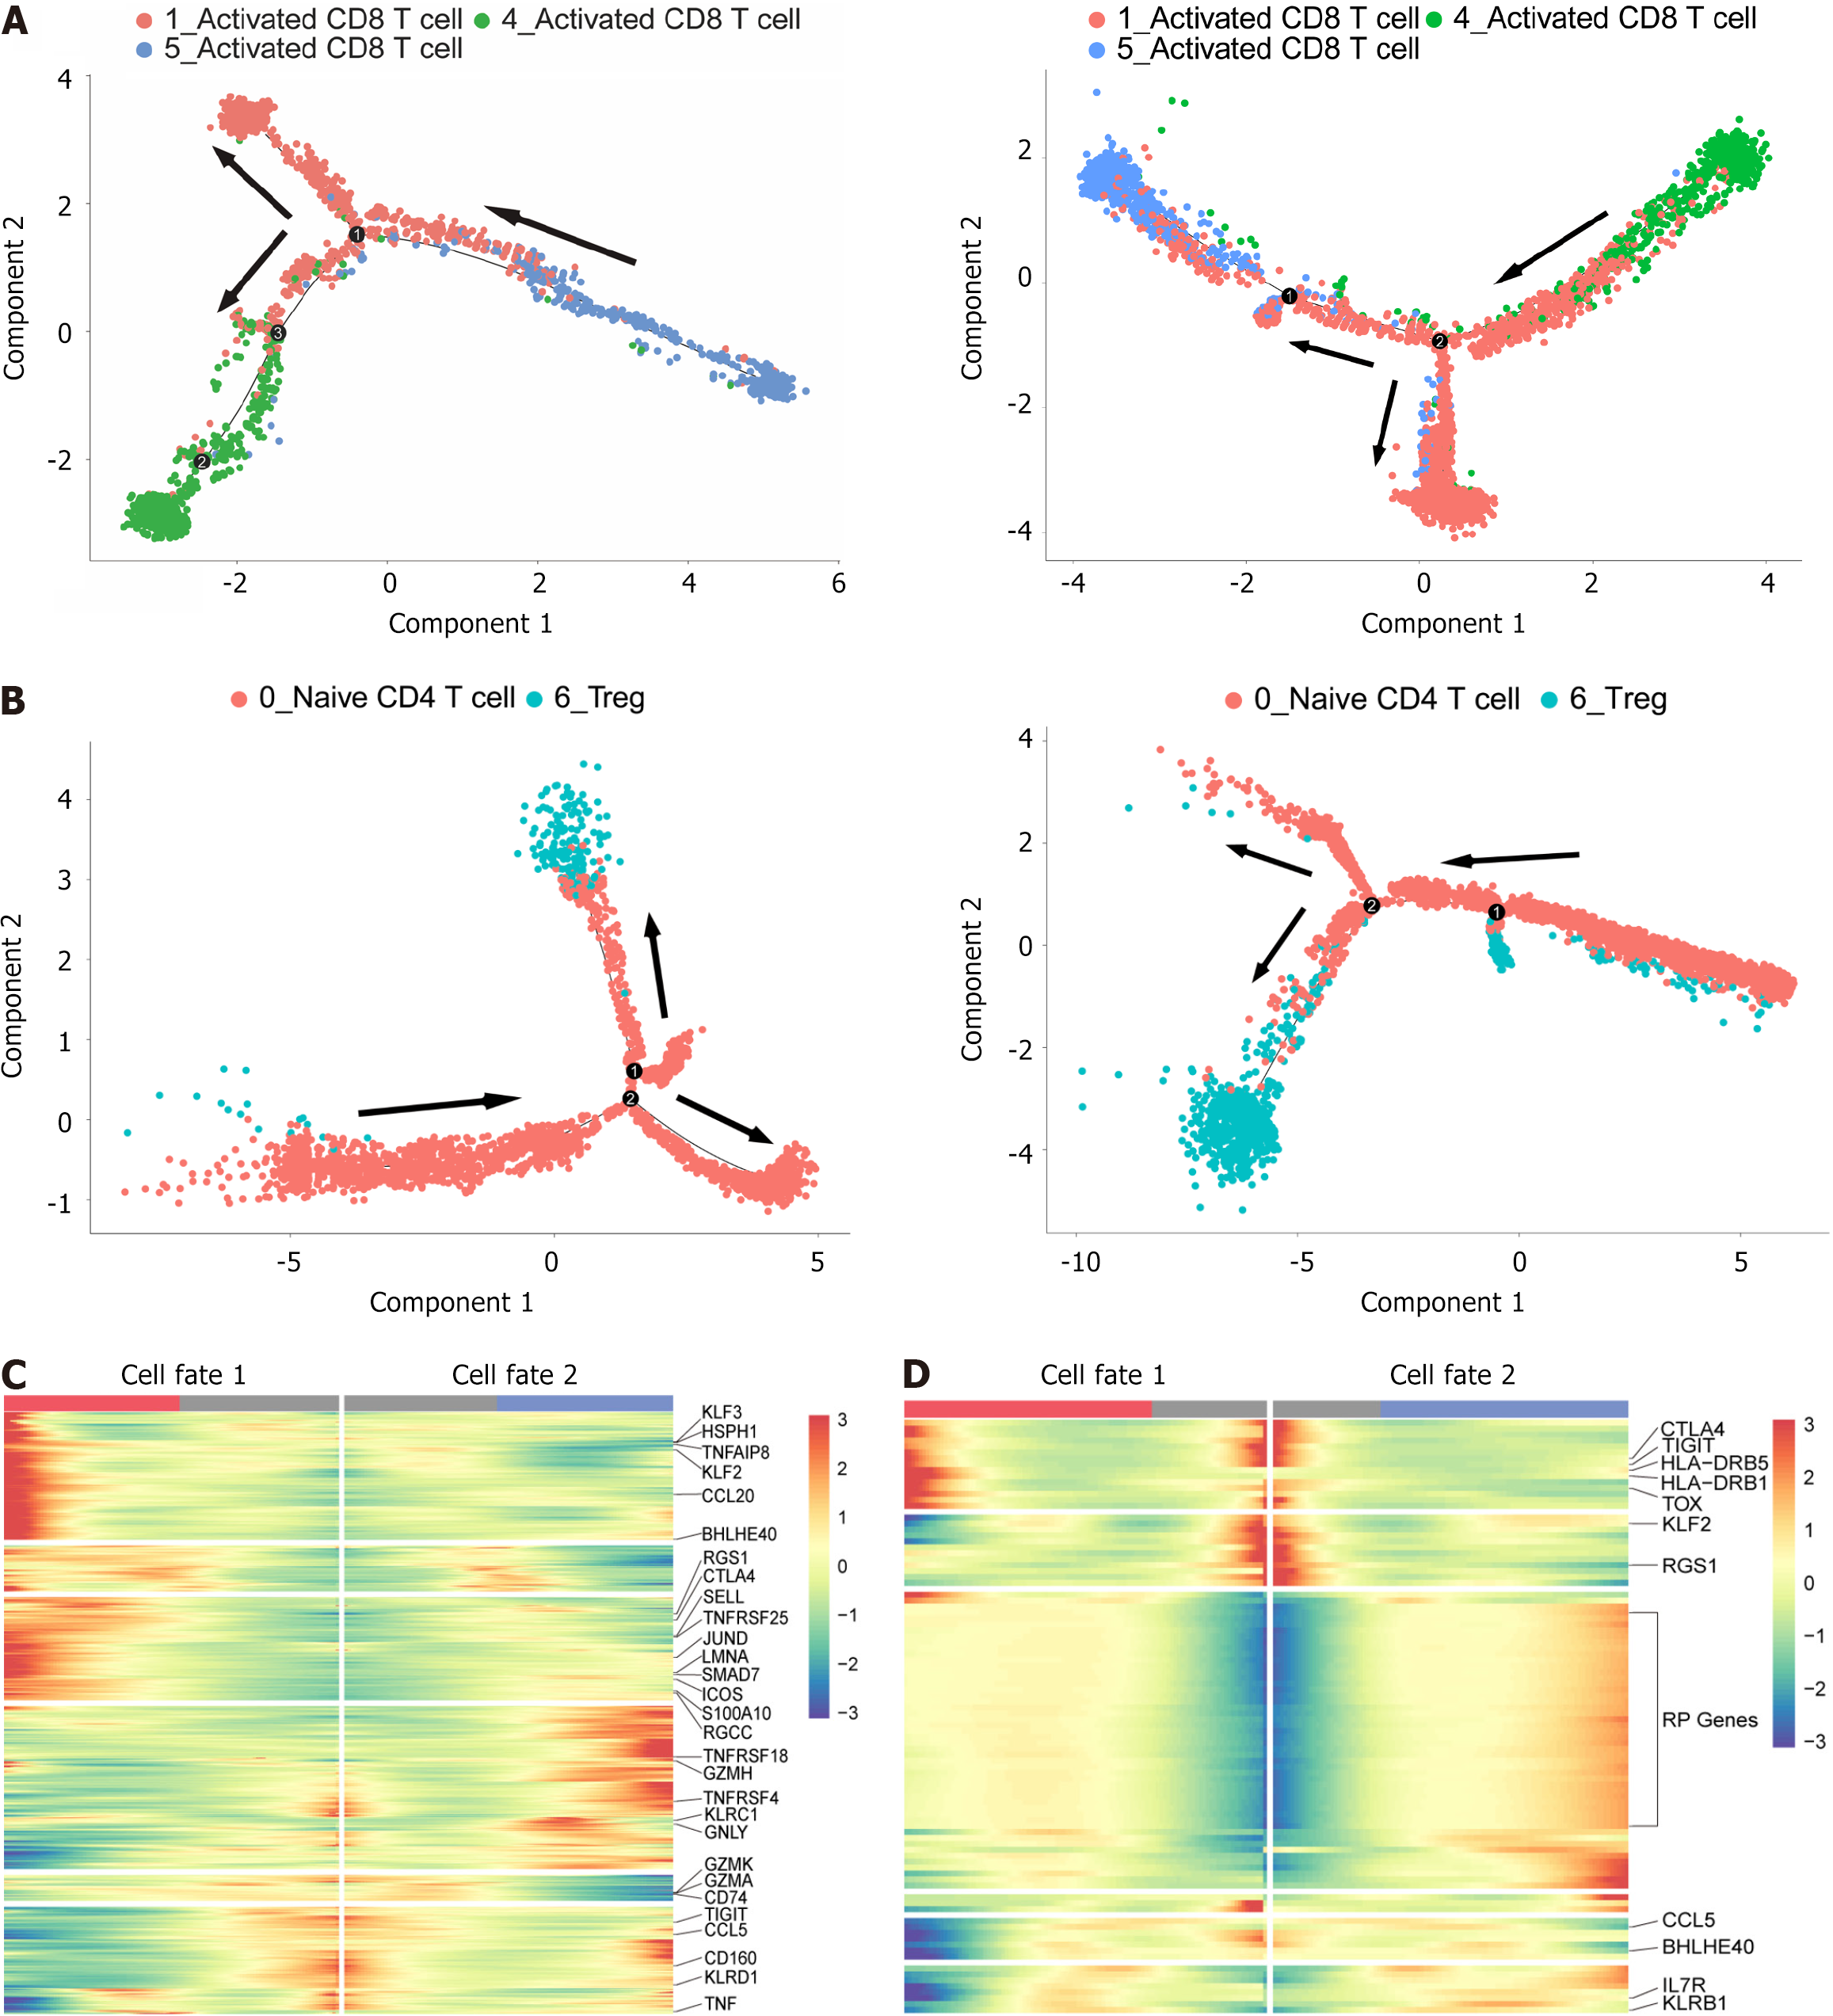
Figure 3 Analysis of the development trajectories of the CD8+ T and CD4+ T-cell subsets.
A: Schematic diagram of the pseudotime trajectory of CD8+ T-cell subpopulations at P0301 (left) and P0302 (right). Each dot corresponds to a single cell, and each color represents a T-cell cluster; B: The same trajectory analysis was applied to CD4+ T cells; C: Heatmap of differential gene expression using branch point expression analysis comparing different cell fates of CD8+ T cells at P0301. Each row represents a gene, and the column represents a total of 100 bins that divide the pseudotime value from start to finish; D: Branch point expression analysis of the same CD4+ T cells in P0301.
Figure 4 Cell communication analysis of CD8+ T and CD4+ T-cell subsets.
A: Bubble map showing signaling pathways upregulated among cell subpopulations in tumors. The abscissa is the ligand-acceptor pair; the ordinate is the cell type alignment group. The tissue type is noted in the parentheses; B and C: Strength mapping of outgoing signaling pathways in different tissues for each cell subpopulation in P0301. DC: Dendritic cell; NK: Natural killer; Treg: Regulatory T cells.
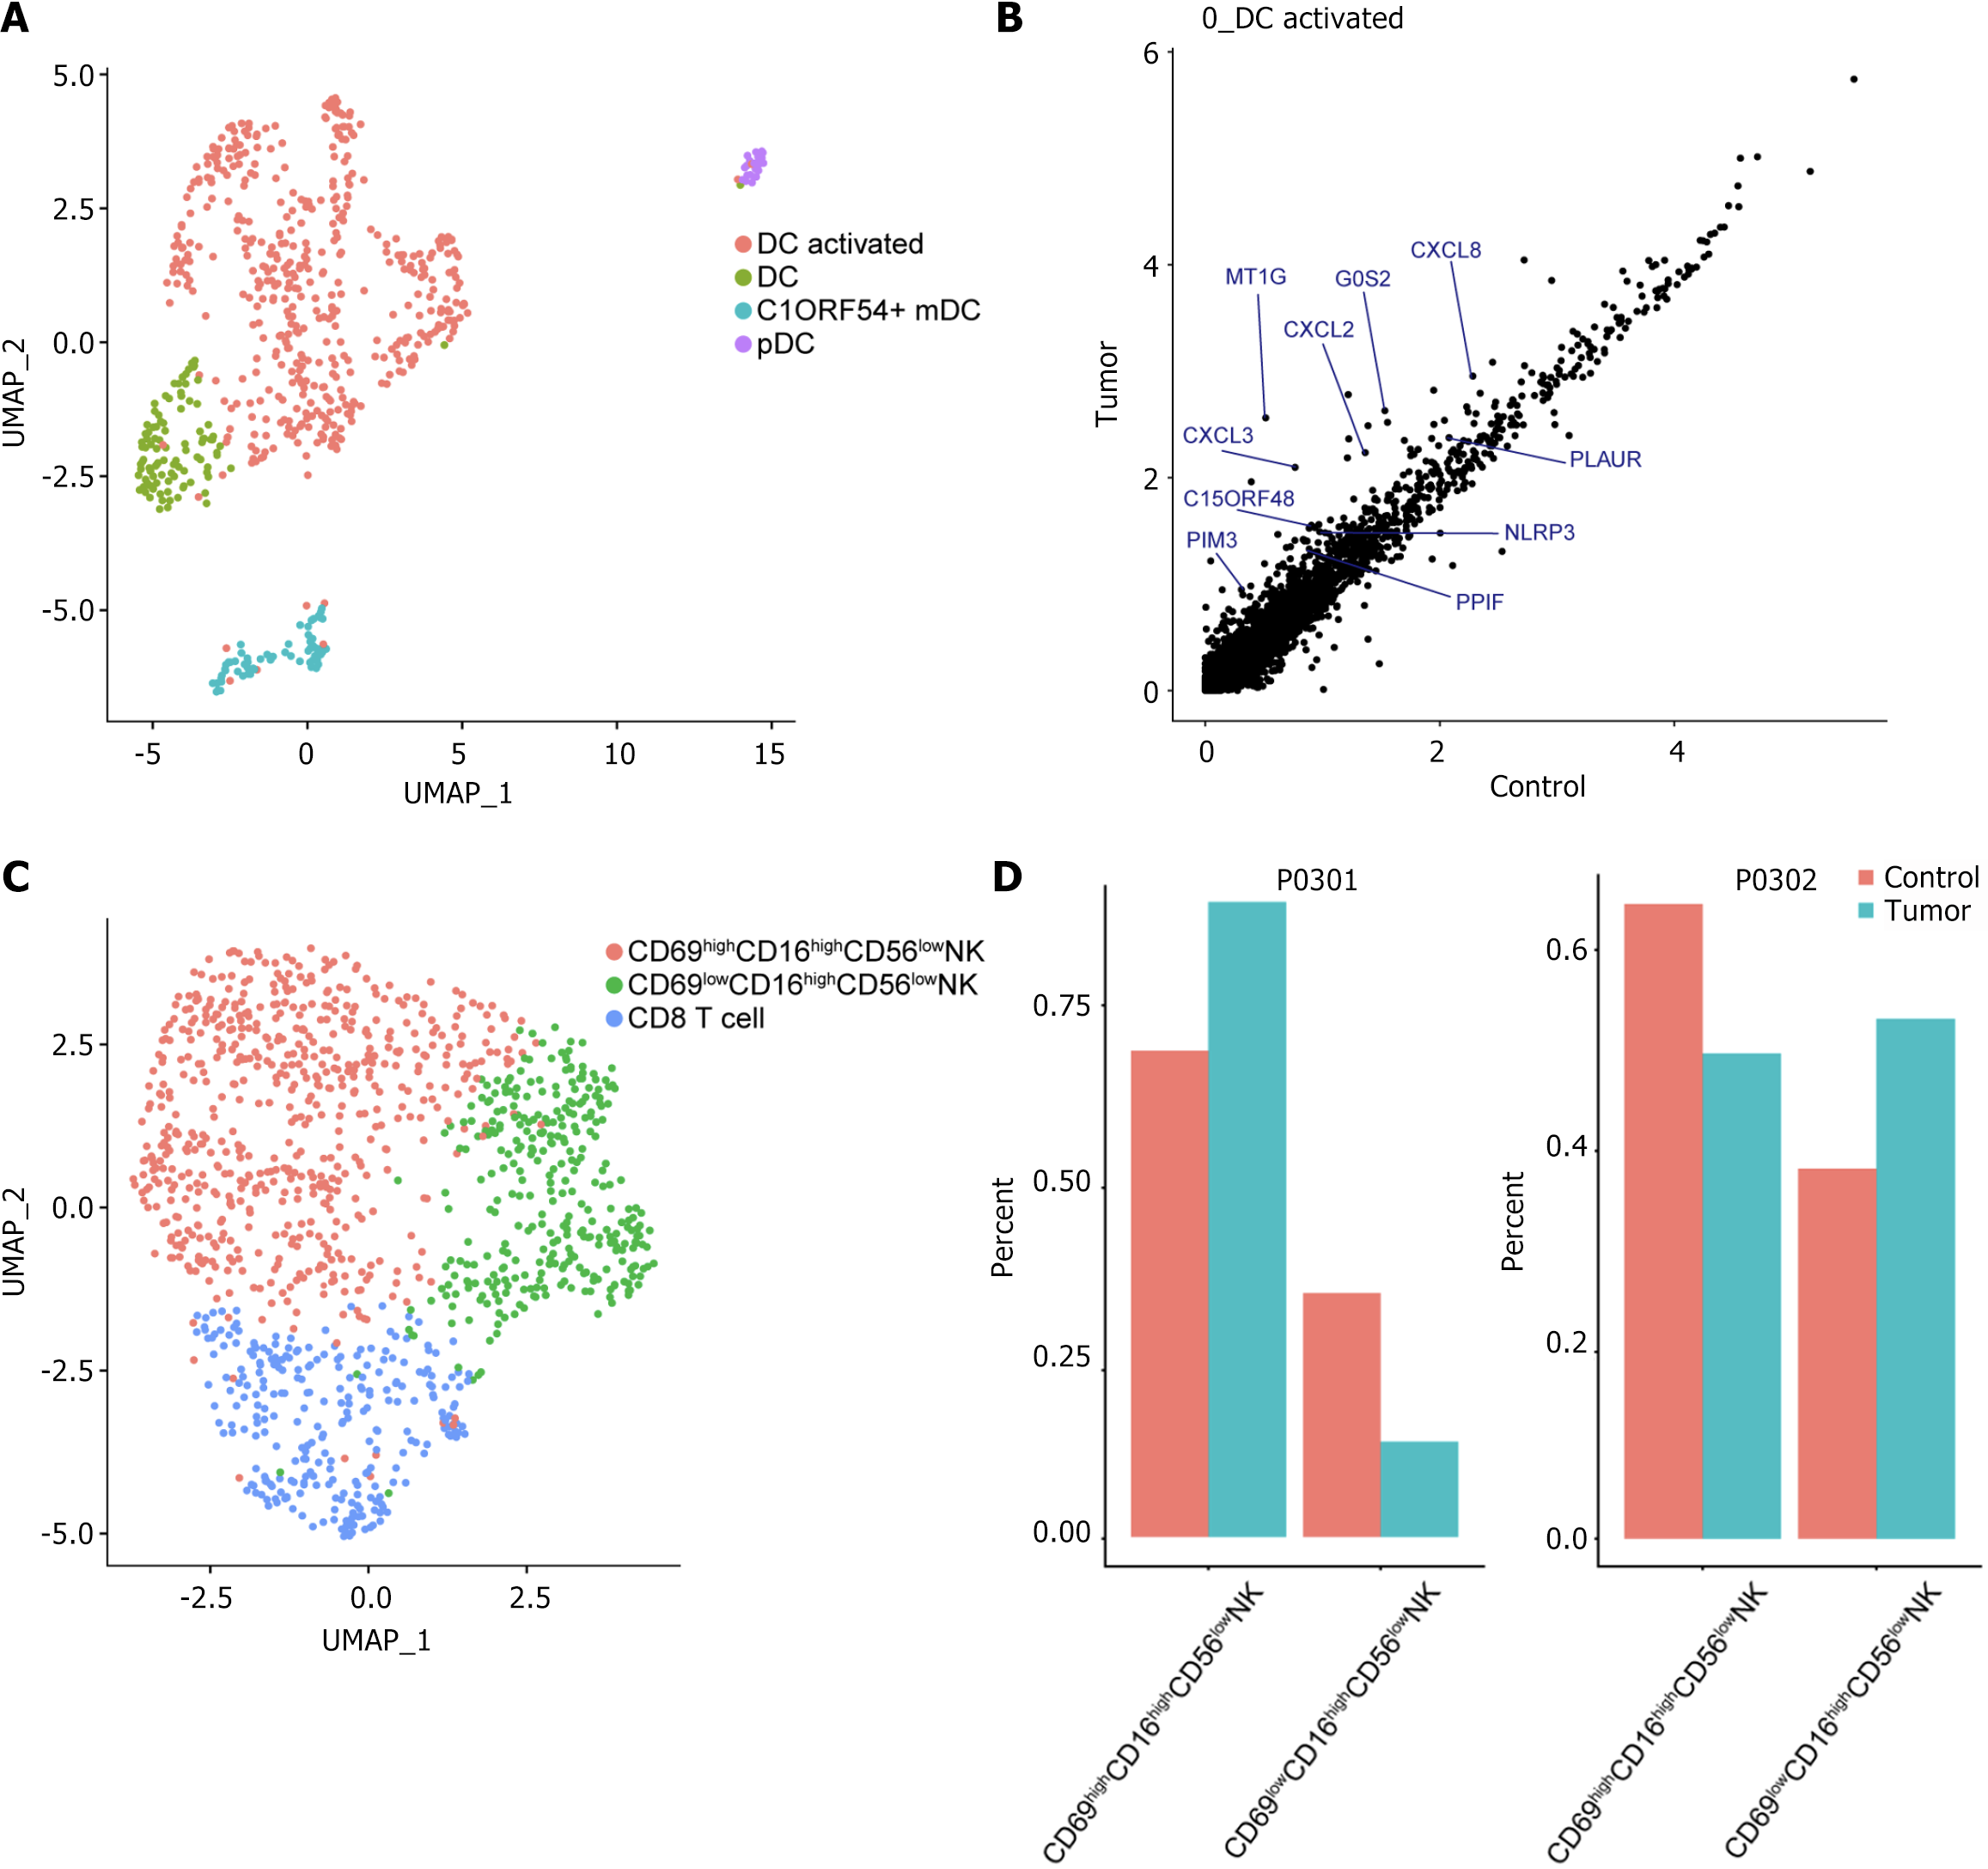
Figure 5 Single-cell immune landscape of dendritic cells and natural killer cells.
A: Uniform manifold approximation and projections plots showing dendritic cell subpopulations; B: Scatter plot of differentially expressed genes showing genes highly expressed in activated 0_DC tumors. Each dot represents a gene; C: Uniform manifold approximation and projections plots showing subpopulations of natural killer cells; D: Histogram showing the percentage of natural killer cells from different sources of tissues. UMAP: Uniform manifold approximation and projections; DC: Dendritic cell; C1ORF54: Chromosome 1 open reading frame 54; PDC: Plasmacytoid dendritic cell; NK: Natural killer.
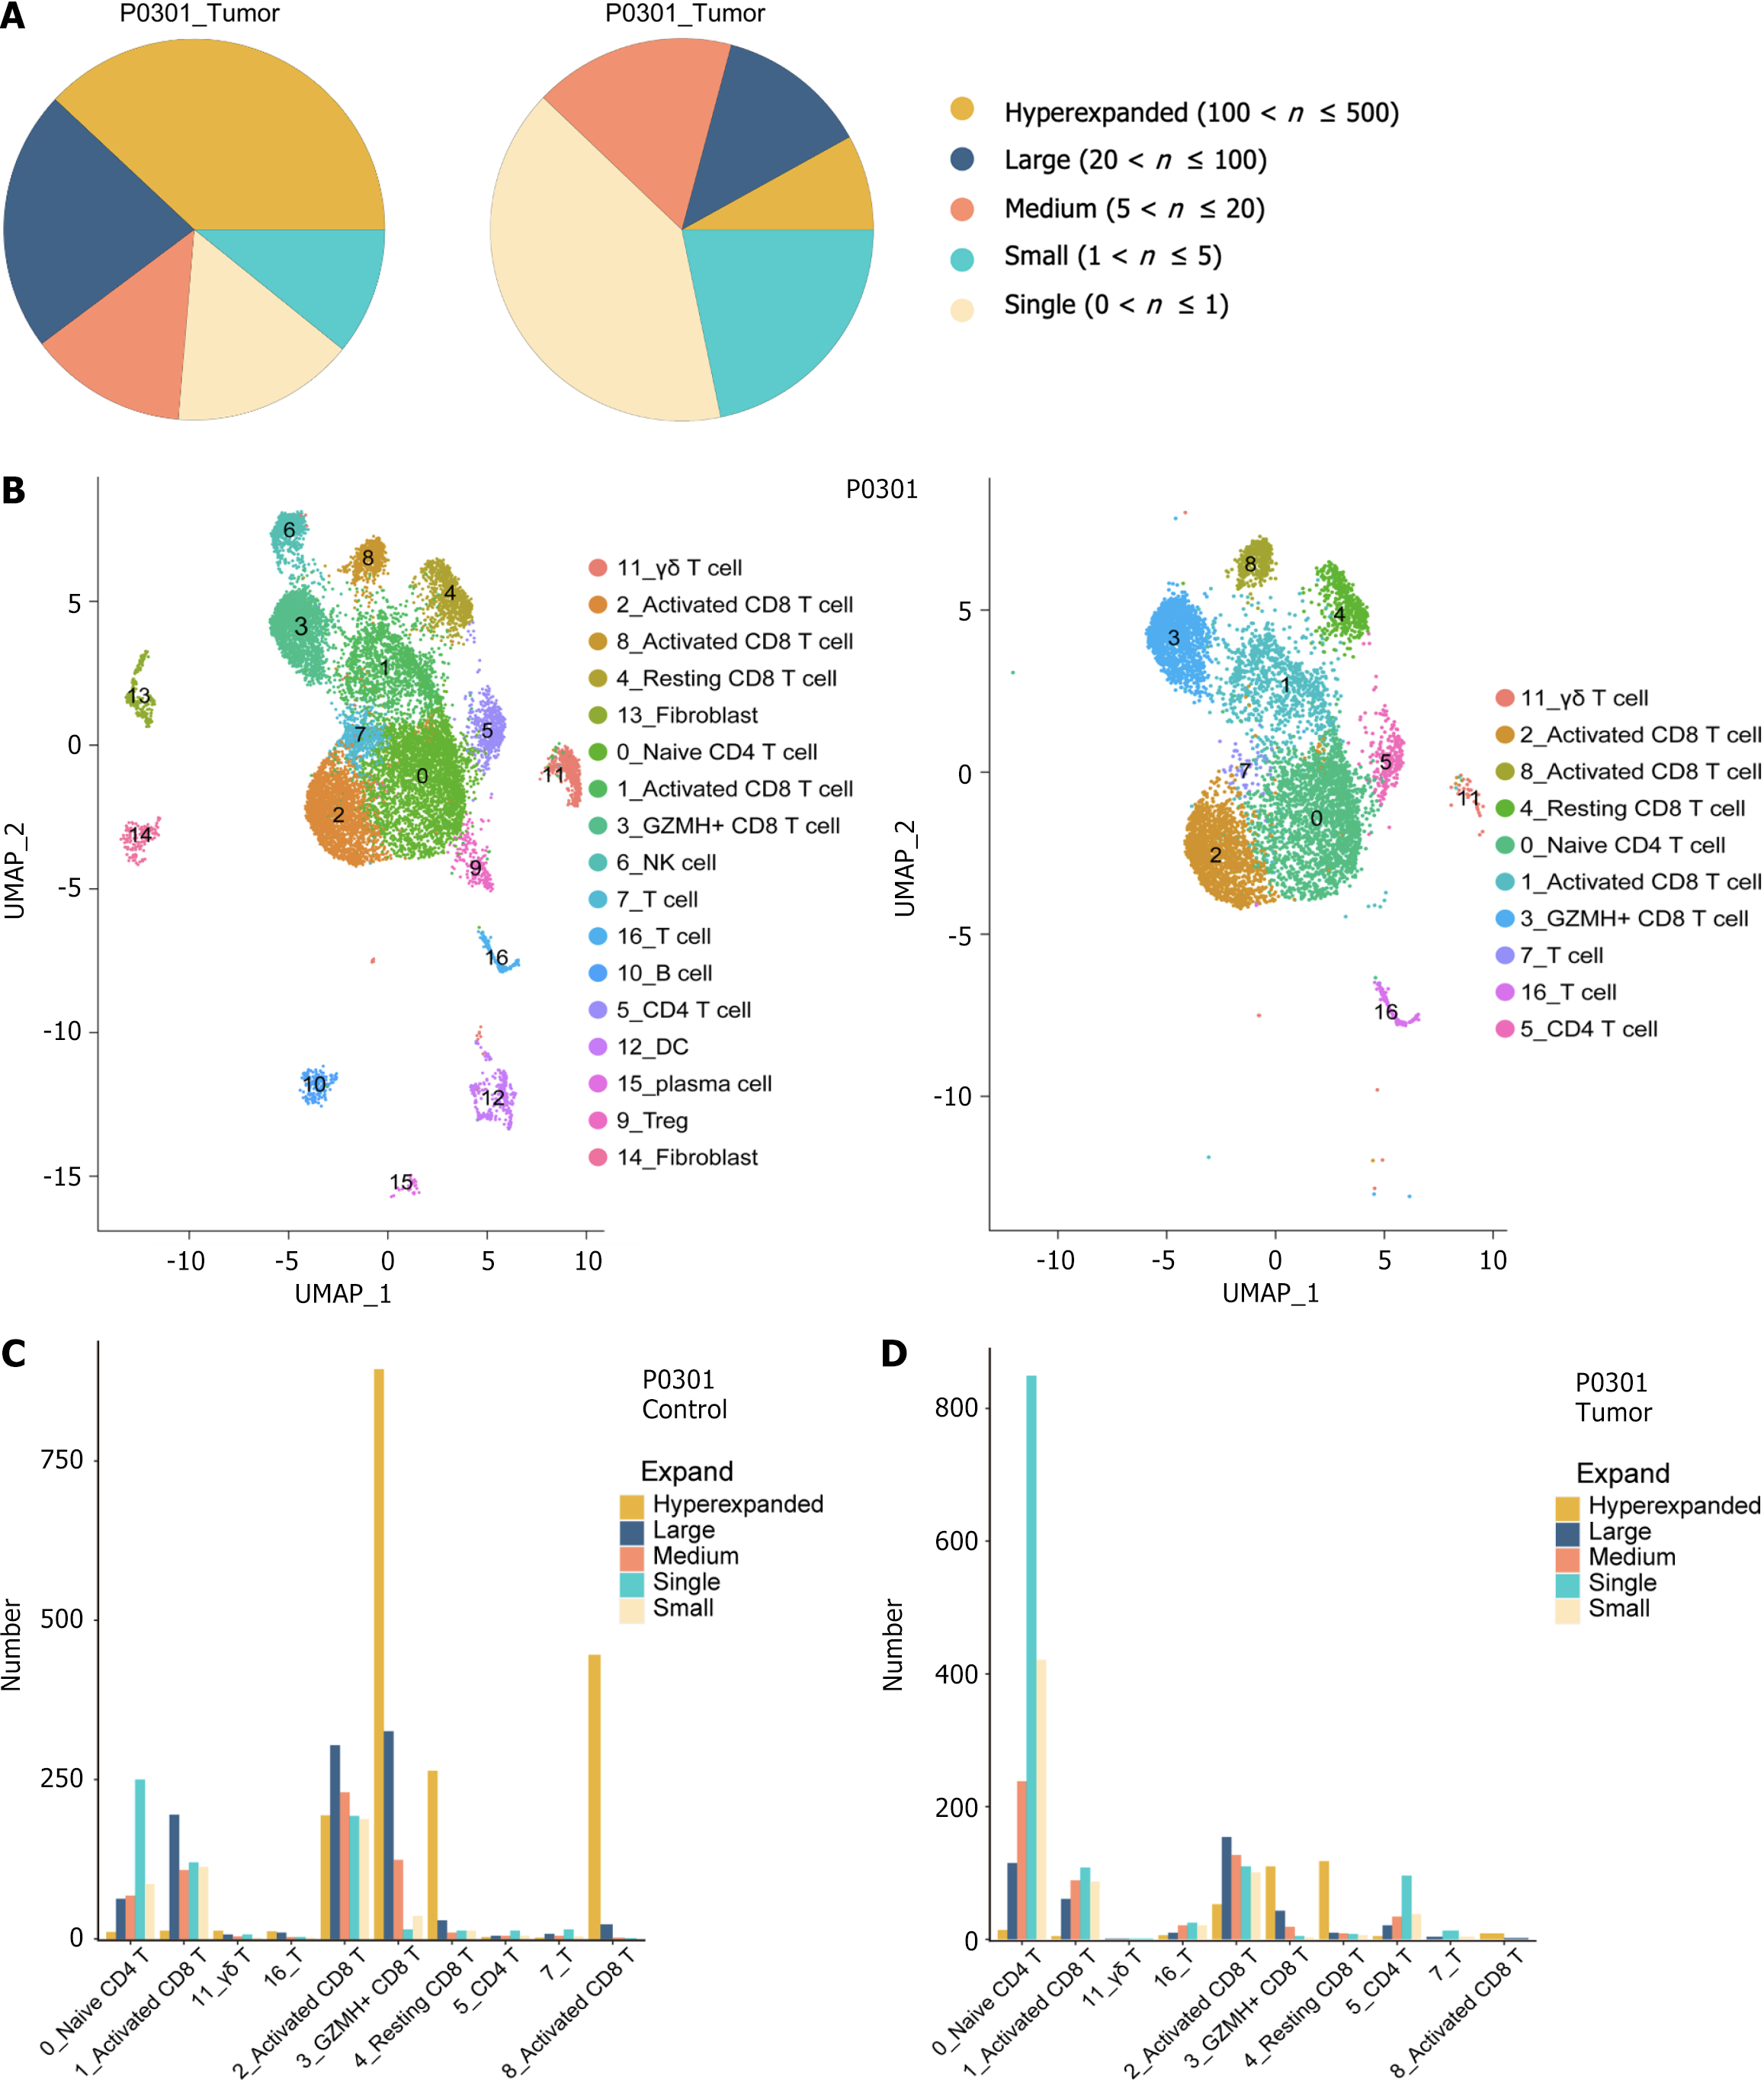
Figure 6 Analysis of T-cell receptor distribution and clonality in hepatocellular carcinoma patients.
A: Sectoral graph showing the extent of T-cell receptor (TCR) clone amplification in hepatocellular carcinoma patients. The different colors correspond to each of the five TCR clone amplification groups; B: Uniform manifold approximation and projections clustering map of T cells generated by combining TCR expression data; C and D: The expansion levels of five different types of TCR amplification groups in each cell subtype of P0301 control and tumor.
- Citation: Gu XY, Gu SL, Chen ZY, Tong JL, Li XY, Dong H, Zhang CY, Qian WX, Ma XC, Yi CH, Yi YX. Uncovering immune cell heterogeneity in hepatocellular carcinoma by combining single-cell RNA sequencing with T-cell receptor sequencing. World J Hepatol 2025; 17(2): 99046
- URL: https://www.wjgnet.com/1948-5182/full/v17/i2/99046.htm
- DOI: https://dx.doi.org/10.4254/wjh.v17.i2.99046


