Copyright
©The Author(s) 2025.
World J Hepatol. Feb 27, 2025; 17(2): 97741
Published online Feb 27, 2025. doi: 10.4254/wjh.v17.i2.97741
Published online Feb 27, 2025. doi: 10.4254/wjh.v17.i2.97741
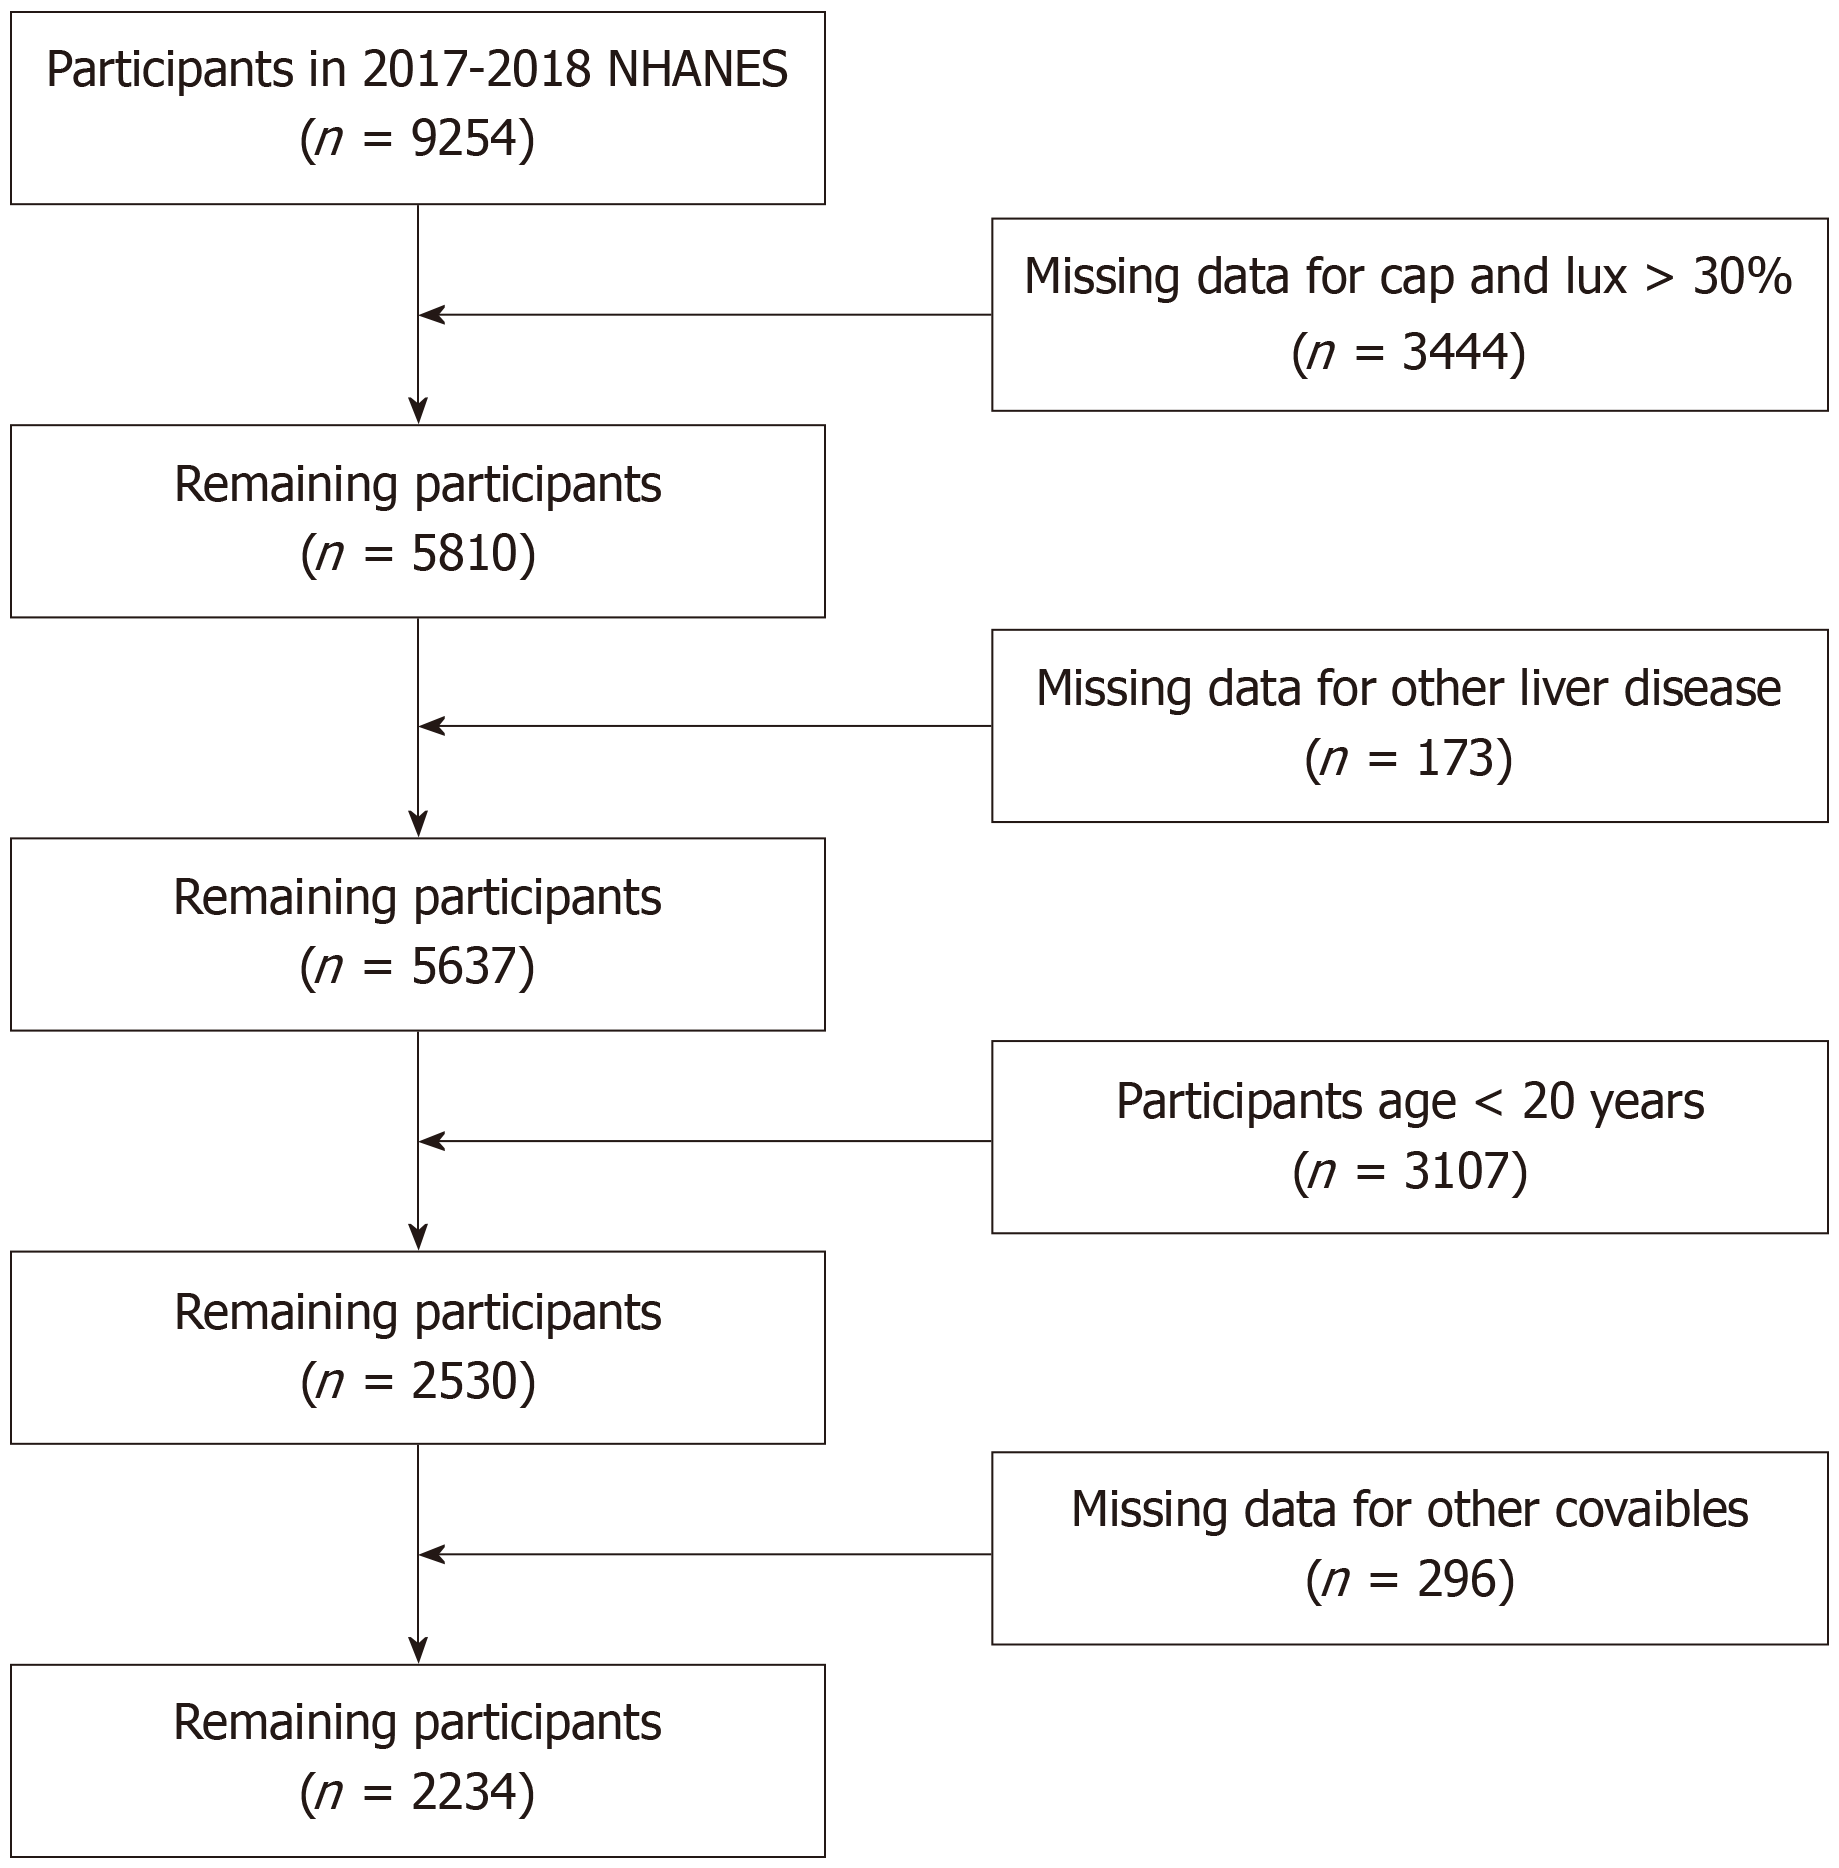
Figure 1
Flowchart of sample selection.
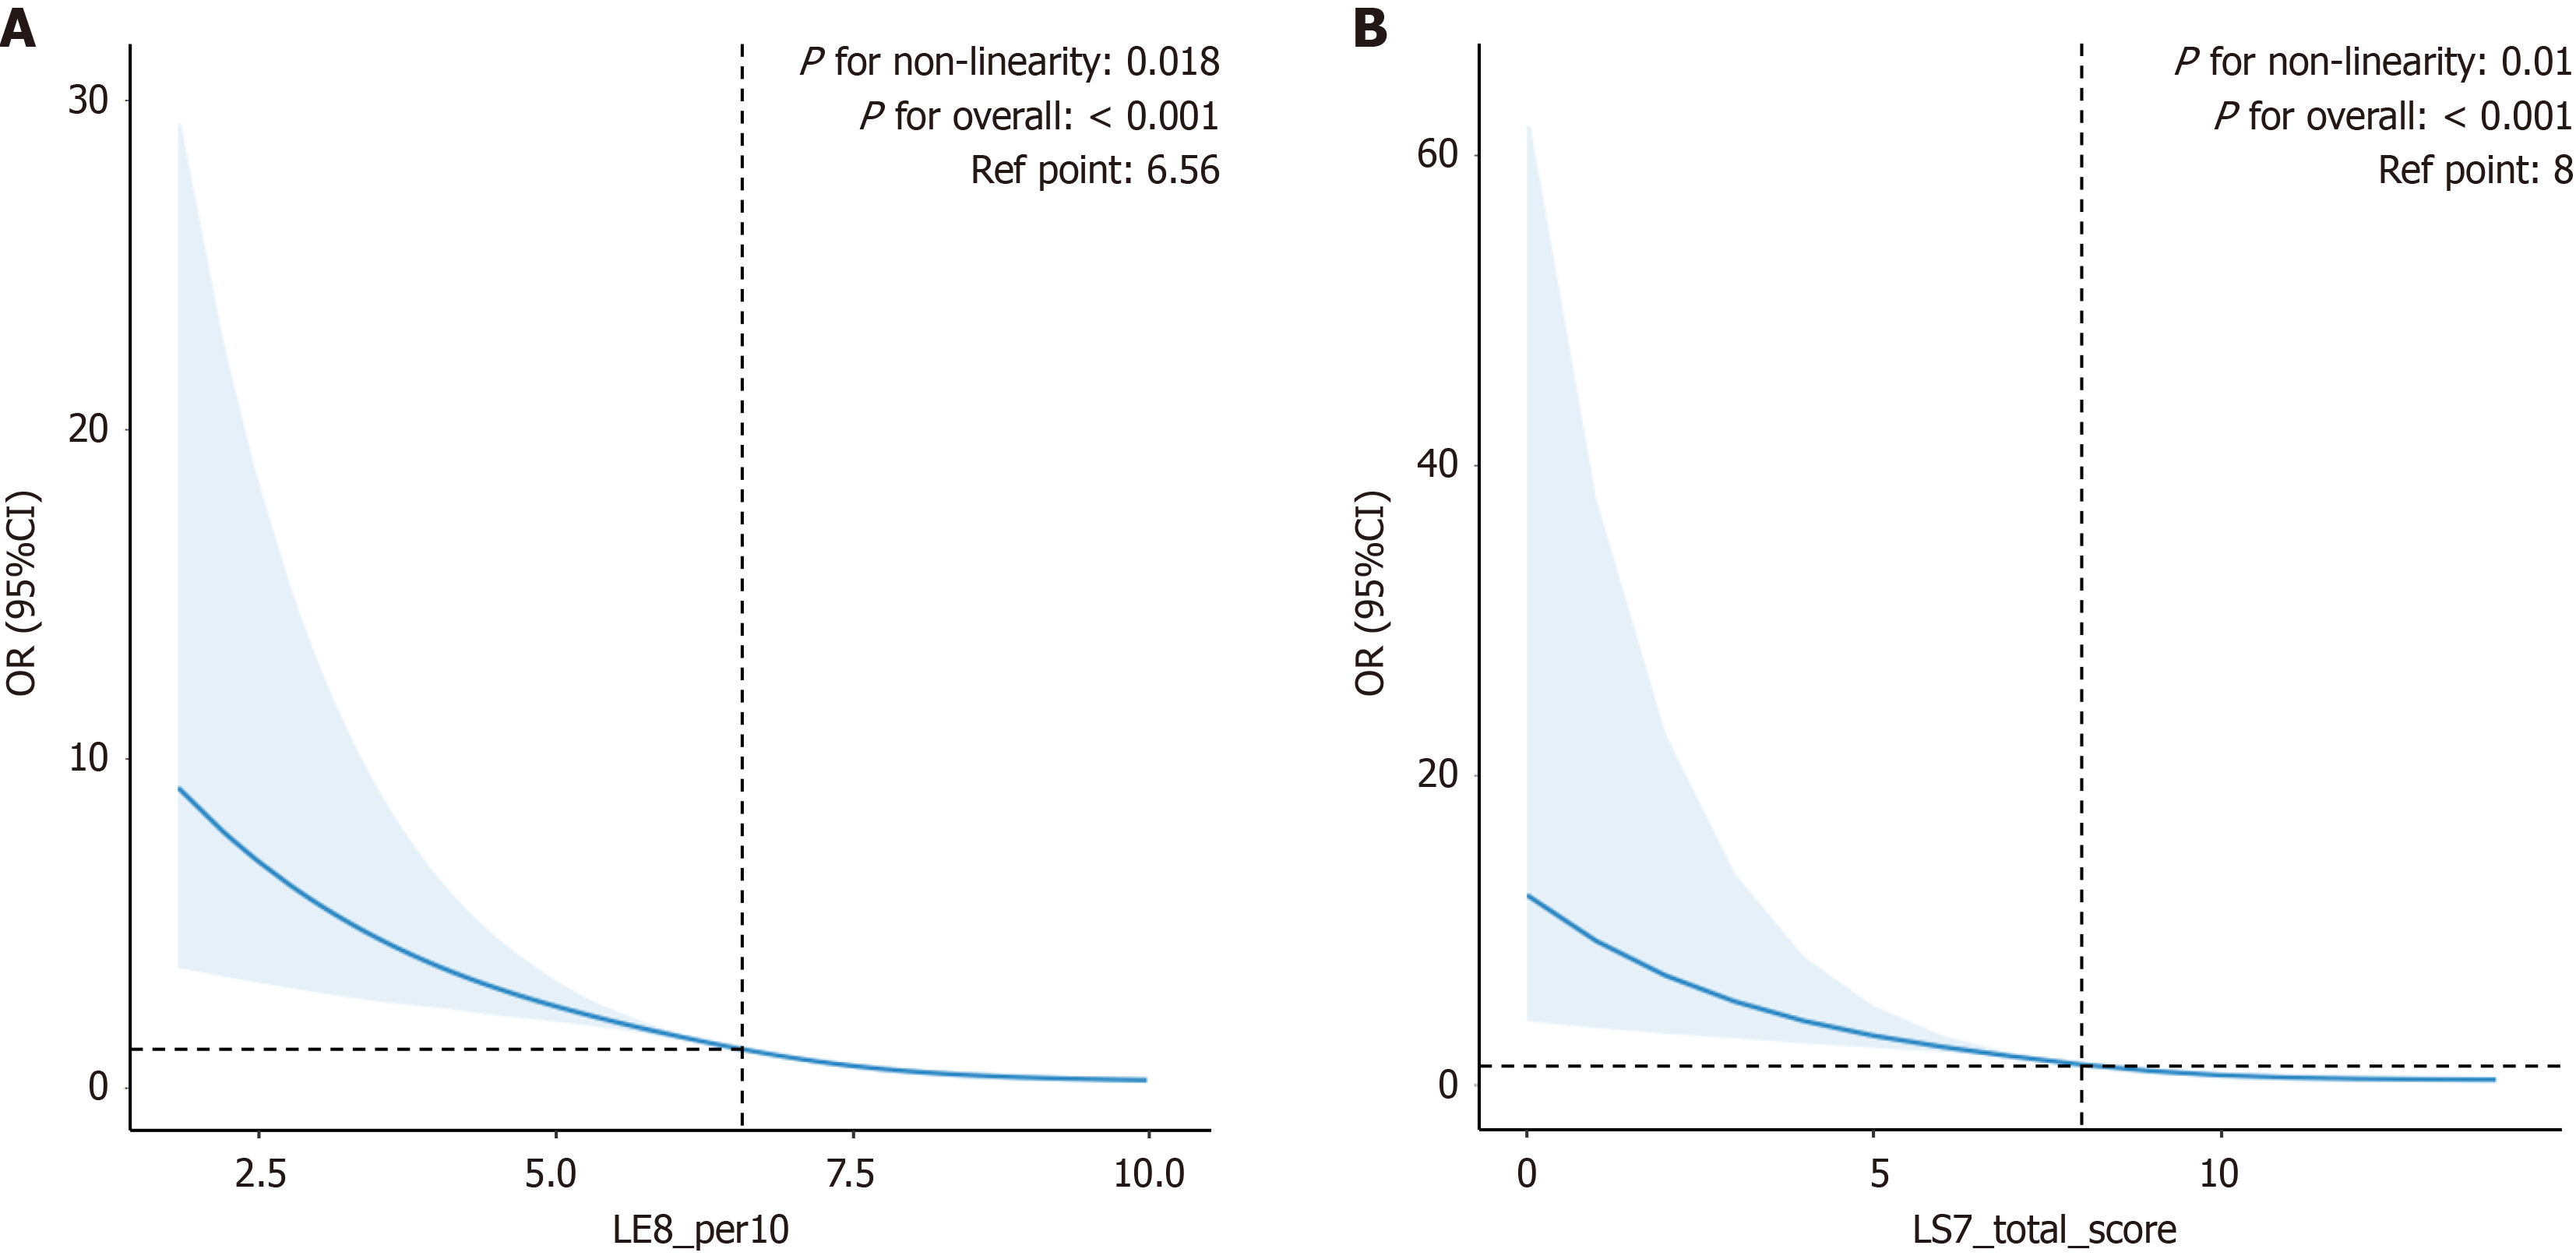
Figure 2 Curve fitting models for Life’s Essential 8 and Life’s Simple 7 in relation to metabolic-associated fatty liver disease risk (weighted).
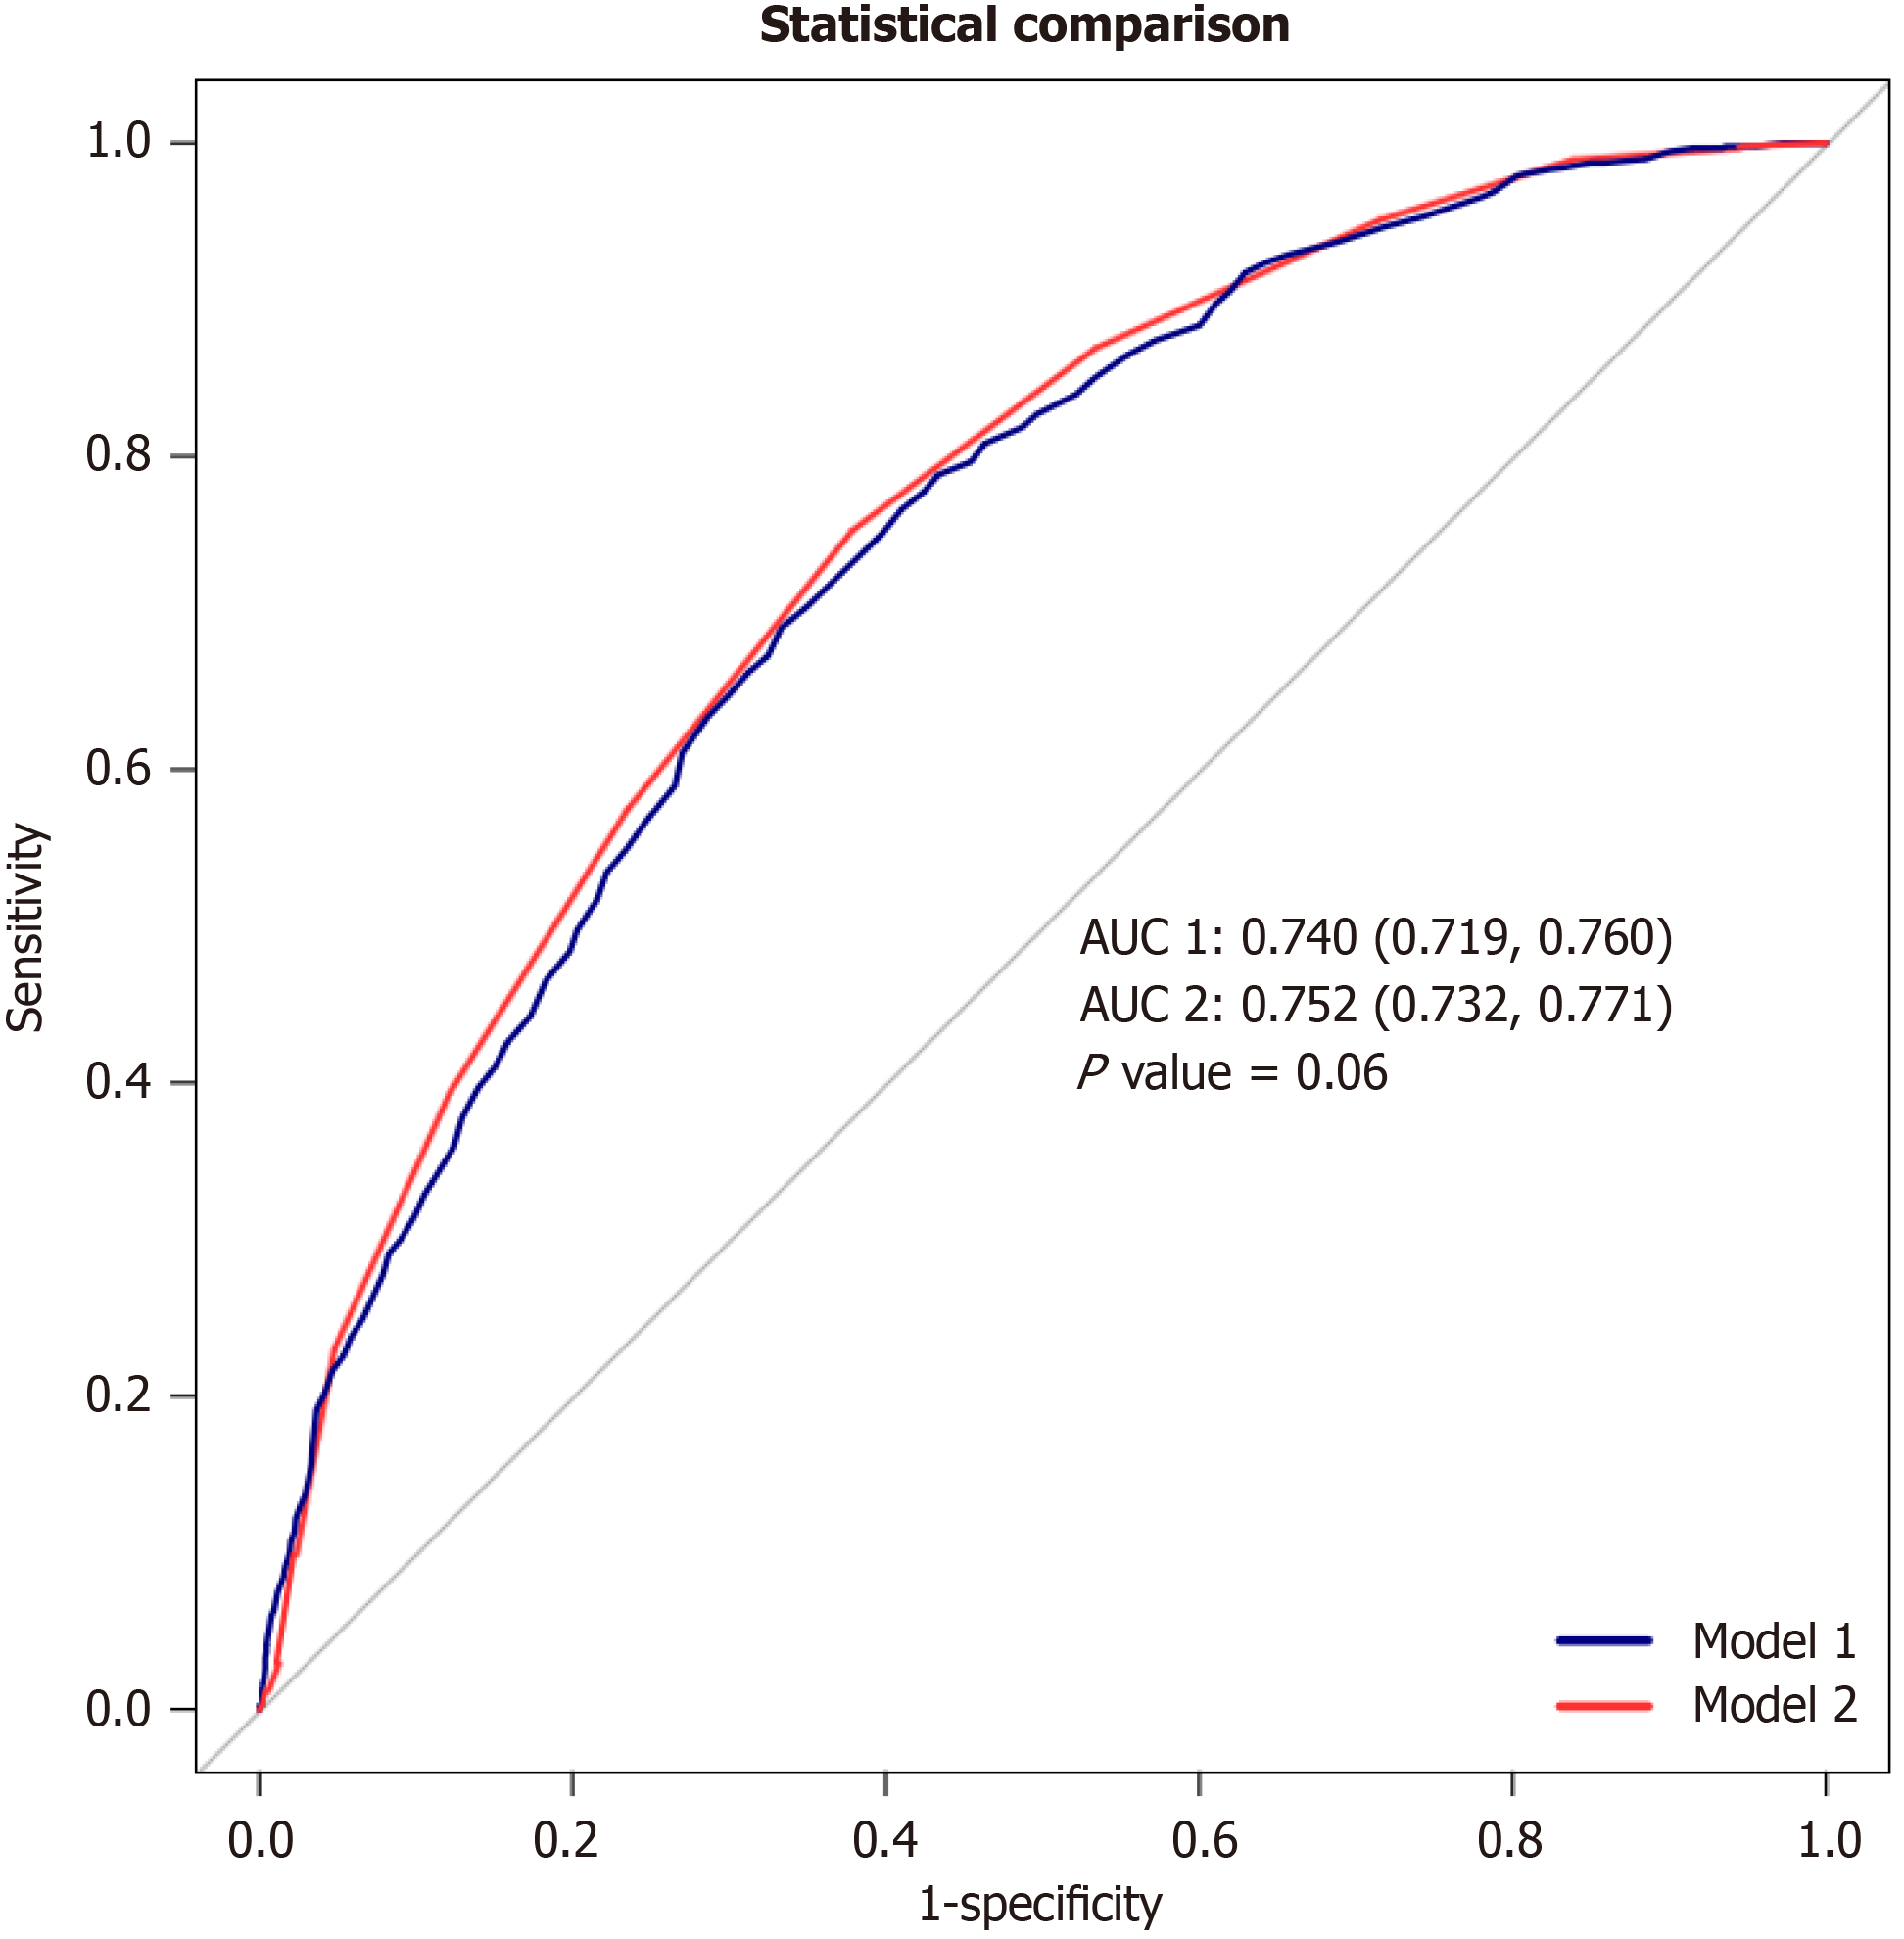
Figure 3
Receiver operating characteristic curve without accounting for weights.
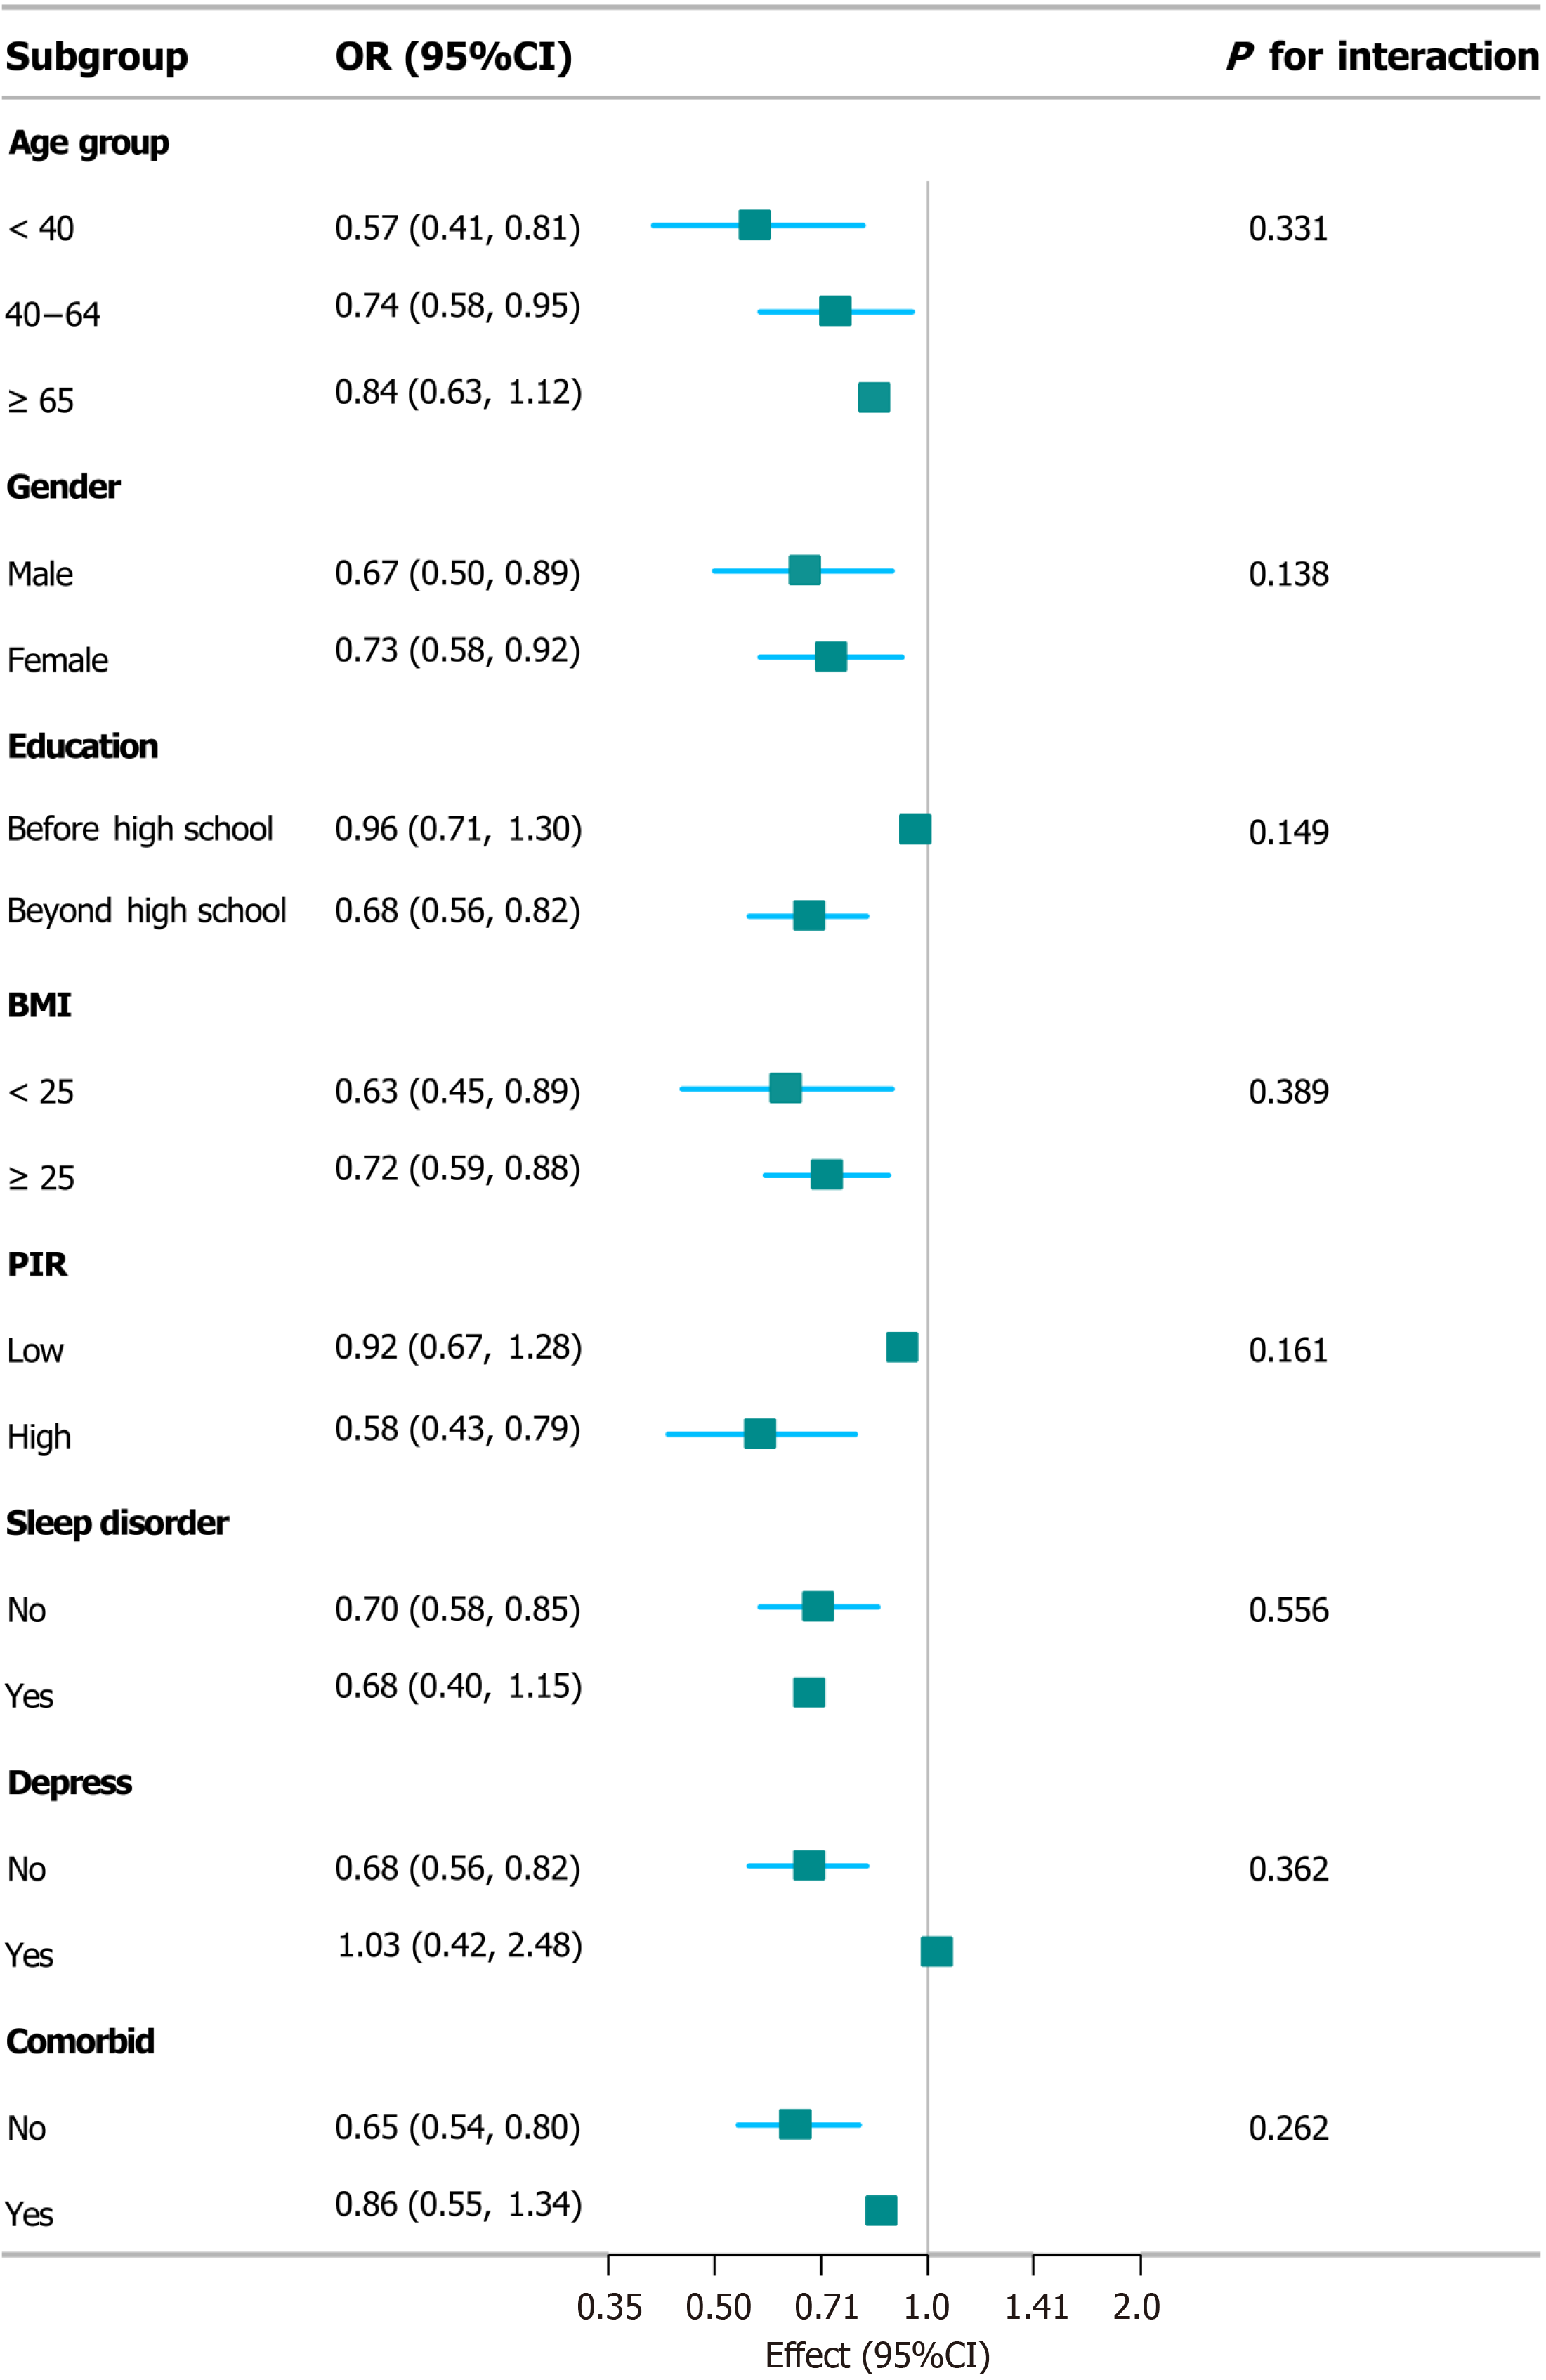
Figure 4
Forest plot of subgroup analysis and interaction tests for Life’s Essential 8 categories in relation to the risk of metabolic-associated fatty liver disease.
- Citation: Fu W, Cheng GB, Zhao JL, Lv LY, Ding Y. Association of Life’s Essential 8 and Life’s Simple 7 with metabolic-associated fatty liver disease in the United States. World J Hepatol 2025; 17(2): 97741
- URL: https://www.wjgnet.com/1948-5182/full/v17/i2/97741.htm
- DOI: https://dx.doi.org/10.4254/wjh.v17.i2.97741


