Copyright
©The Author(s) 2025.
World J Hepatol. Feb 27, 2025; 17(2): 95624
Published online Feb 27, 2025. doi: 10.4254/wjh.v17.i2.95624
Published online Feb 27, 2025. doi: 10.4254/wjh.v17.i2.95624
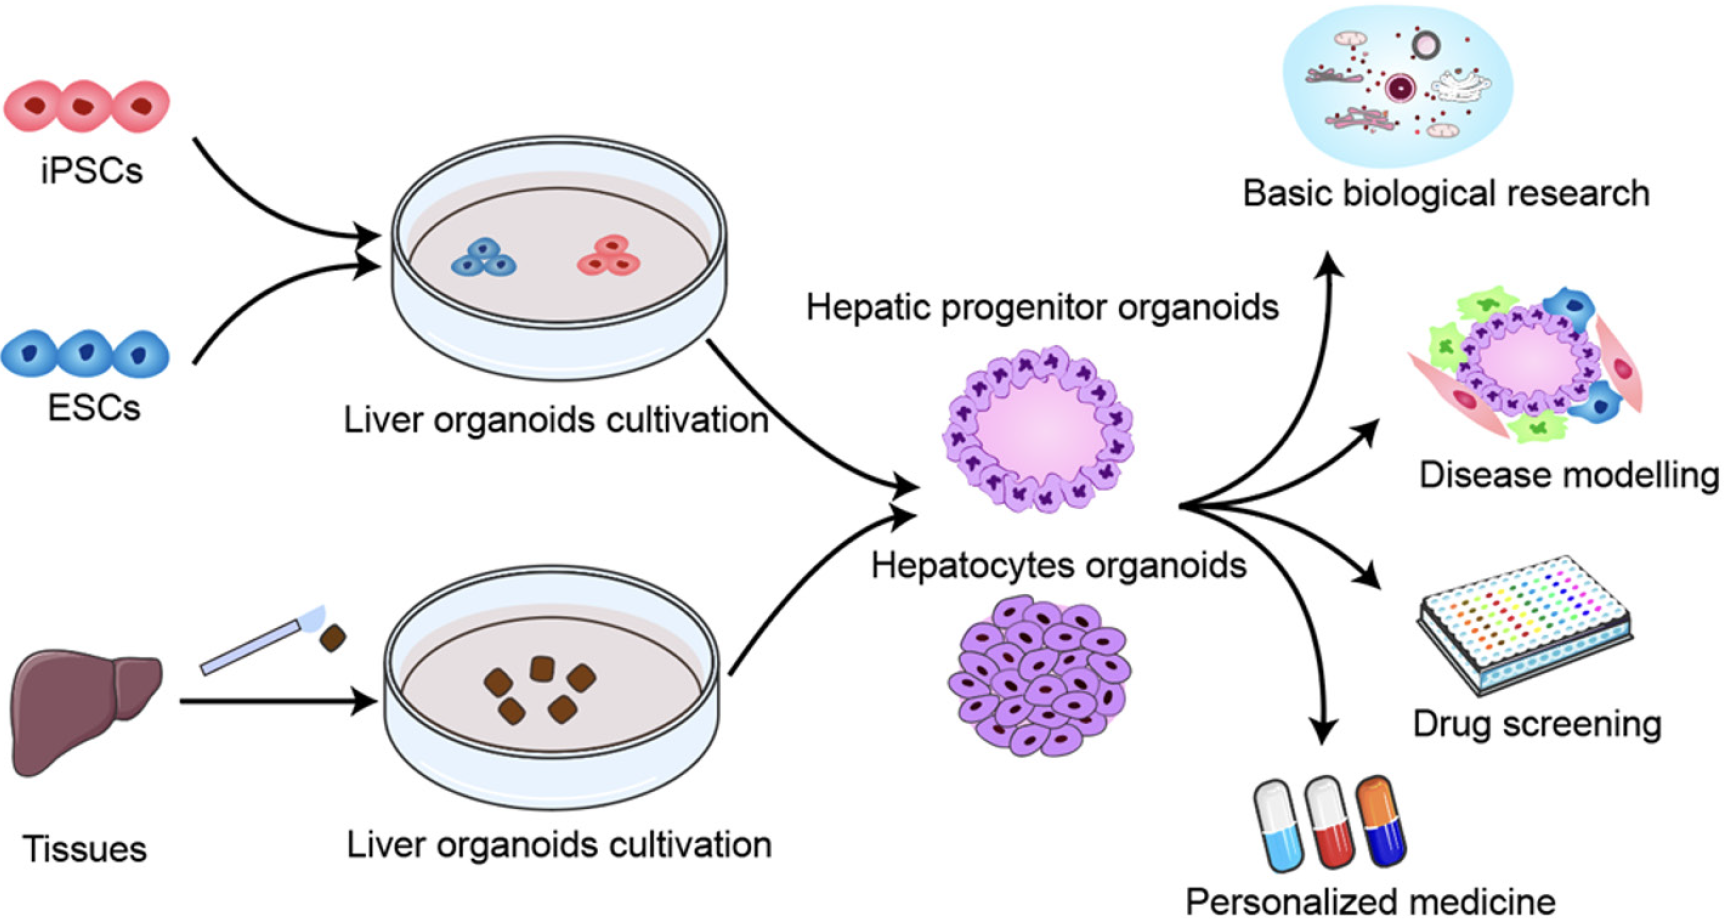
Figure 1 Diagram of hepatic organoid establishment and potential applications.
Hepatic organoid spheroids can be generated from induced pluripotent stem cells, embryonic stem cells, or primary liver tissues that undergo dissociation, differentiation, and reaggregation. Hepatic organoids have been used extensively for basic biology research, disease modelling, drug screening, and personalized medicine. ESCs: Embryonic stem cells; IPSCs: Induced pluripotent stem cells.
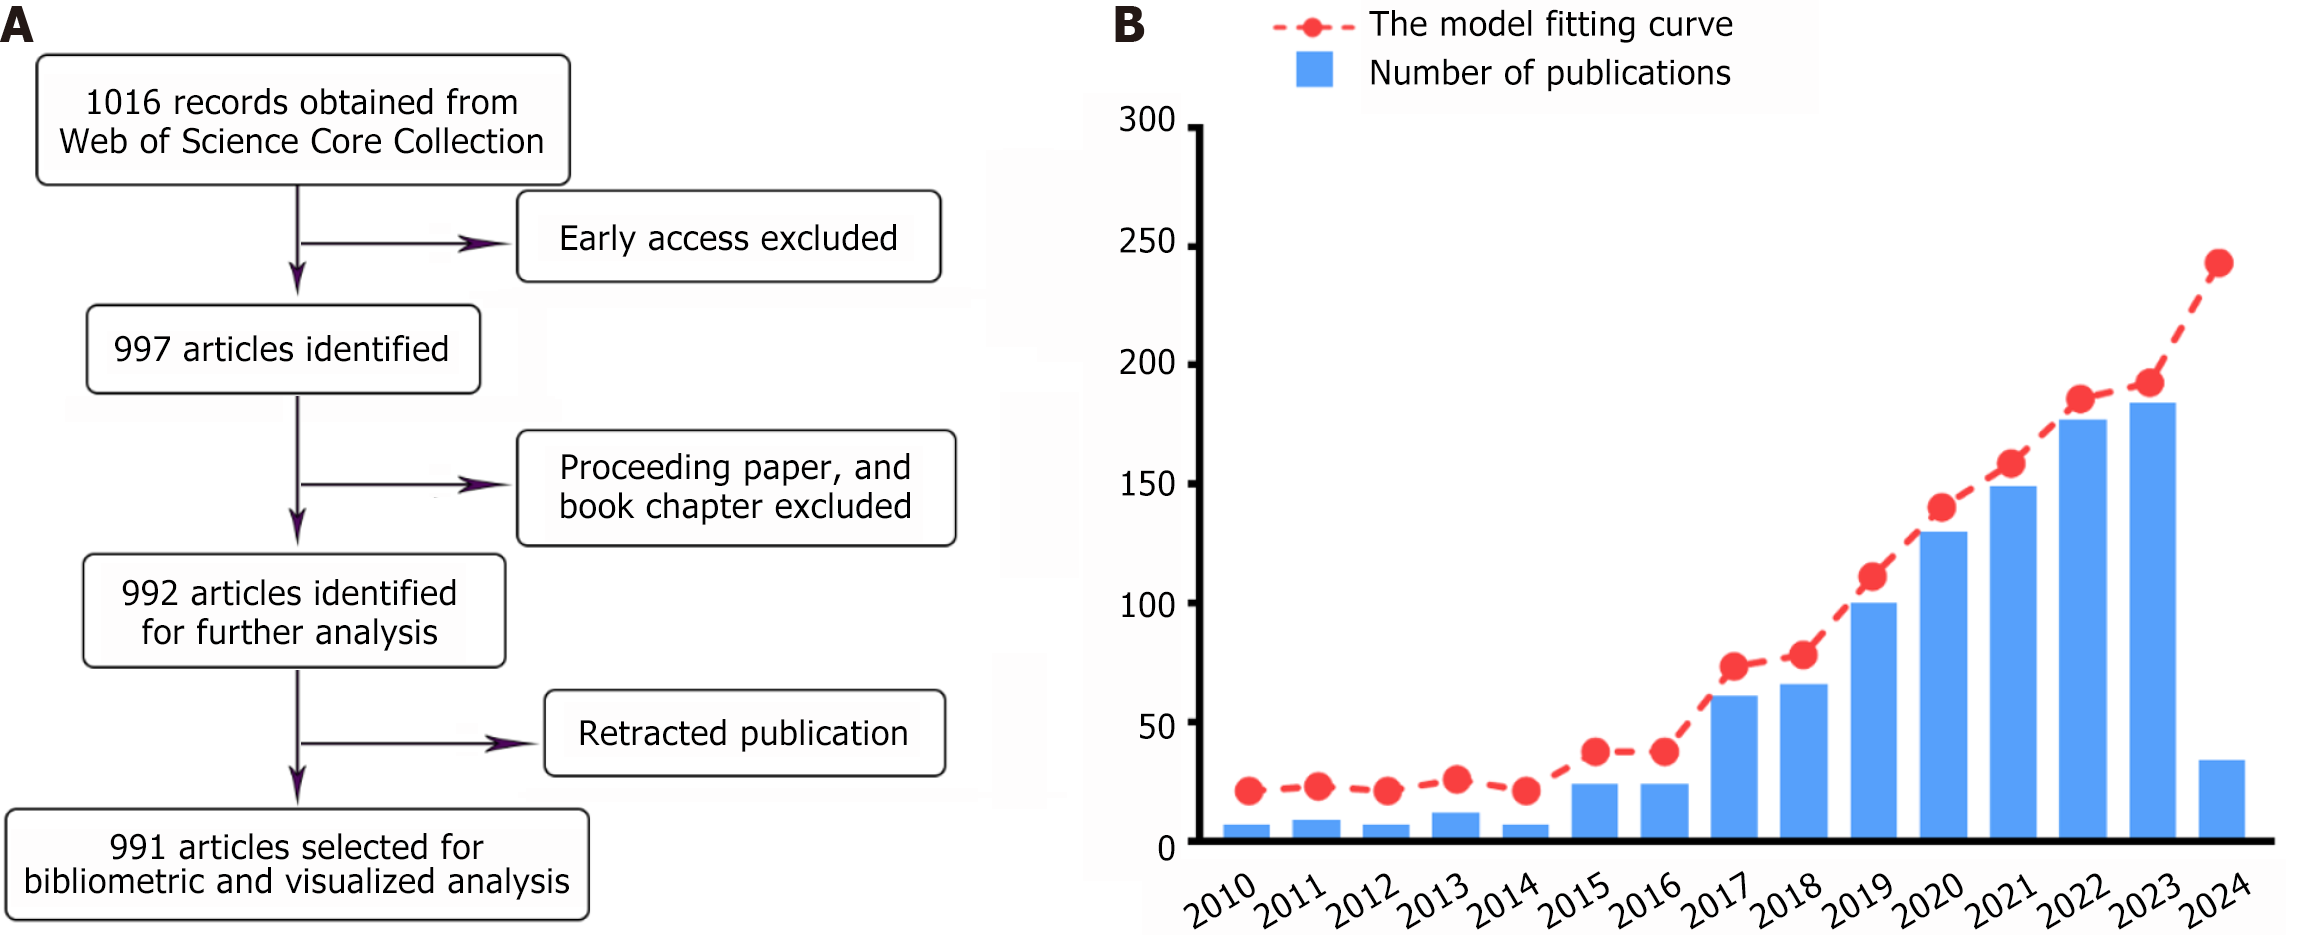
Figure 2 Article screening process and publication outputs in hepatic organoid research.
A: The systematic article screening process; B: The publication outputs in hepatic organoid research spanning from 2010 to 2024, along with the fitted curve representing the annual publication volume trends.
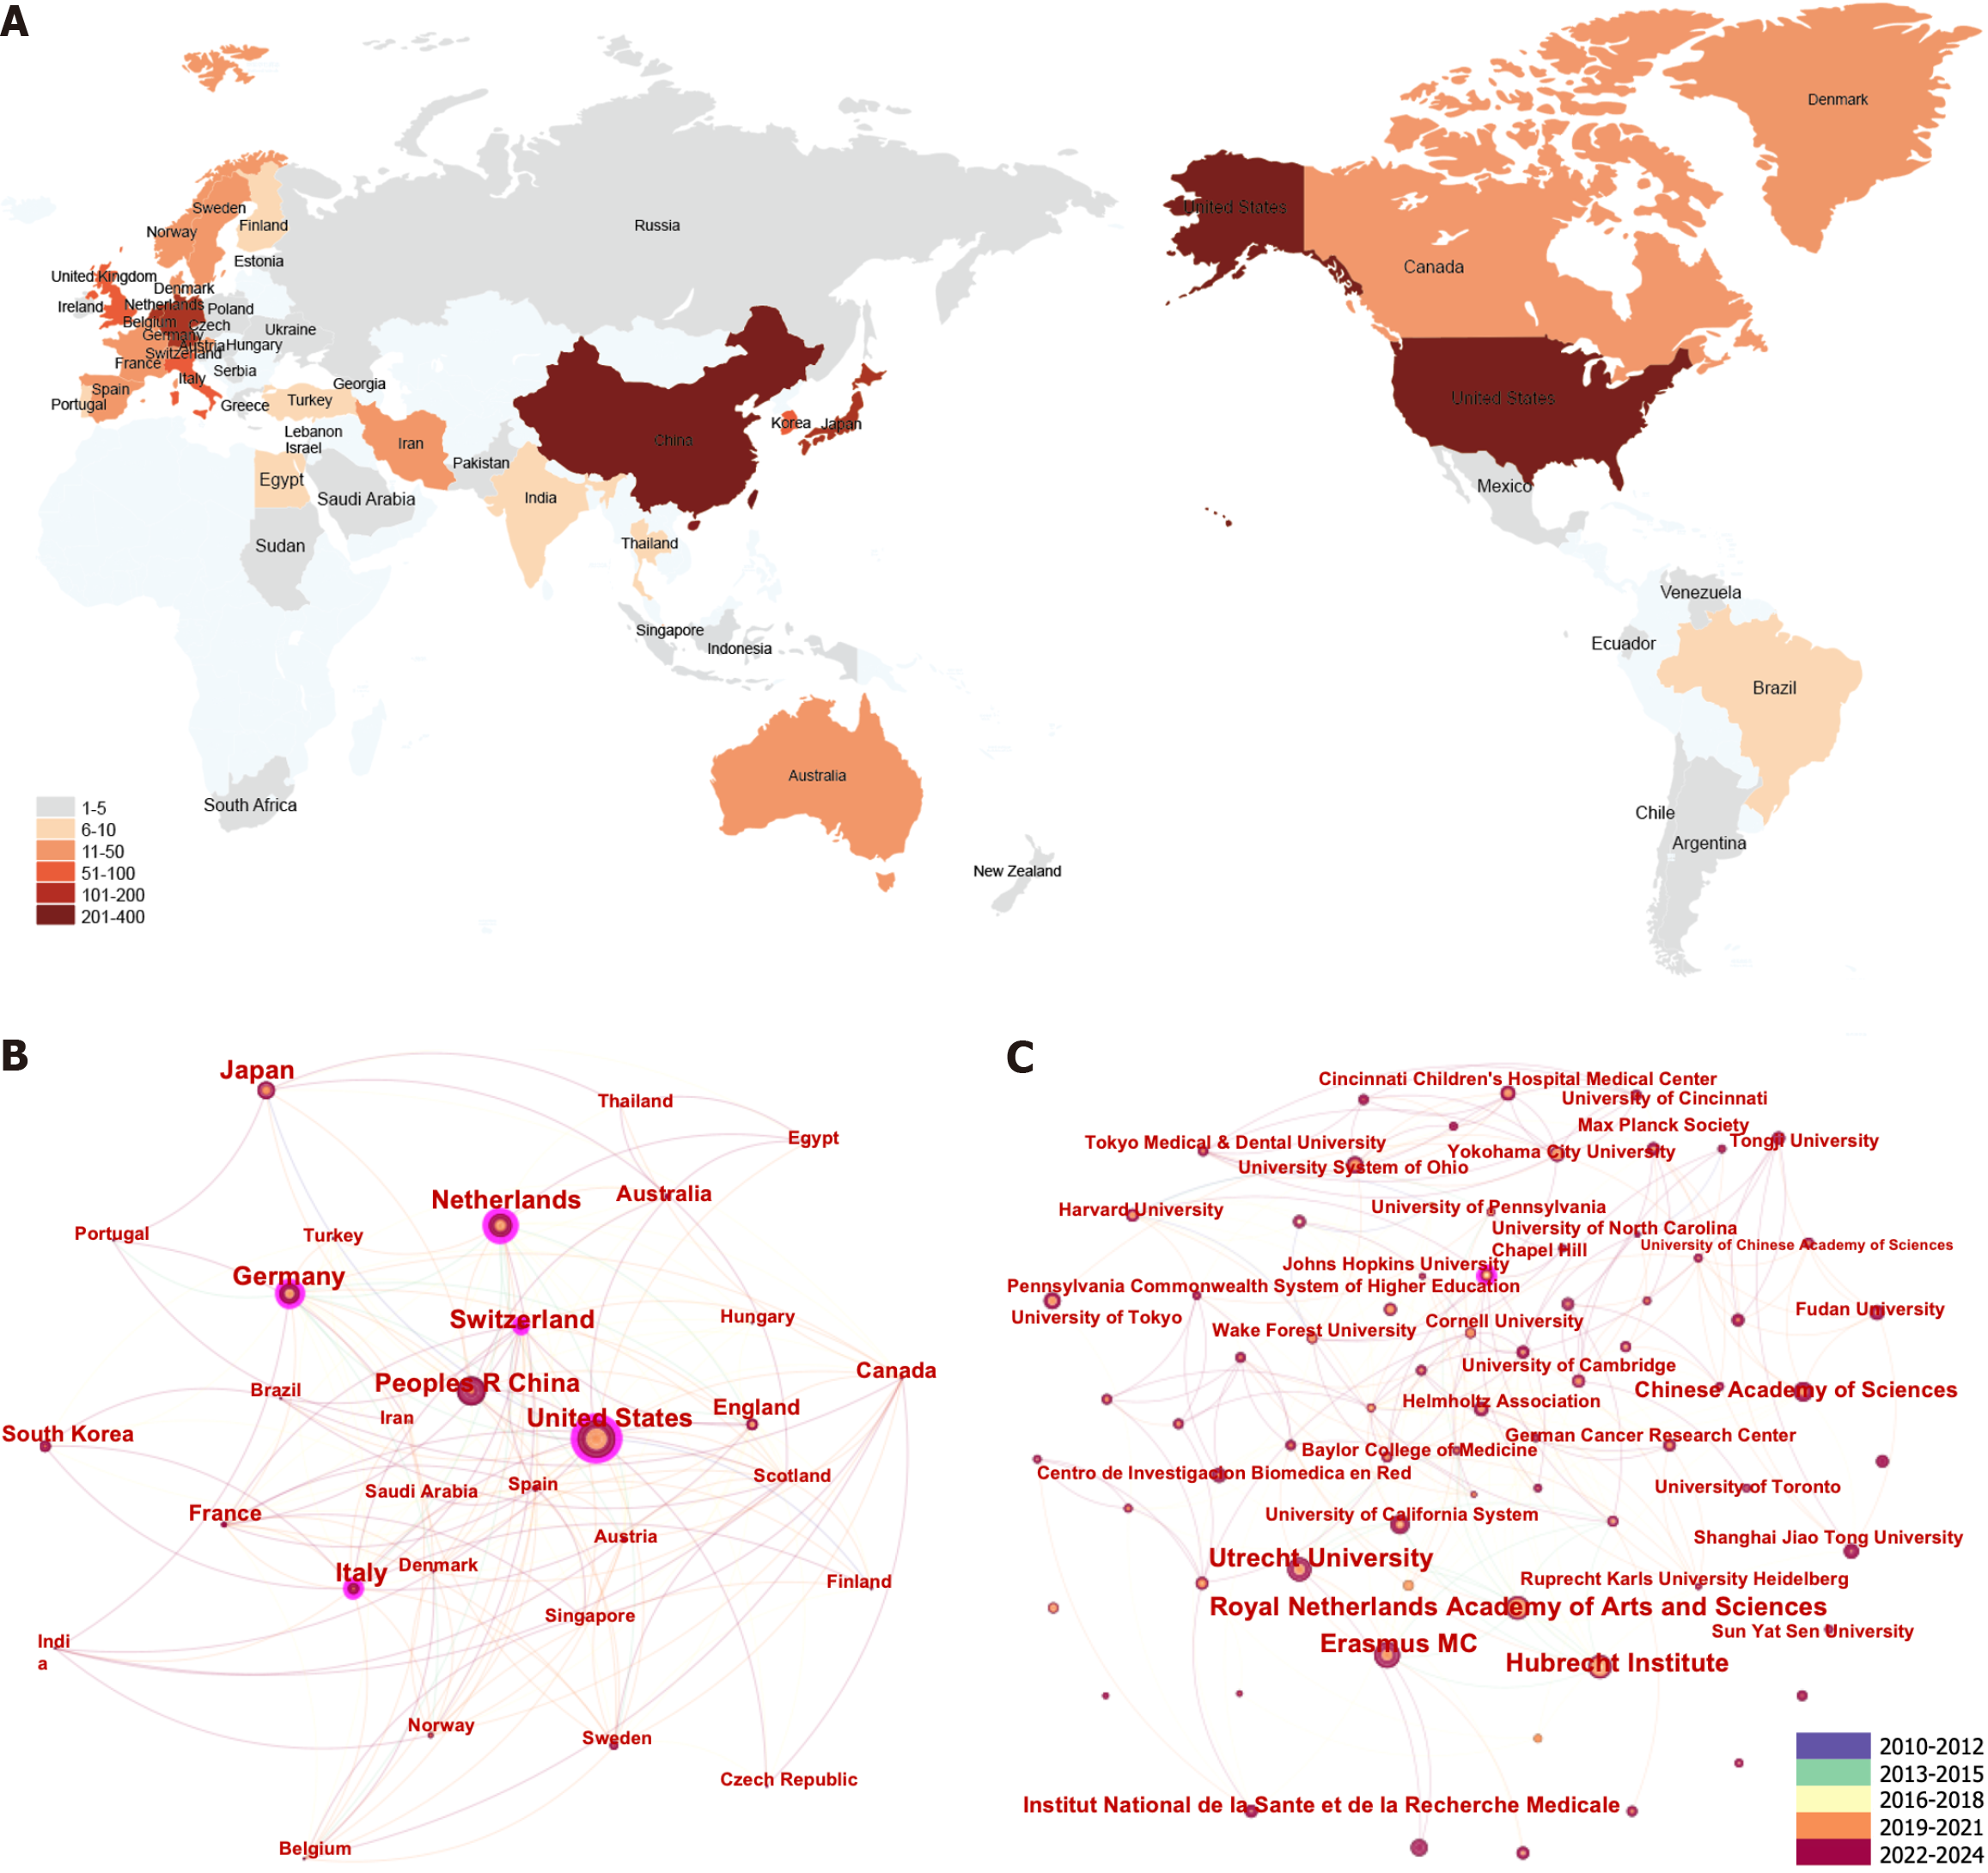
Figure 3 The distribution of countries and institutes involved in hepatic organoid research.
A: The world map depicting the contribution of each country on the basis of publication count; B: The international collaboration network in hepatic organoid research; C: The institutional collaboration network in hepatic organoid research. Each node represents a country or institute, and each link reflects a collaboration. The colours of different nodes are based on the average year countries and institutes published their articles.
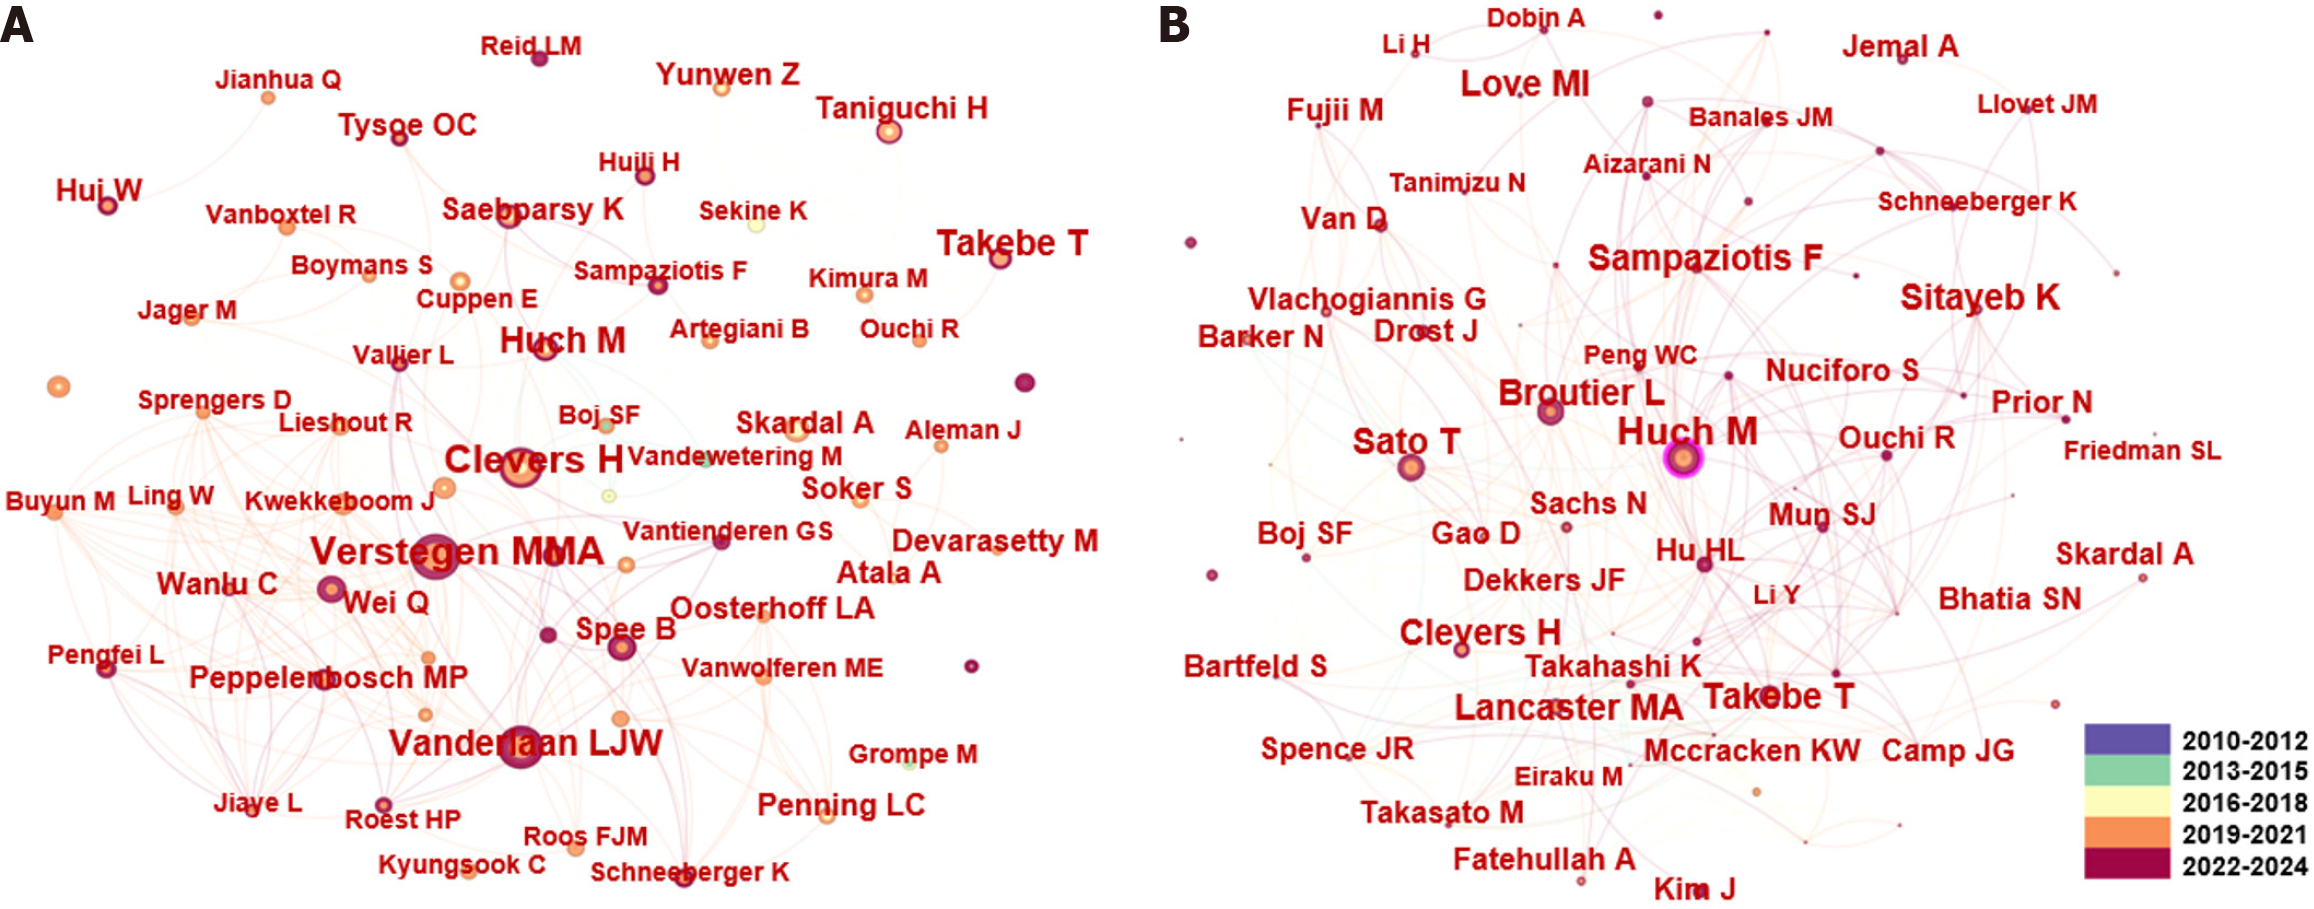
Figure 4 Author and cocited author collaboration network in hepatic organoid research.
A: Author collaboration network in hepatic organoid research; B: Cocited author collaboration network in hepatic organoid research. Each node represents an author, and each link reflects a collaboration. The colours of different nodes are based on the average year the authors published their articles.
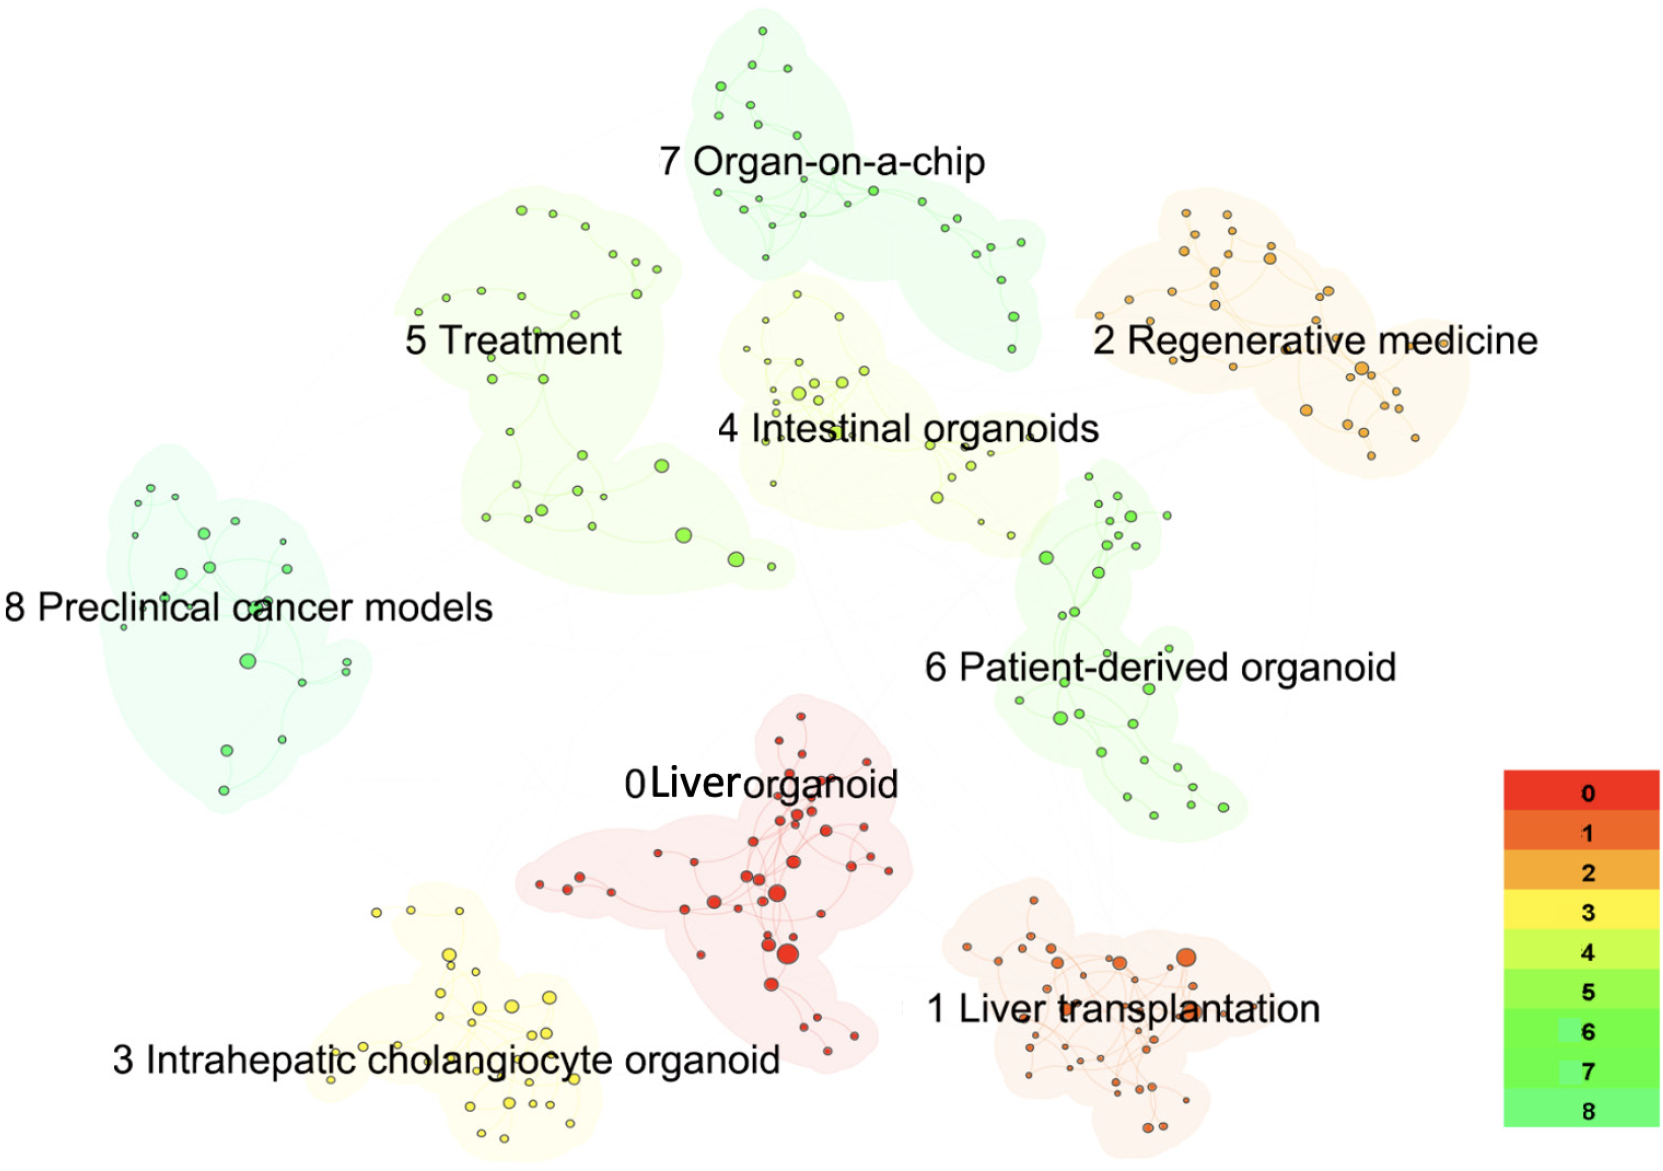
Figure 5 Cluster analysis of the cocited reference network in hepatic organoid research.
Each coloured outline represents a cluster. The colours of different clusters are based on the average year in which similar articles were cited.
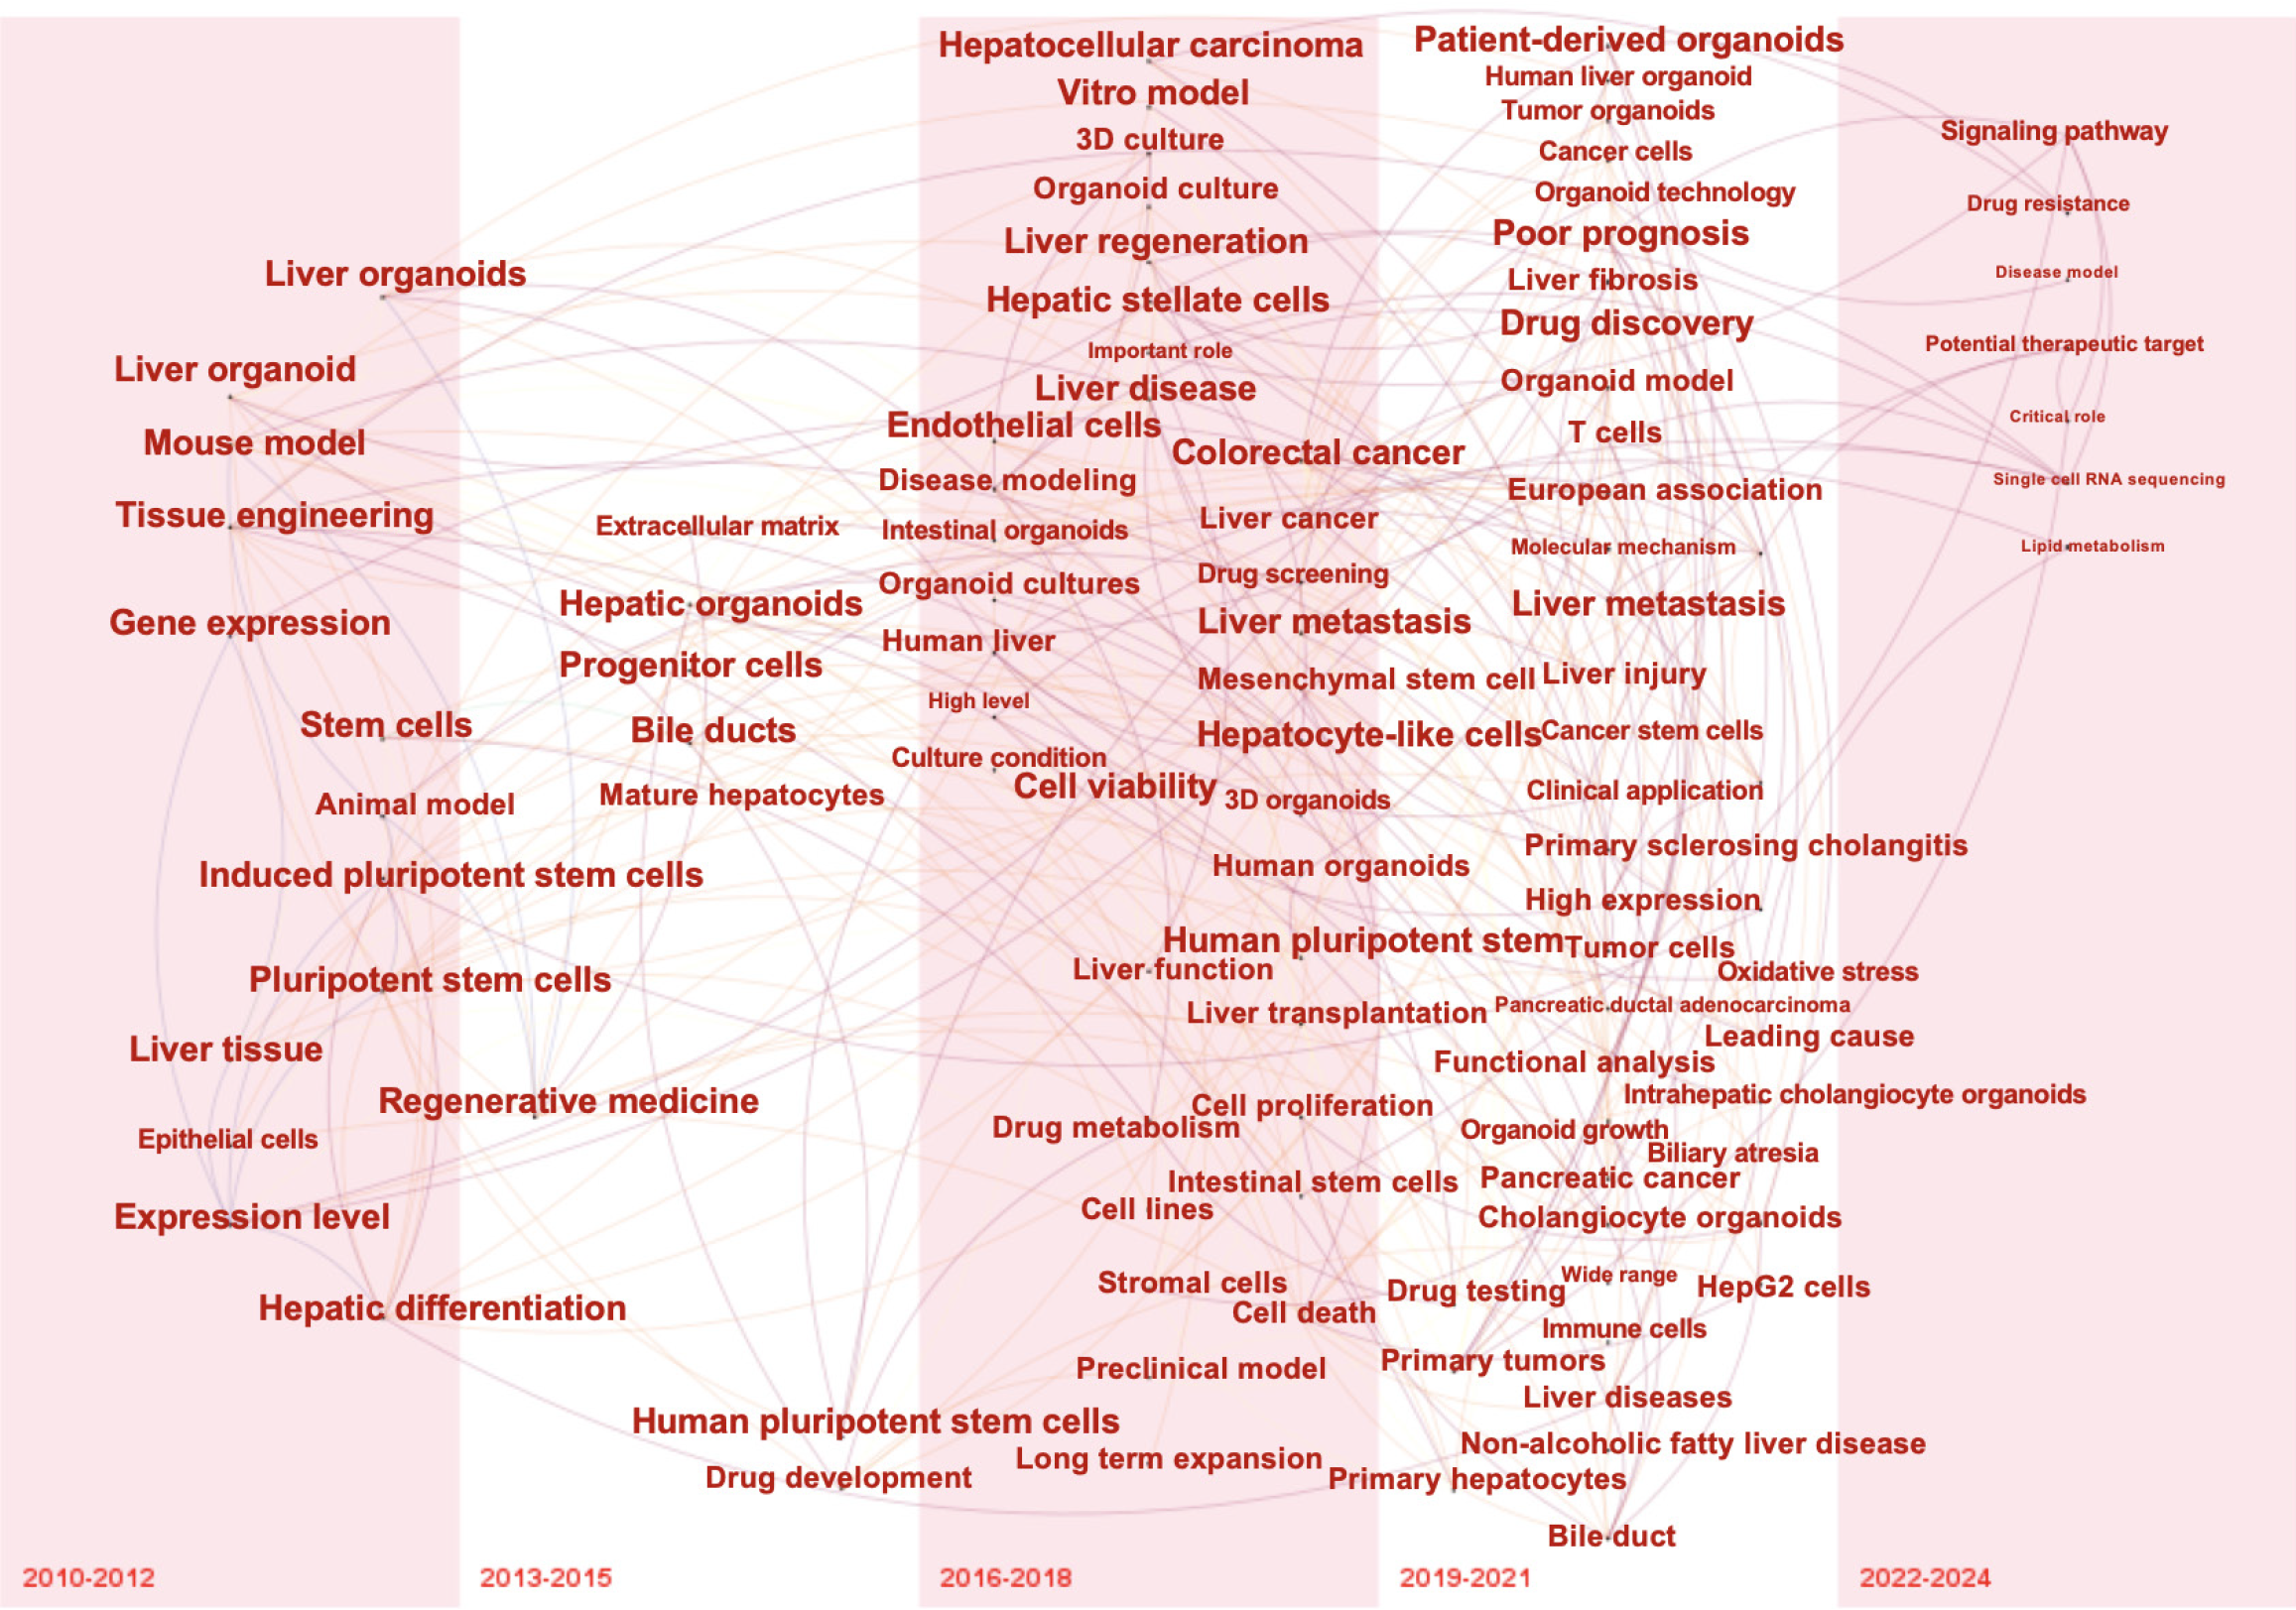
Figure 6 Time zone visualization of co-occurring term networks in hepatic organoid research.
Each node represents a term, and each link reflects a term shift over time. 3D: Three-dimensional.
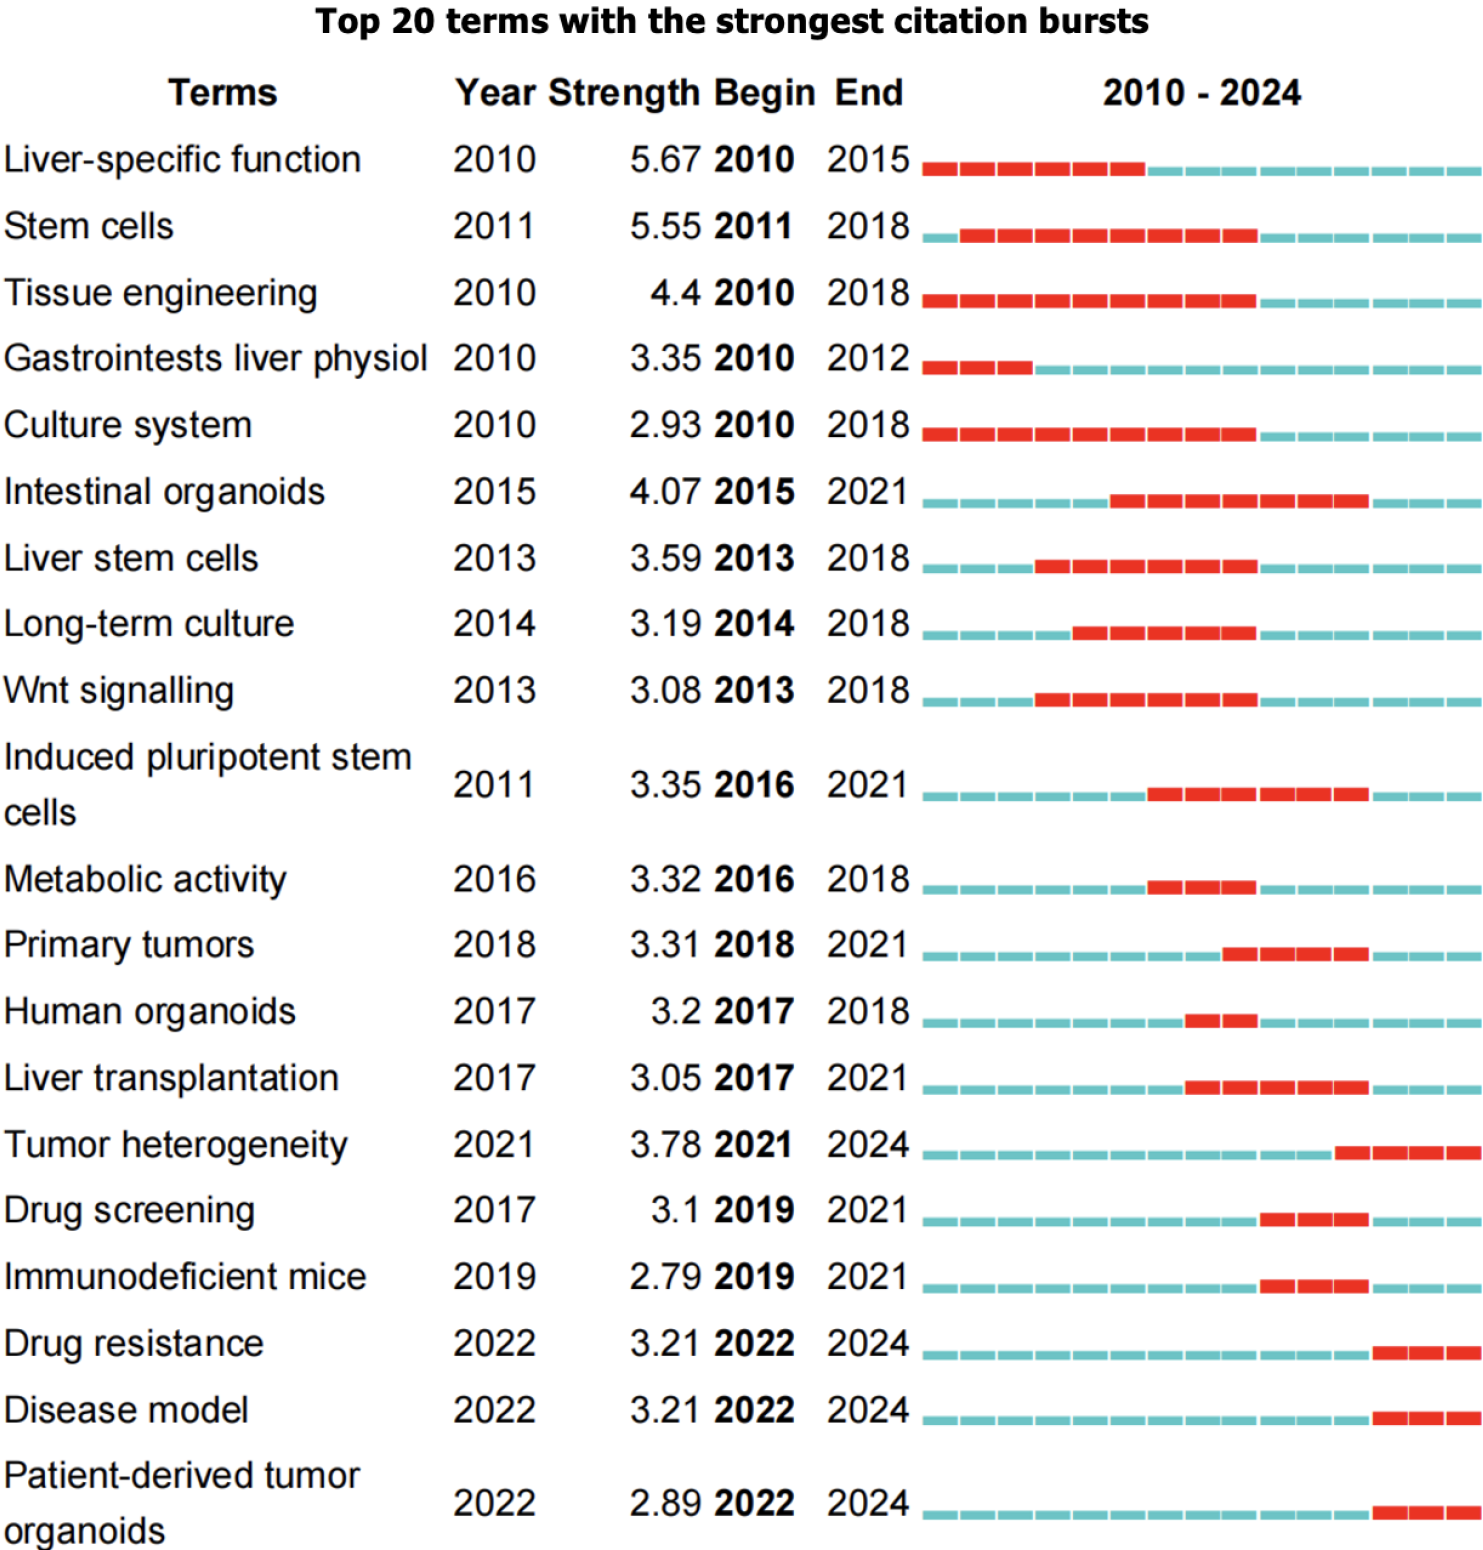
Figure 7 The top 20 terms with the strongest citation bursts in hepatic organoid research.
The green line represents the time interval and the red line represents the period of citation bursts.
- Citation: Li T, Bo RQ, Yan J, Johnson NL, Liao MT, Li Y, Chen Y, Lin J, Li J, Chu FH, Ding X. Global landscape of hepatic organoid research: A bibliometric and visual study. World J Hepatol 2025; 17(2): 95624
- URL: https://www.wjgnet.com/1948-5182/full/v17/i2/95624.htm
- DOI: https://dx.doi.org/10.4254/wjh.v17.i2.95624


