Copyright
©The Author(s) 2024.
World J Hepatol. Aug 27, 2024; 16(8): 1156-1166
Published online Aug 27, 2024. doi: 10.4254/wjh.v16.i8.1156
Published online Aug 27, 2024. doi: 10.4254/wjh.v16.i8.1156
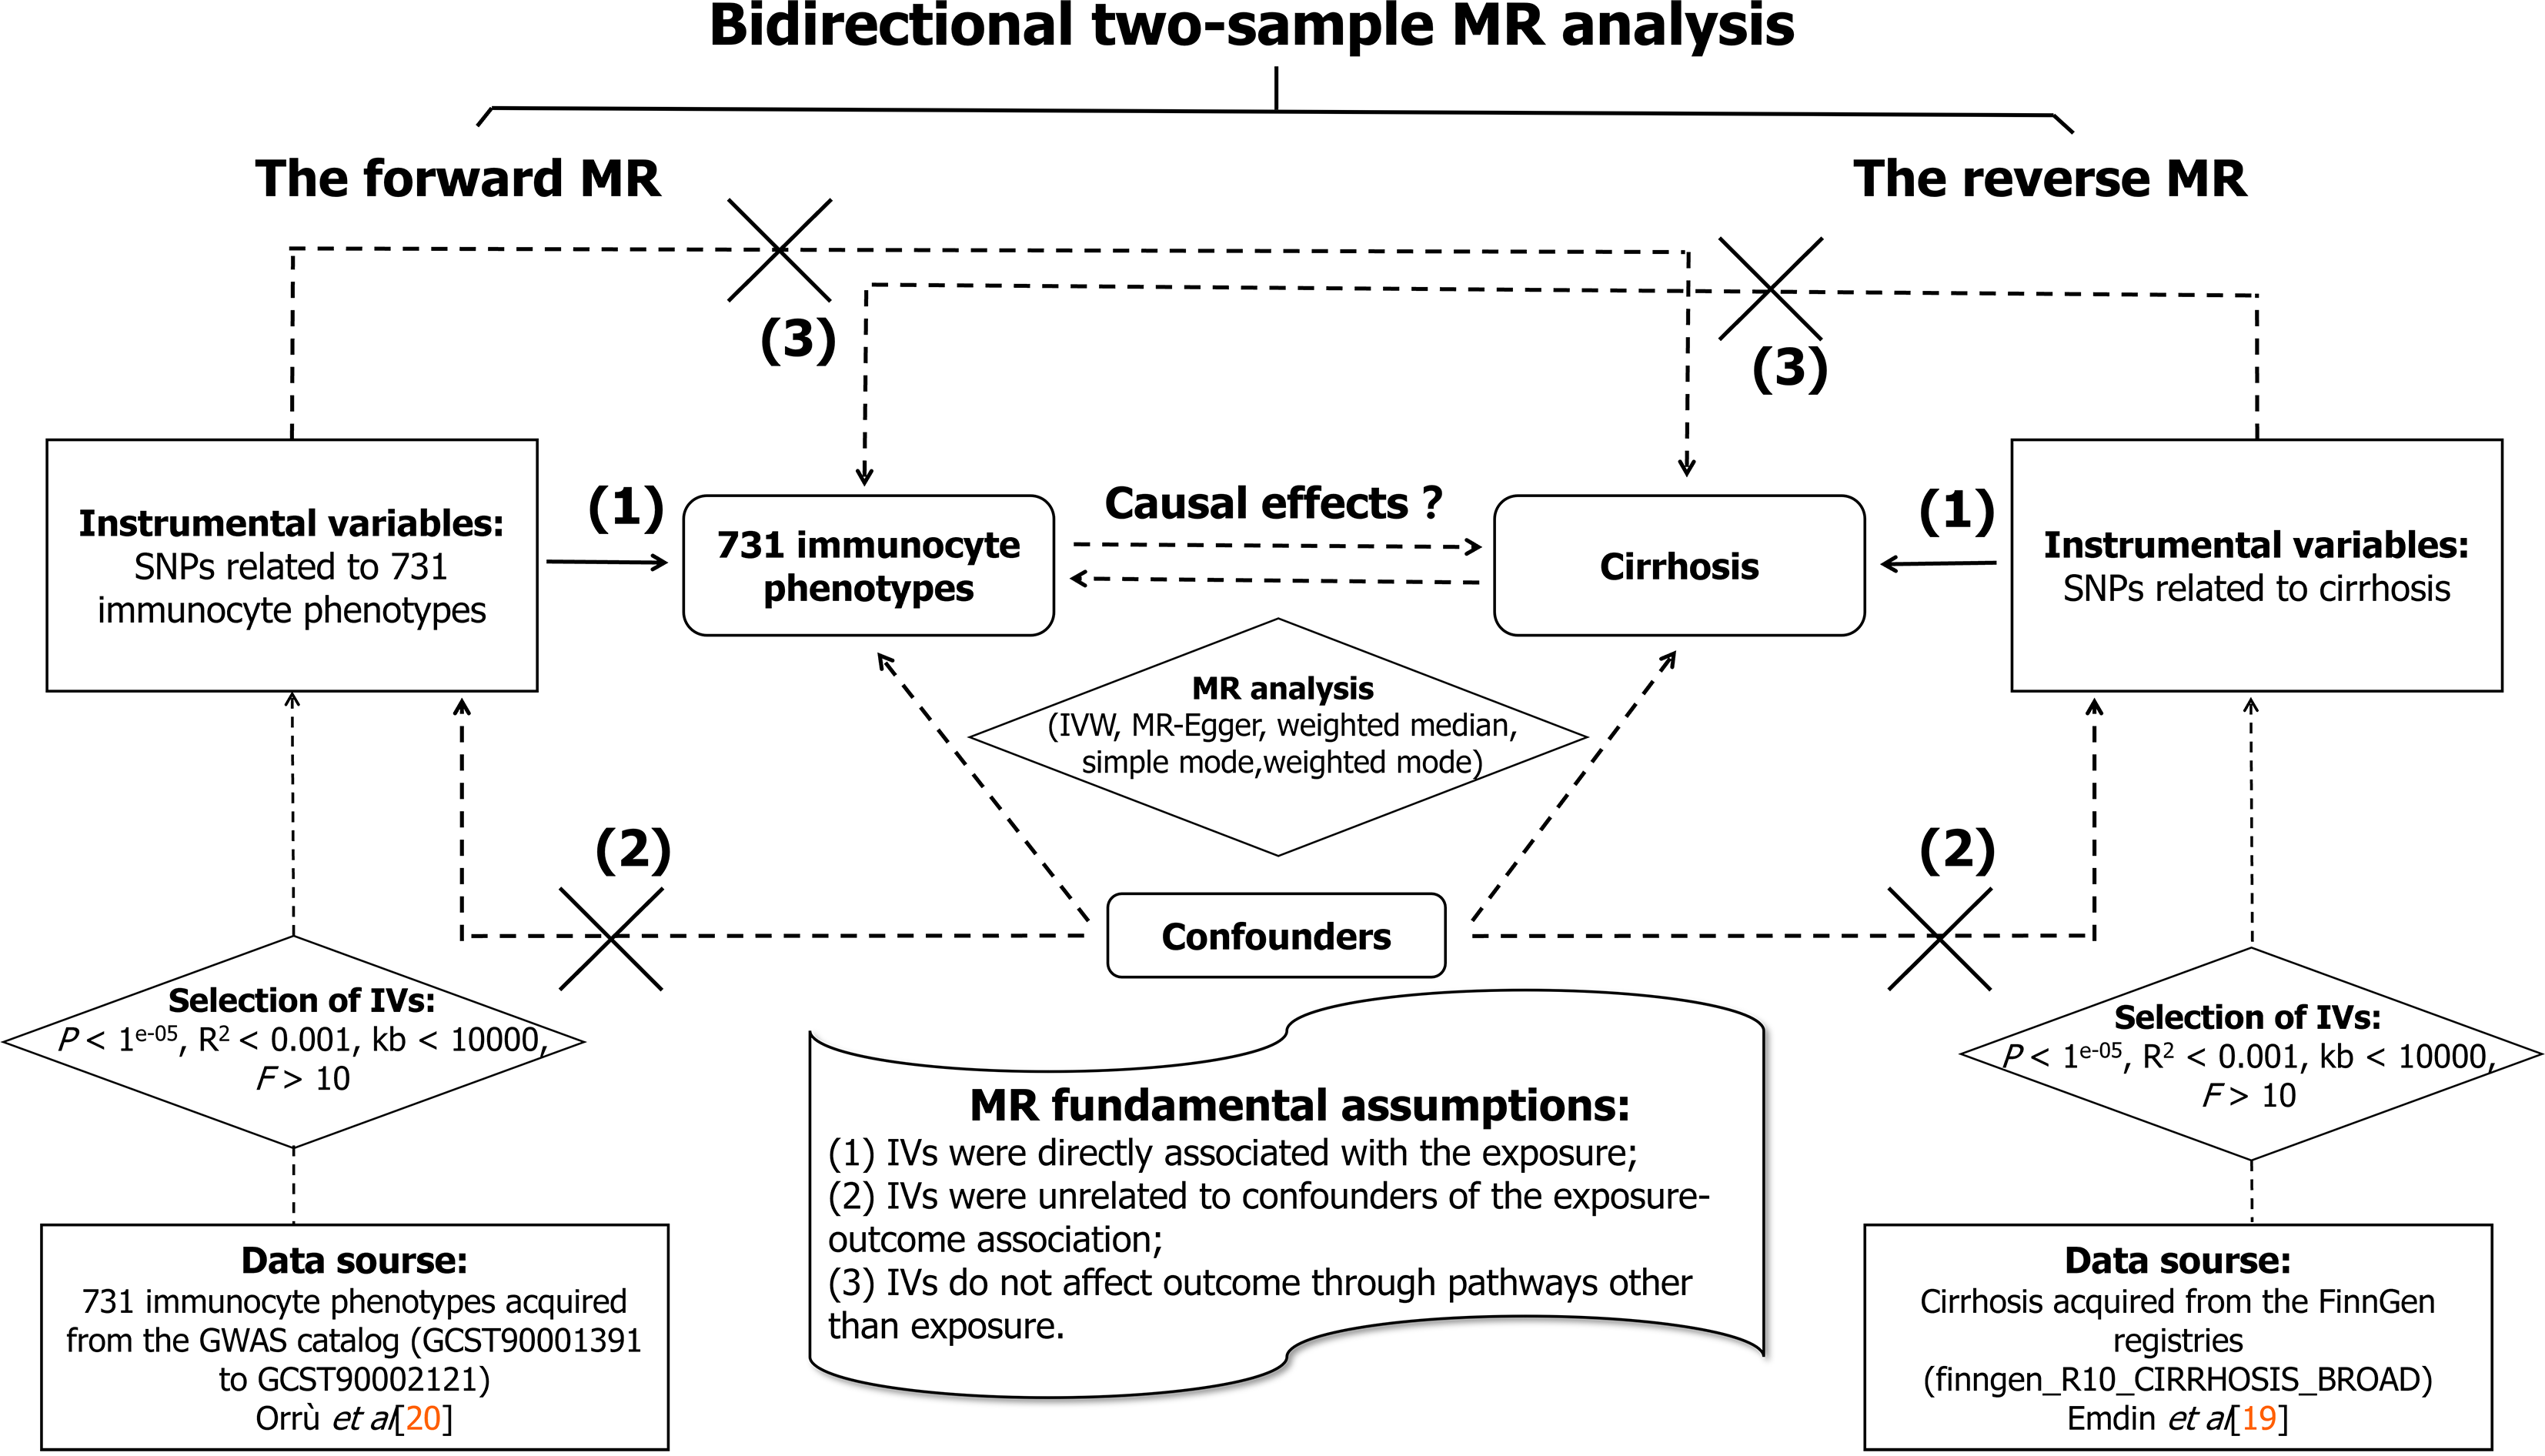
Figure 1 Diagram of this bidirectional mendelian randomization study design.
The arrows indicate bidirectional causal relationships between liver cirrhosis and immunocyte phenotypes, and the causal pathway is blocked if a “fork” is placed in the arrowed line. IVW: Inverse variance weighting; MR: Mendelian randomization; SNPs: Single-nucleotide polymorphisms; IVs: Instrumental variables.
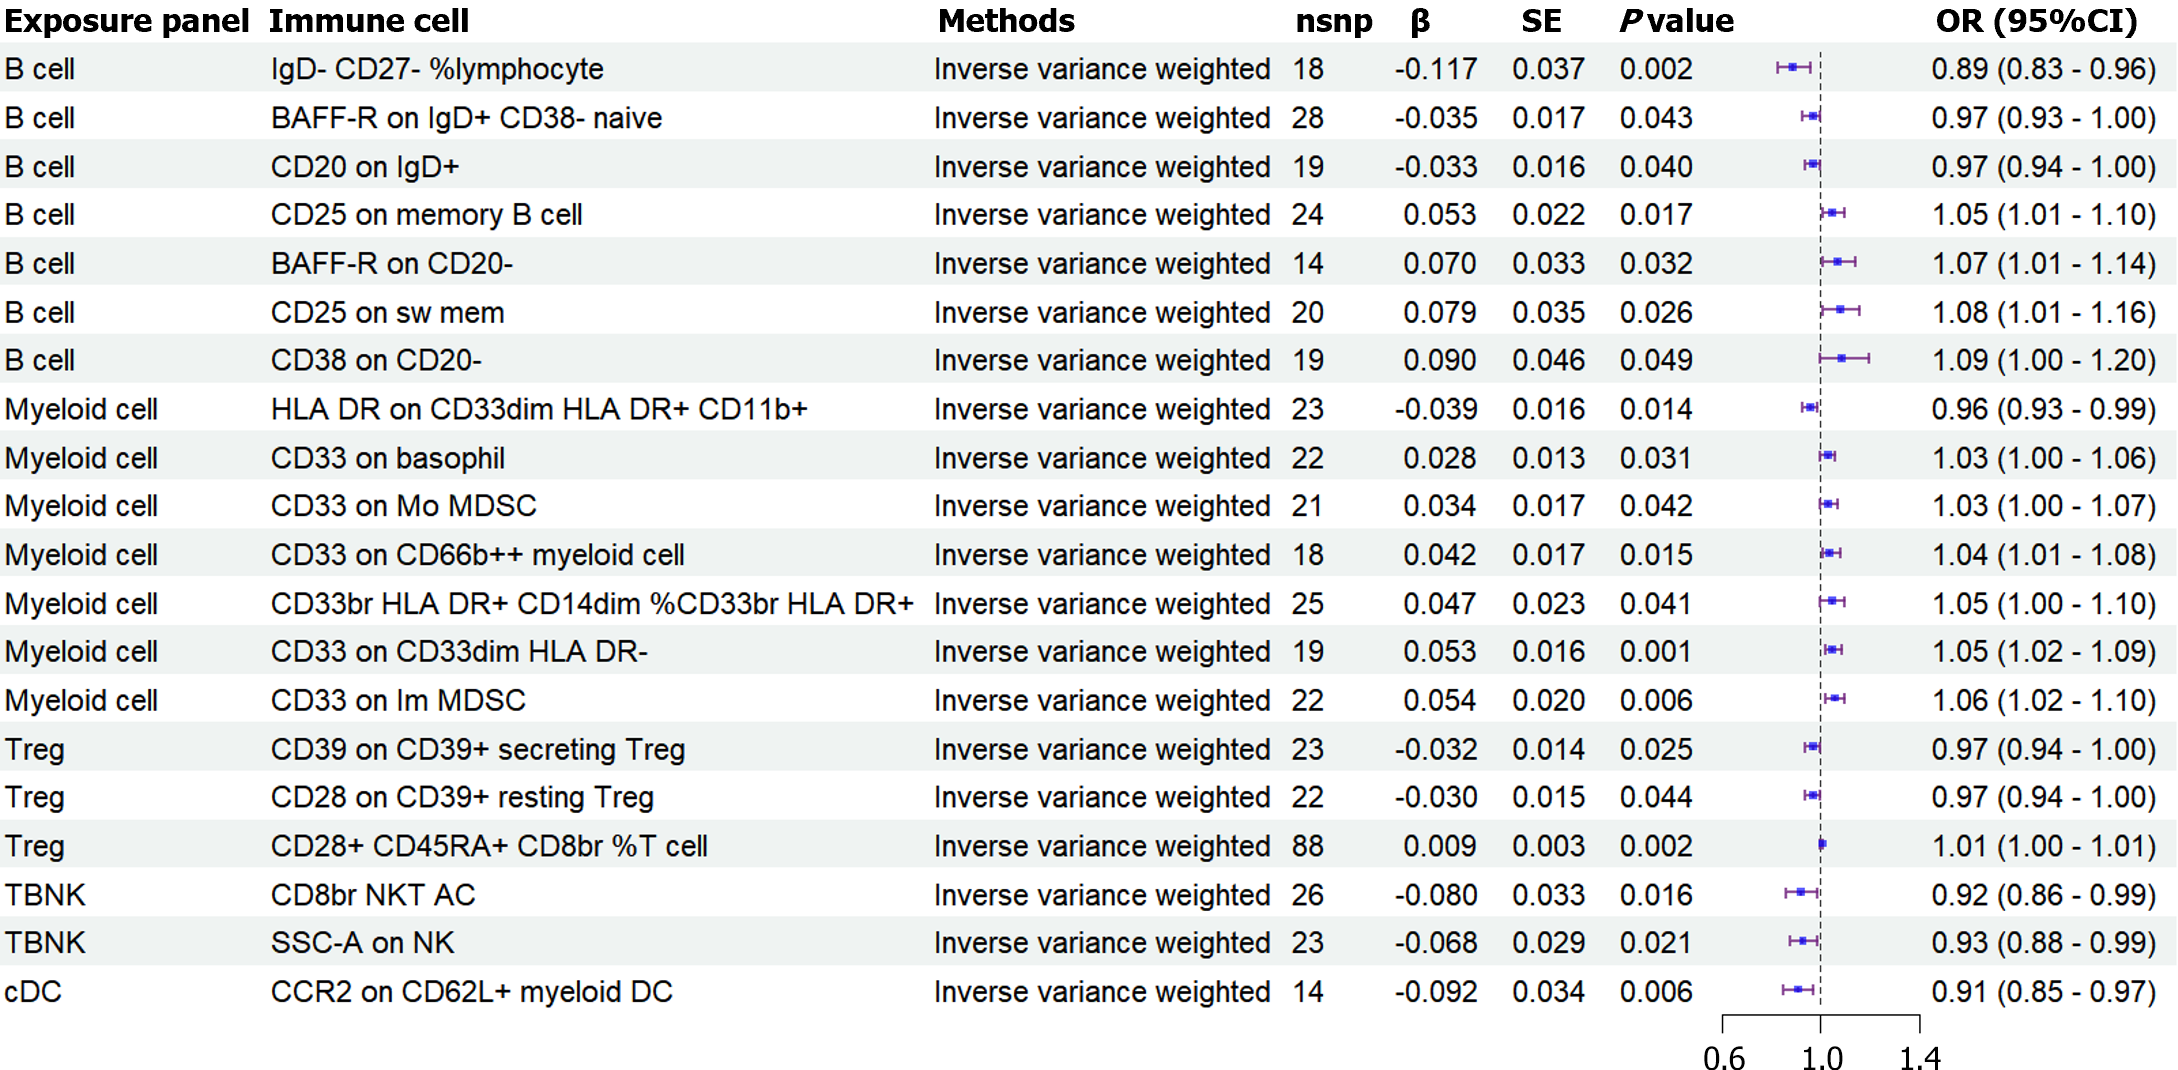
Figure 2 Forest plots showed the causal associations between liver cirrhosis and immune cell traits.
CI: Confidence interval; OR: Odds ratio; TBNK: T cells, B cells, and natural killer cells; cDC: Conventional dendritic cells; CD: Cluster of differentiation; BAFF: B-cell-activating factor; HLA: Human leukocyte antigen; DR: Dweller region; AC: Absolute count; MDSC: Myeloid-derived suppressor cells; NKT: Natural killer T cells; NK: Natural killer; CCR2: C-C motif chemokine receptor 2.
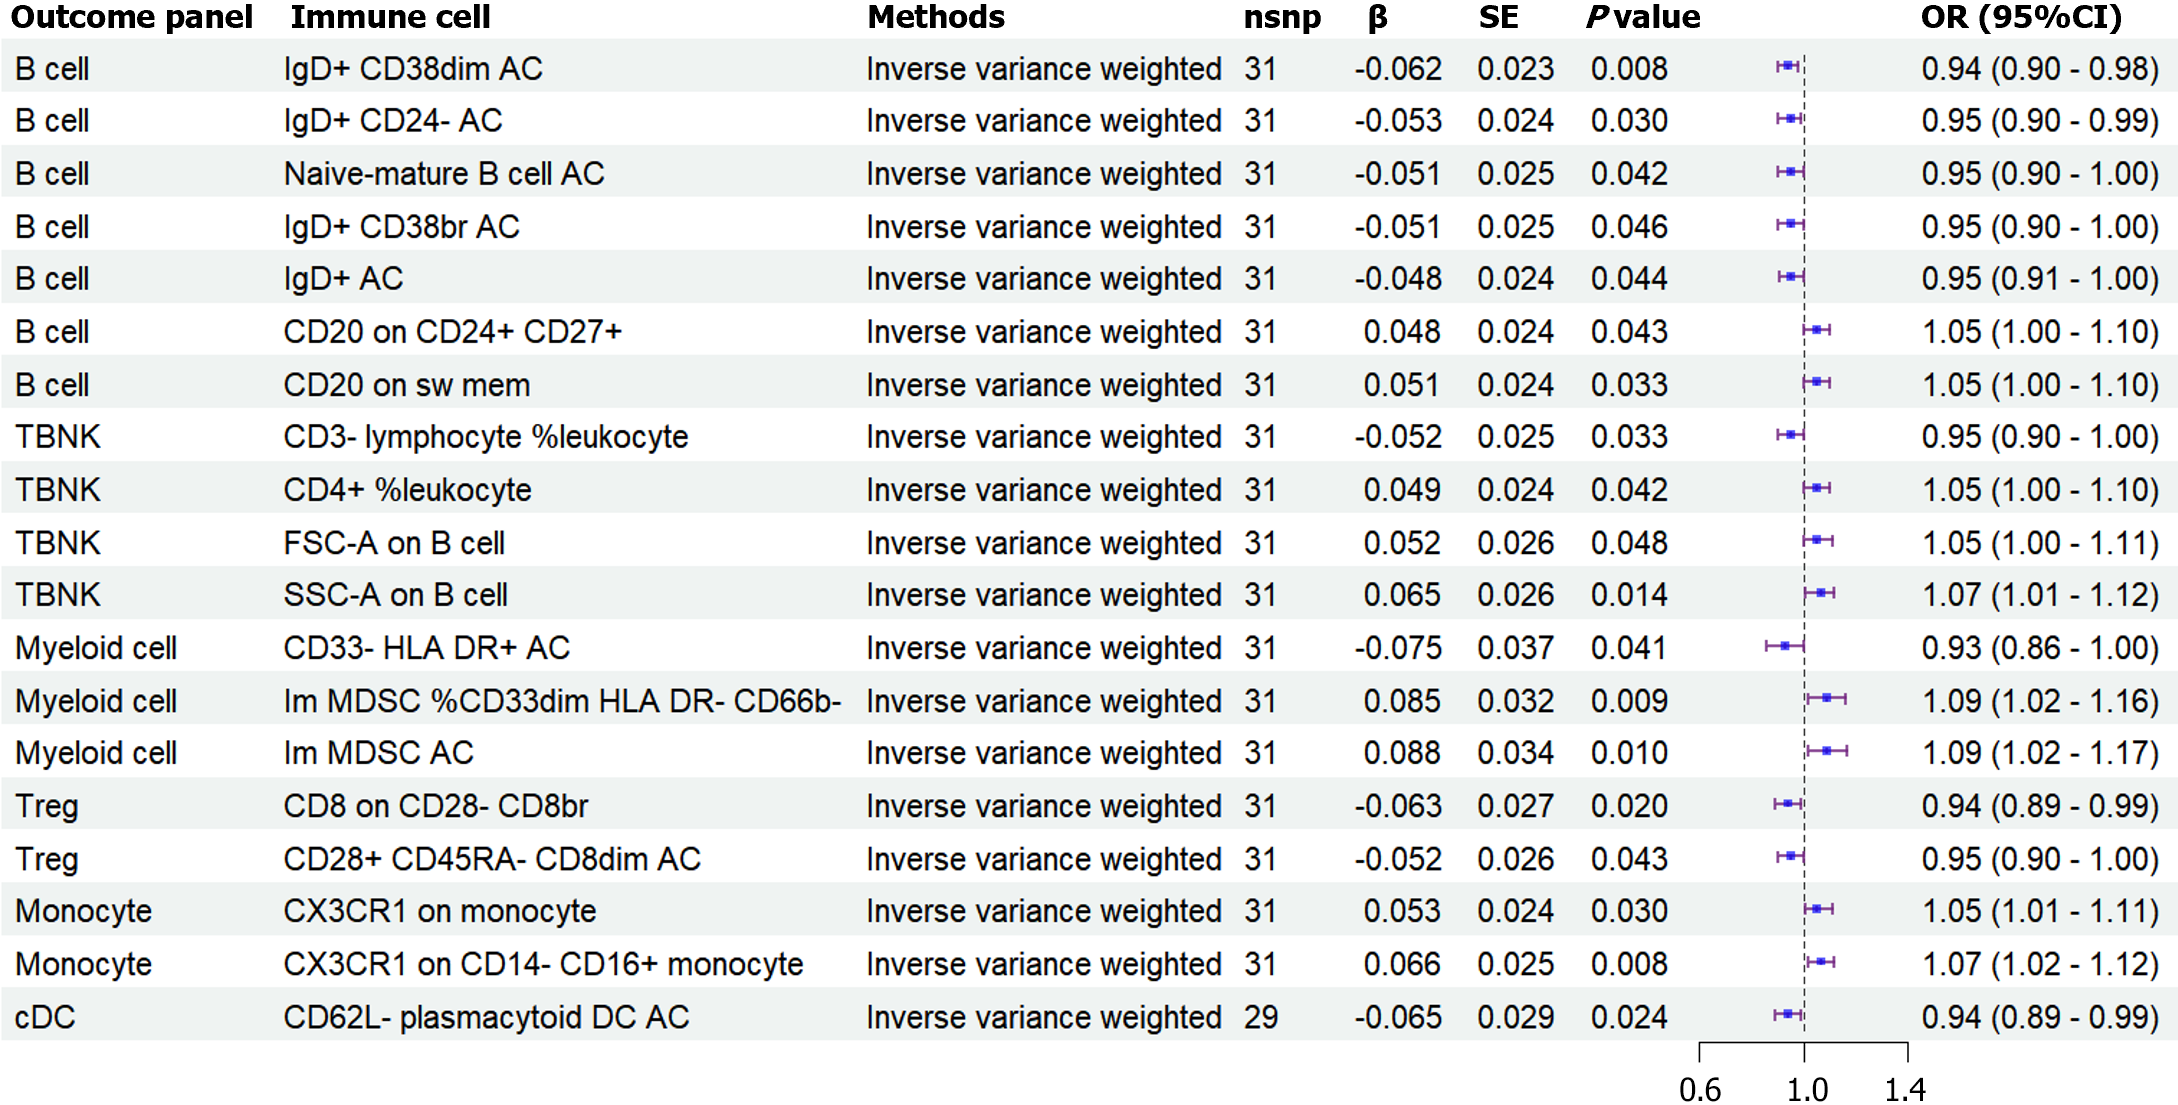
Figure 3 Forest plots showed the causal associations between immune cell traits and liver cirrhosis.
CI: Confidence interval; OR: Odds ratio; TBNK: T cells, B cells, and natural killer cells; cDC: Conventional dendritic cells; CD: Cluster of differentiation; AC: Absolute count; DR: Dweller region; FSC-A: Forward scatter-A; SSC-A: Side scatter-A; MDSC: Myeloid-derived suppressor cells.
- Citation: Li Y, Quan X, Tai Y, Wu YT, Wei B, Wu H. Causal association between 731 immunocyte phenotypes and liver cirrhosis: A bidirectional two-sample mendelian randomization analysis. World J Hepatol 2024; 16(8): 1156-1166
- URL: https://www.wjgnet.com/1948-5182/full/v16/i8/1156.htm
- DOI: https://dx.doi.org/10.4254/wjh.v16.i8.1156


