Copyright
©The Author(s) 2024.
World J Hepatol. Aug 27, 2024; 16(8): 1120-1130
Published online Aug 27, 2024. doi: 10.4254/wjh.v16.i8.1120
Published online Aug 27, 2024. doi: 10.4254/wjh.v16.i8.1120
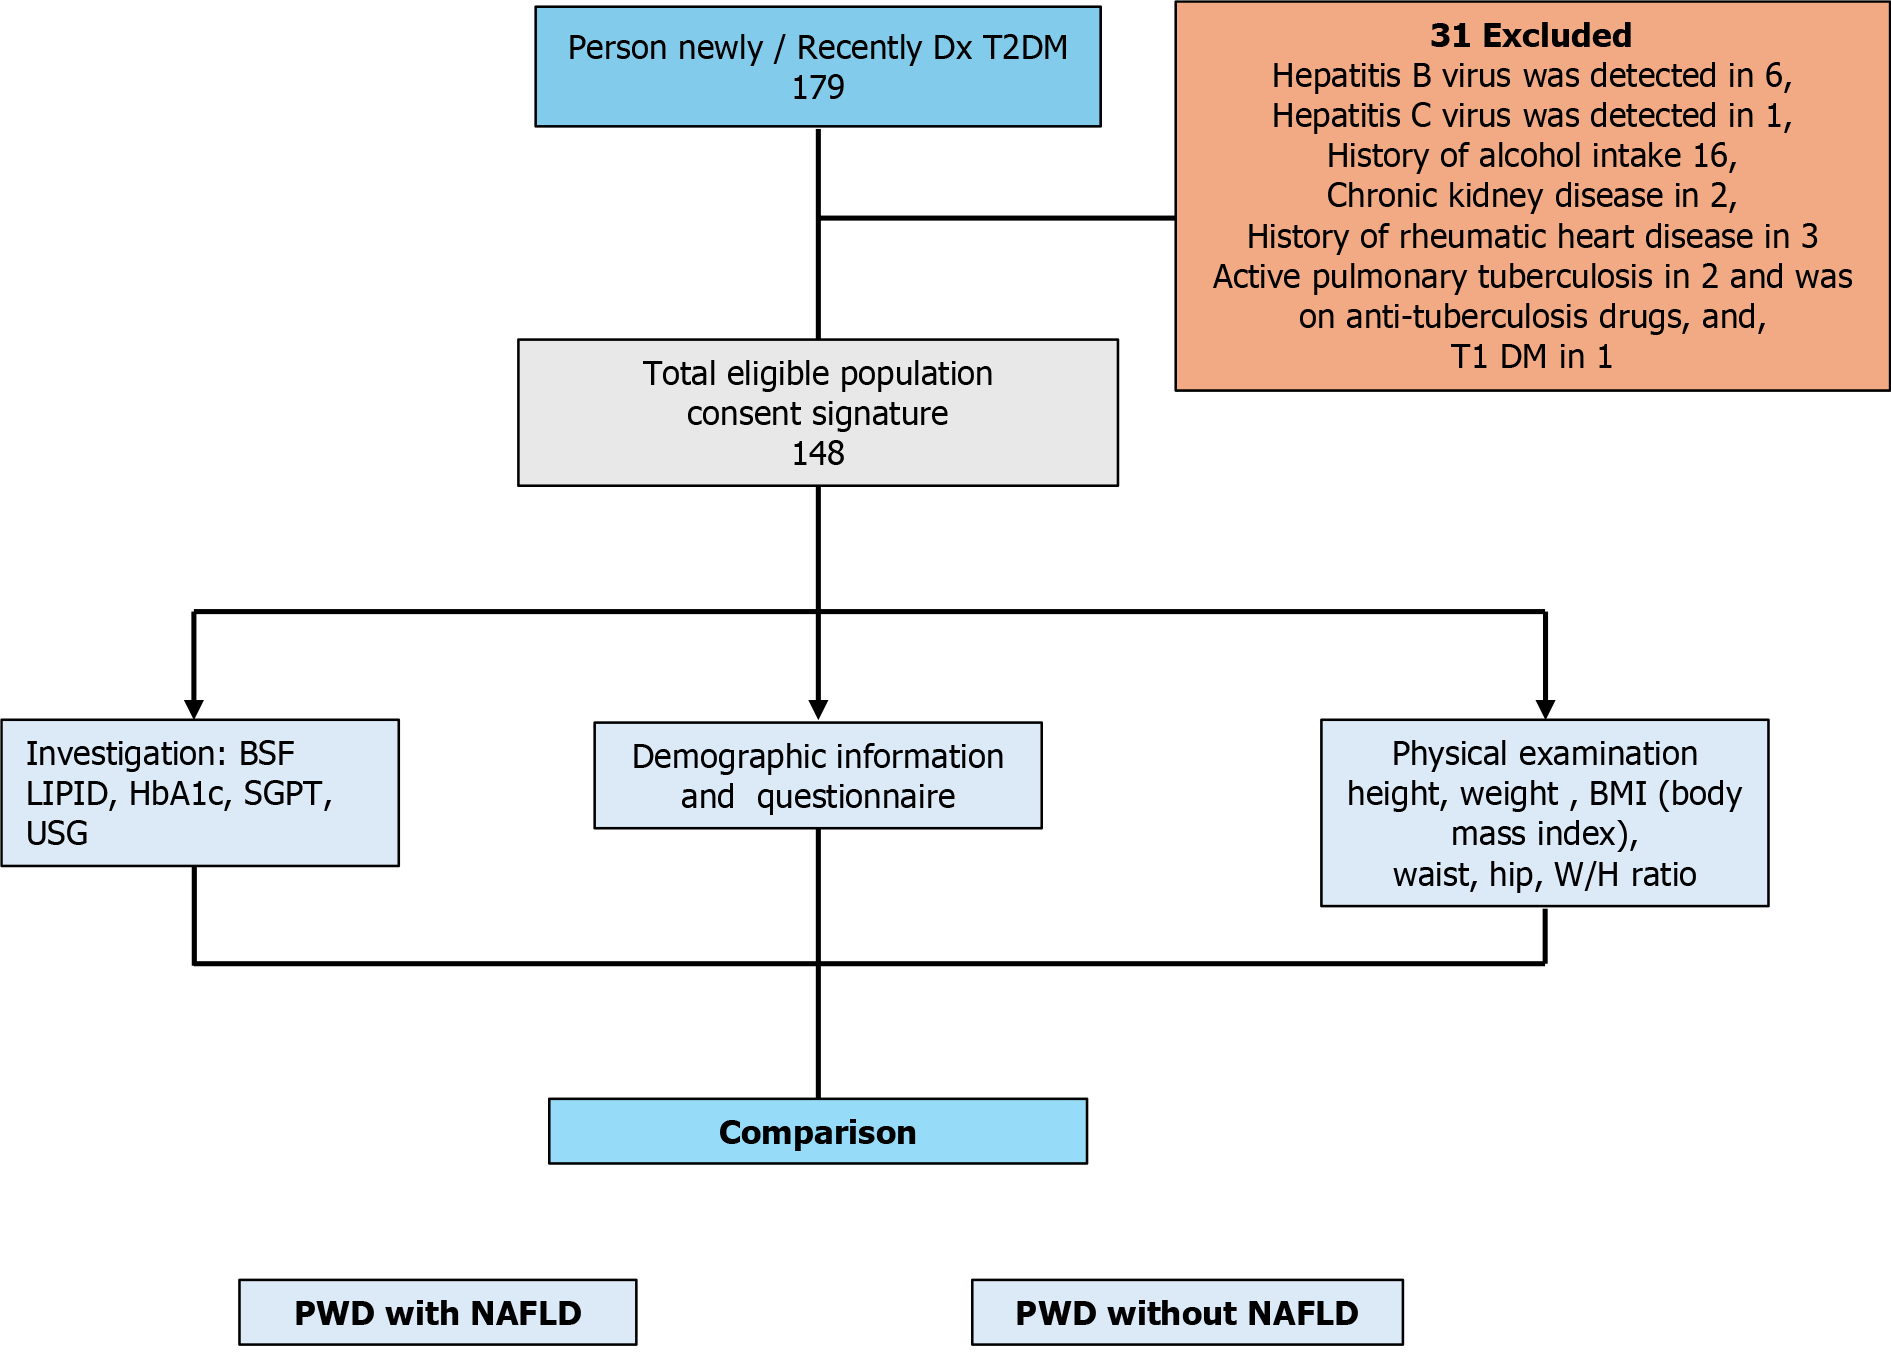
Figure 1 Flow diagram of patient inclusion.
T2DM: Type 2 diabetes mellitus; NAFLD: Non-alcoholic fatty liver disease; HbA1c: Haemoglobin A1c; BSF: Blood sugar fasting; SGPT: Serum glutamate pyruvate transaminase; USG: Ultrasonography; PWD: Persons with diabetes.
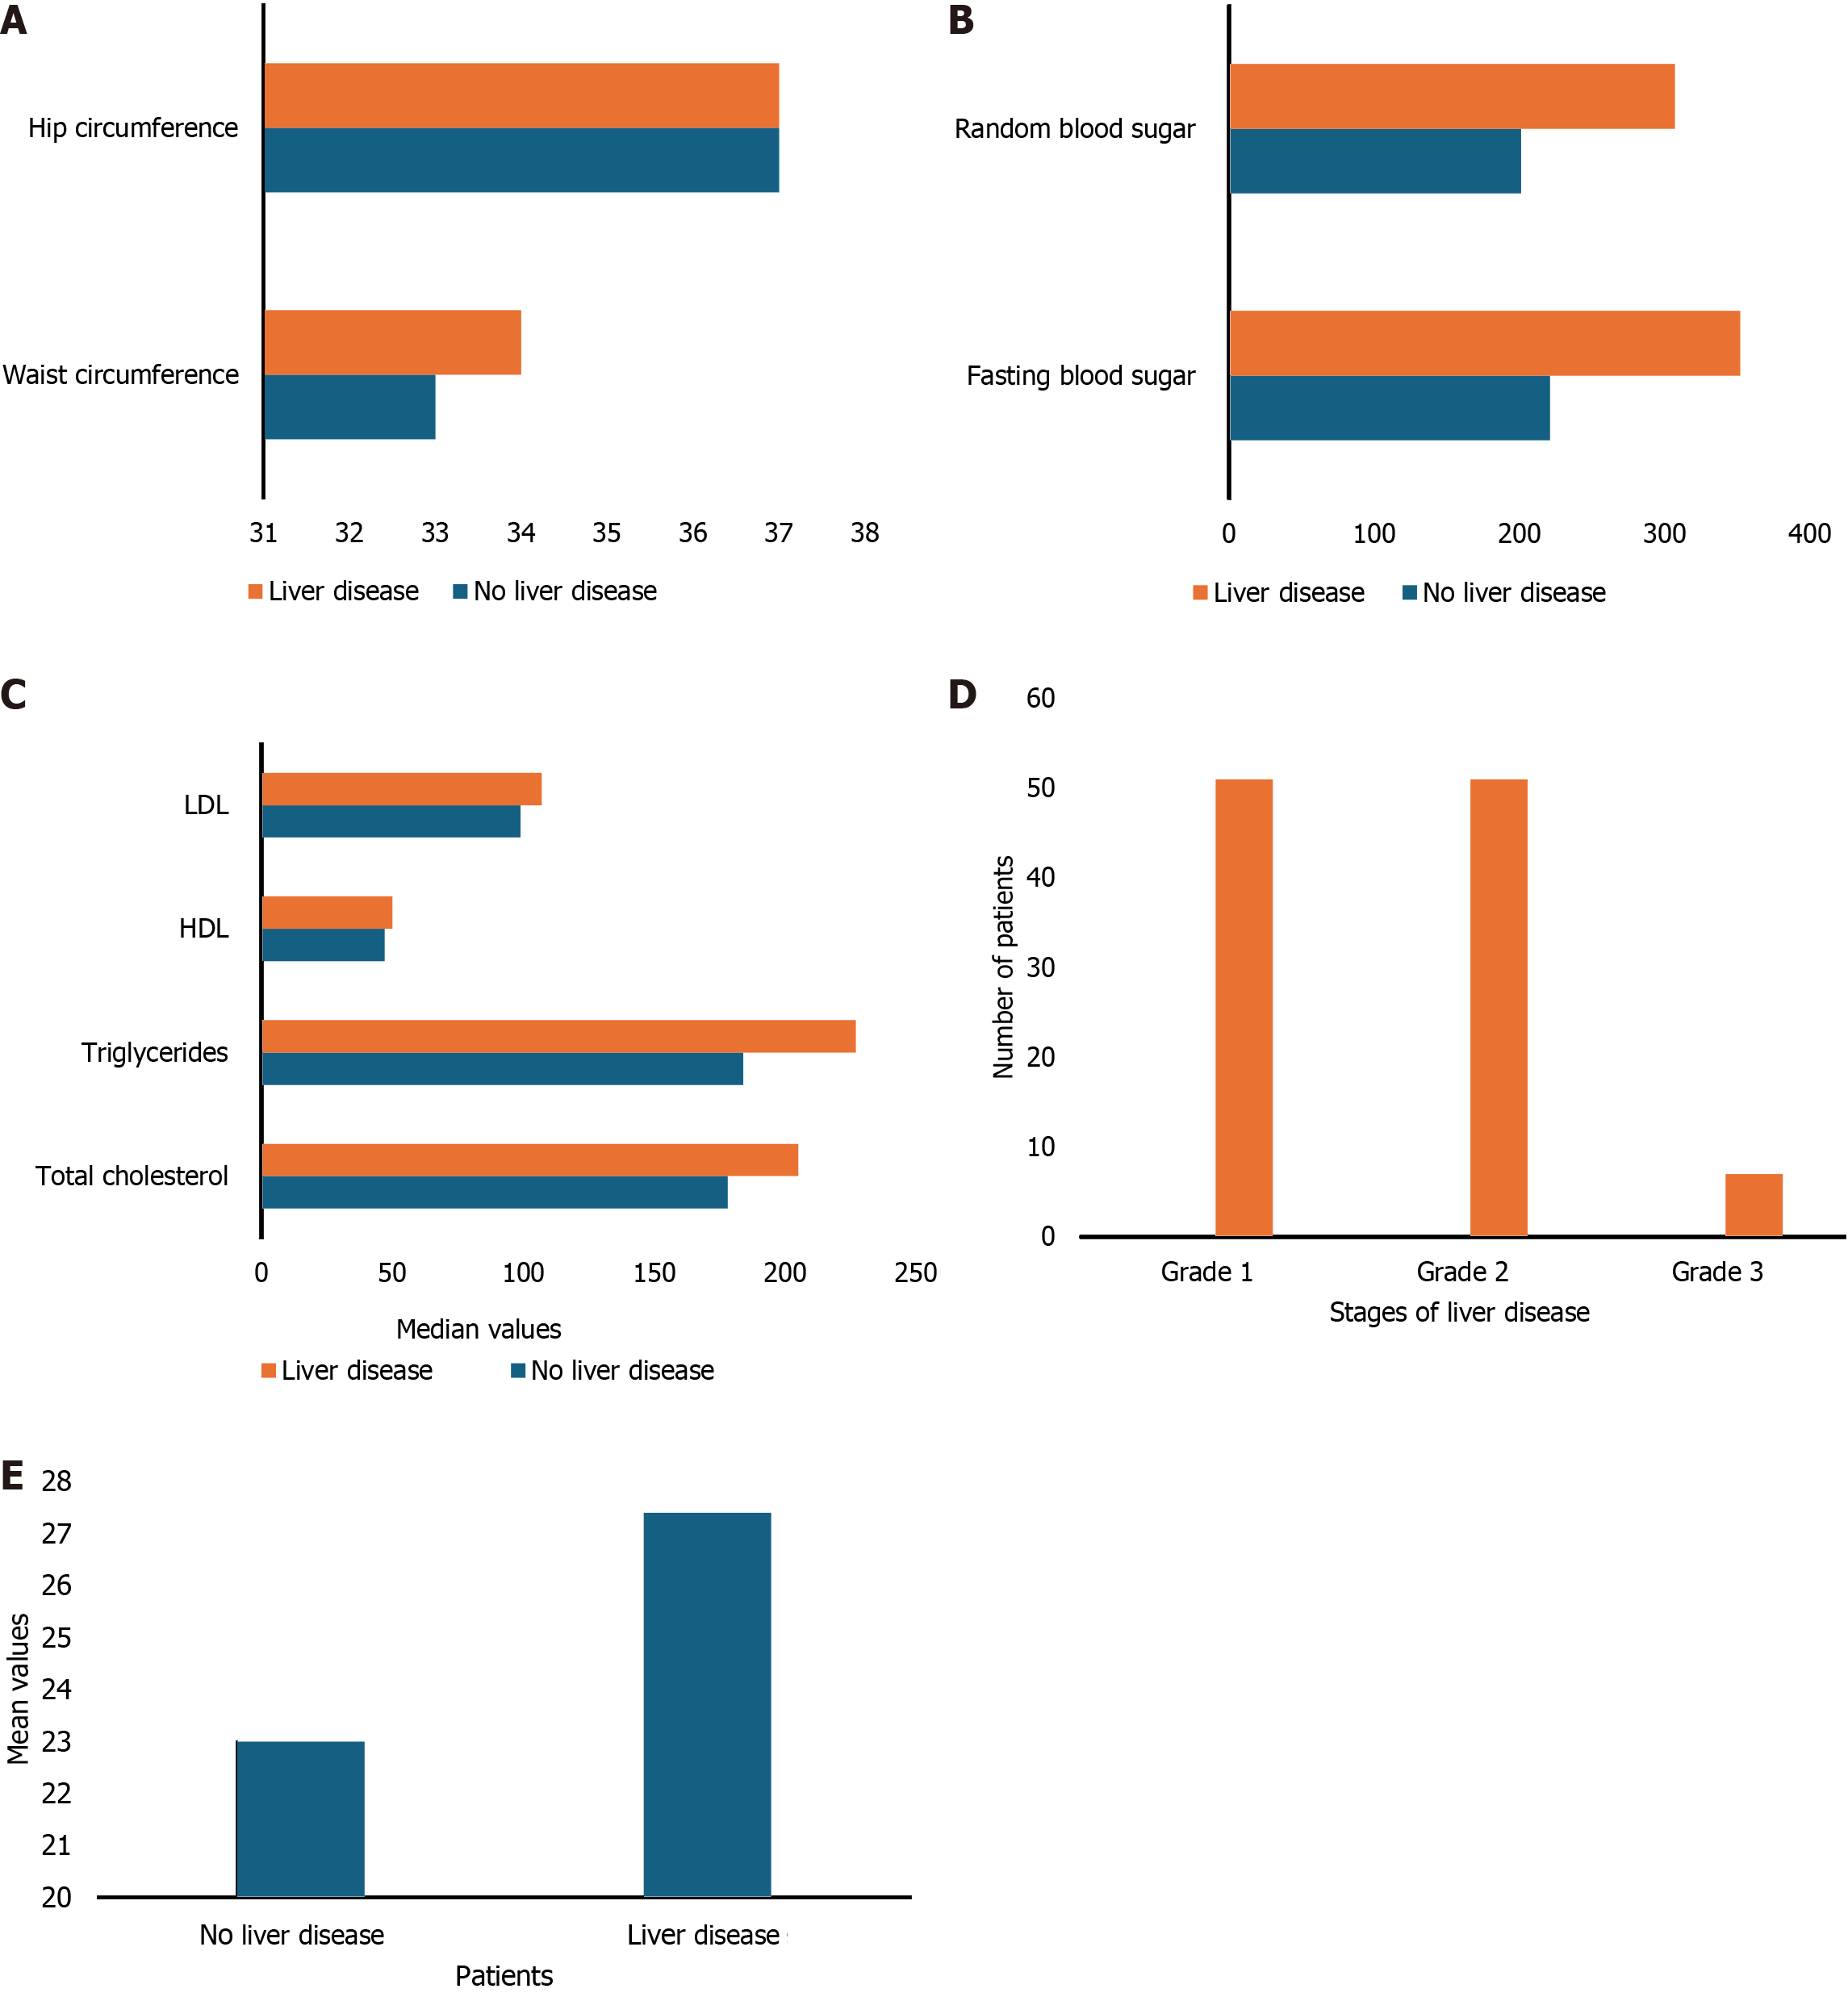
Figure 2 Graphical representation of clinical measurements, blood tests and ultrasound findings in patients with or without liver disease.
A: Anthropometric measurements (P < 0.001 for both); B: Glycaemic measurements (fasting blood sugar: P = 0.81; random blood sugar: P = 0.74); C: Lipid profile measurements (low-density lipoprotein cholesterol: P = 0.31, high-density lipoprotein cholesterol: 0.27, triglycerides: P = 0.009, total cholesterol: P = 0.012); D: Ultrasound scan findings (P < 0.001); E: Mean body mass index (P < 0.001).
- Citation: Mukherjee S, Mukherjee S, Shing Kwok C, Phillips A. Correlation between non-alcoholic fatty liver disease and metabolic parameters in persons with newly diagnosed type 2 diabetes mellitus. World J Hepatol 2024; 16(8): 1120-1130
- URL: https://www.wjgnet.com/1948-5182/full/v16/i8/1120.htm
- DOI: https://dx.doi.org/10.4254/wjh.v16.i8.1120


